| Param | Original file | Final file |
|---|---|---|
| Filename | modeM0/AS1A11_083T04_9000005272cztM0_level2_bc.evt | modeM0/AS1A11_083T04_9000005272cztM0_level2_quad_clean.evt |
| Size (bytes) | 978,586,560 | 299,229,120 |
| Size | 933.3 MB | 285.4 MB |
| Events in quadrant A | 5,050,953 | 1,985,449 |
| Events in quadrant B | 6,538,767 | 1,992,983 |
| Events in quadrant C | 7,909,354 | 1,935,515 |
| Events in quadrant D | 8,817,617 | 1,818,303 |
| Mode M9 | |||
|---|---|---|---|
| Quadrant | BADHDUFLAG | Total packets | Discarded packets |
| A | 0 | 96 | 0 |
| B | 0 | 96 | 0 |
| C | 0 | 96 | 0 |
| D | 0 | 96 | 0 |
| Mode SS | |||
|---|---|---|---|
| Quadrant | BADHDUFLAG | Total packets | Discarded packets |
| A | 0 | 394 | 0 |
| B | 0 | 394 | 0 |
| C | 0 | 394 | 0 |
| D | 0 | 394 | 0 |
| Mode M0 | |||
|---|---|---|---|
| Quadrant | BADHDUFLAG | Total packets | Discarded packets |
| A | 0 | 41646 | 0 |
| B | 0 | 48968 | 0 |
| C | 0 | 52754 | 0 |
| D | 0 | 62111 | 0 |
| Quadrant | Total seconds | Saturated seconds | Saturation percentage |
|---|---|---|---|
| A | 19330 | 55 | 0.284532% |
| B | 19330 | 565 | 2.922918% |
| C | 19330 | 571 | 2.953958% |
| D | 19330 | 2299 | 11.893430% |
Noise dominated data is calculated using 1-second bins in cleaned event files. If a bin has >2000 counts, and if more than 50% of those come from <1% of pixels, then it is considered to be noise-dominated and hence unusable.
| Quadrant | # 1 sec bins | Bins with >0 counts | Bins with >2000 counts | High rate bins dominated by noise | Noise dominated (total time) | Noise dominated (detector-on time) | Marked lightcurve |
|---|---|---|---|---|---|---|---|
| A | 28834 | 19335 | 9 | 9 | 0.03% | 0.05% |  |
| B | 28834 | 19330 | 41 | 41 | 0.14% | 0.21% |  |
| C | 28834 | 19333 | 39 | 39 | 0.14% | 0.20% |  |
| D | 28834 | 19323 | 101 | 101 | 0.35% | 0.52% |  |
Top three noisy pixels from each quadrant. If the there are fewer than three noisy pixels in the level2.evt file, extra rows are filled as -1
| Pixel properties | Quadrant properties | ||||||
|---|---|---|---|---|---|---|---|
| Quadrant | DetID | PixID | Counts | Sigma | Mean | Median | Sigma |
| A | 10 | 83 | 742592 | 3270.15 | 1020 | 1002 | 226.8 |
| A | 11 | 254 | 319617 | 1404.98 | 1020 | 1002 | 226.8 |
| A | 13 | 254 | 25429 | 107.71 | 1020 | 1002 | 226.8 |
| B | 0 | 229 | 865397 | 4252.9 | 1020 | 998 | 203.2 |
| B | 5 | 184 | 450925 | 2213.67 | 1020 | 998 | 203.2 |
| B | 5 | 172 | 396435 | 1945.58 | 1020 | 998 | 203.2 |
| C | 14 | 254 | 1381732 | 6102.23 | 987 | 983 | 226.3 |
| C | 0 | 10 | 991799 | 4378.92 | 987 | 983 | 226.3 |
| C | 15 | 214 | 765214 | 3377.52 | 987 | 983 | 226.3 |
| D | 12 | 17 | 3078326 | 13865.65 | 946 | 919 | 221.9 |
| D | 2 | 250 | 488960 | 2198.93 | 946 | 919 | 221.9 |
| D | 2 | 153 | 355714 | 1598.57 | 946 | 919 | 221.9 |
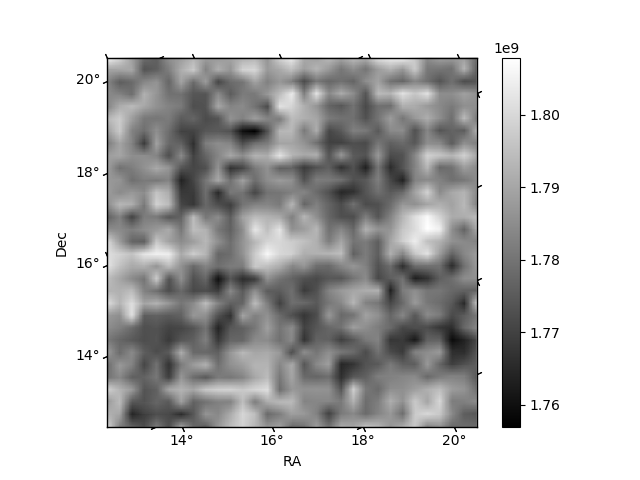
Histogram calculated using DETX and DETY for each event in the final _common_clean file
| Quadrant A |  |
 |
Quadrant B |
|---|---|---|---|
| Quadrant D |  |
 |
Quadrant C |
| Plot type | Count rate plots | Images |
|---|---|---|
| Comparison with Poisson distribution Blue bars denote a histogram of data divided into 1 sec bins. Red curve is a Poisson curve with rate = median count rate of data. |
 |
 |
| Quadrant-wise count rates Data is divided into 100 sec bins |
 |
|
| Module-wise count rates for Quadrant A Data is divided into 100 sec bins |
 |
 |
| Module-wise count rates for Quadrant B Data is divided into 100 sec bins |
 |
 |
| Module-wise count rates for Quadrant C Data is divided into 100 sec bins |
 |
 |
| Module-wise count rates for Quadrant D Data is divided into 100 sec bins |
 |
 |
| Parameter | Plot |
|---|---|
| CZT HV Monitor |  |
| D_VDD |  |
| Temperature 1 |  |
| Veto HV Monitor |  |
| Veto LLD |  |
| Alpha Counter |  |
| _CPM_Rate |  |
| CZT Counter |  |
| +2.5 Volts monitor | 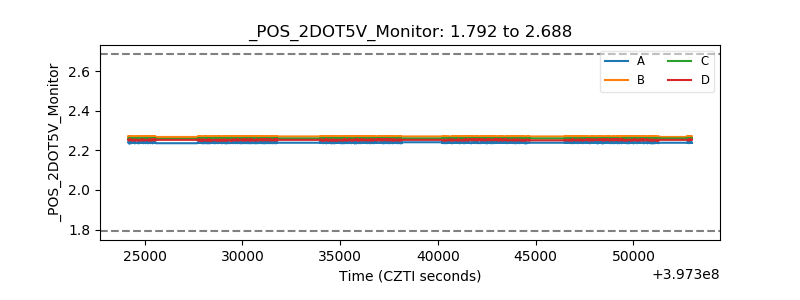 |
| +5 Volts monitor |  |
| _ROLL_ROT |  |
| _Roll_DEC | 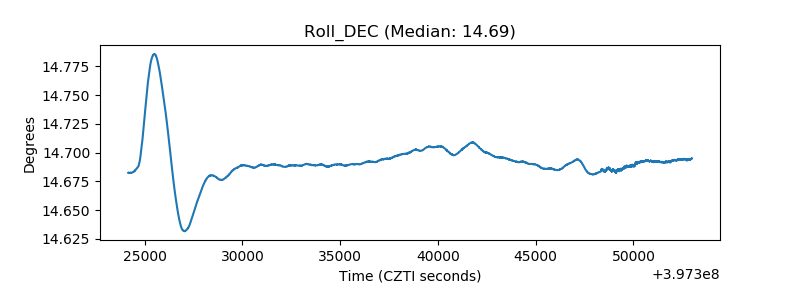 |
| _Roll_RA |  |
| Veto Counter |  |