| Param | Original file | Final file |
|---|---|---|
| Filename | modeM0/AS1A11_046T02_9000005274cztM0_level2_bc.evt | modeM0/AS1A11_046T02_9000005274cztM0_level2_quad_clean.evt |
| Size (bytes) | 2,801,476,800 | 530,743,680 |
| Size | 2.6 GB | 506.2 MB |
| Events in quadrant A | 12,291,138 | 3,373,221 |
| Events in quadrant B | 14,858,773 | 3,369,547 |
| Events in quadrant C | 19,828,601 | 3,284,558 |
| Events in quadrant D | 34,689,199 | 2,841,000 |
| Mode M9 | |||
|---|---|---|---|
| Quadrant | BADHDUFLAG | Total packets | Discarded packets |
| A | 0 | 169 | 0 |
| B | 0 | 169 | 0 |
| C | 0 | 169 | 0 |
| D | 0 | 169 | 0 |
| Mode SS | |||
|---|---|---|---|
| Quadrant | BADHDUFLAG | Total packets | Discarded packets |
| A | 0 | 956 | 0 |
| B | 0 | 956 | 0 |
| C | 0 | 956 | 0 |
| D | 0 | 956 | 0 |
| Mode M0 | |||
|---|---|---|---|
| Quadrant | BADHDUFLAG | Total packets | Discarded packets |
| A | 0 | 101188 | 0 |
| B | 0 | 116185 | 0 |
| C | 0 | 128048 | 0 |
| D | 0 | 206128 | 0 |
| Quadrant | Total seconds | Saturated seconds | Saturation percentage |
|---|---|---|---|
| A | 46679 | 87 | 0.186379% |
| B | 46674 | 1549 | 3.318764% |
| C | 46678 | 2593 | 5.555079% |
| D | 46679 | 11393 | 24.407121% |
Noise dominated data is calculated using 1-second bins in cleaned event files. If a bin has >2000 counts, and if more than 50% of those come from <1% of pixels, then it is considered to be noise-dominated and hence unusable.
| Quadrant | # 1 sec bins | Bins with >0 counts | Bins with >2000 counts | High rate bins dominated by noise | Noise dominated (total time) | Noise dominated (detector-on time) | Marked lightcurve |
|---|---|---|---|---|---|---|---|
| A | 63648 | 46690 | 4 | 4 | 0.01% | 0.01% |  |
| B | 63648 | 46679 | 80 | 80 | 0.13% | 0.17% |  |
| C | 63648 | 46674 | 923 | 923 | 1.45% | 1.98% |  |
| D | 63648 | 46650 | 937 | 937 | 1.47% | 2.01% |  |
Top three noisy pixels from each quadrant. If the there are fewer than three noisy pixels in the level2.evt file, extra rows are filled as -1
| Pixel properties | Quadrant properties | ||||||
|---|---|---|---|---|---|---|---|
| Quadrant | DetID | PixID | Counts | Sigma | Mean | Median | Sigma |
| A | 10 | 83 | 1751642 | 3198.0 | 2483 | 2447 | 547.0 |
| A | 11 | 254 | 647255 | 1178.88 | 2483 | 2447 | 547.0 |
| A | 9 | 143 | 105708 | 188.79 | 2483 | 2447 | 547.0 |
| B | 5 | 172 | 2144278 | 4411.82 | 2463 | 2413 | 485.5 |
| B | 5 | 184 | 1568050 | 3224.9 | 2463 | 2413 | 485.5 |
| B | 0 | 229 | 488011 | 1000.24 | 2463 | 2413 | 485.5 |
| C | 10 | 20 | 4265284 | 8007.29 | 2351 | 2336 | 532.4 |
| C | 15 | 214 | 1824847 | 3423.31 | 2351 | 2336 | 532.4 |
| C | 14 | 254 | 1720954 | 3228.16 | 2351 | 2336 | 532.4 |
| D | 12 | 17 | 11546383 | 22438.24 | 2156 | 2092 | 514.5 |
| D | 6 | 112 | 4846603 | 9416.11 | 2156 | 2092 | 514.5 |
| D | 1 | 52 | 4128232 | 8019.84 | 2156 | 2092 | 514.5 |
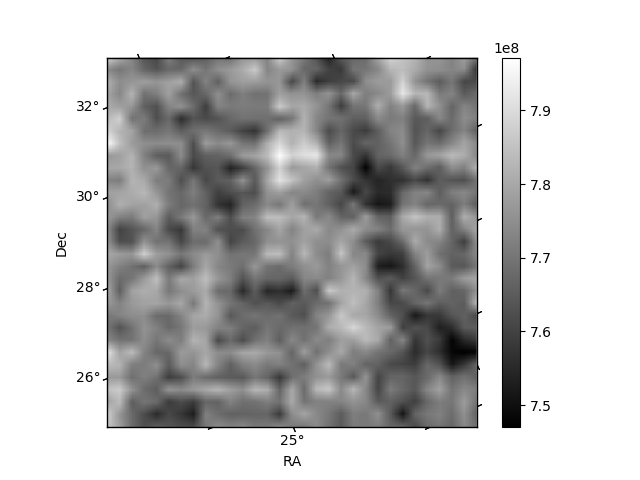
Histogram calculated using DETX and DETY for each event in the final _common_clean file
| Quadrant A |  |
 |
Quadrant B |
|---|---|---|---|
| Quadrant D |  |
 |
Quadrant C |
| Plot type | Count rate plots | Images |
|---|---|---|
| Comparison with Poisson distribution Blue bars denote a histogram of data divided into 1 sec bins. Red curve is a Poisson curve with rate = median count rate of data. |
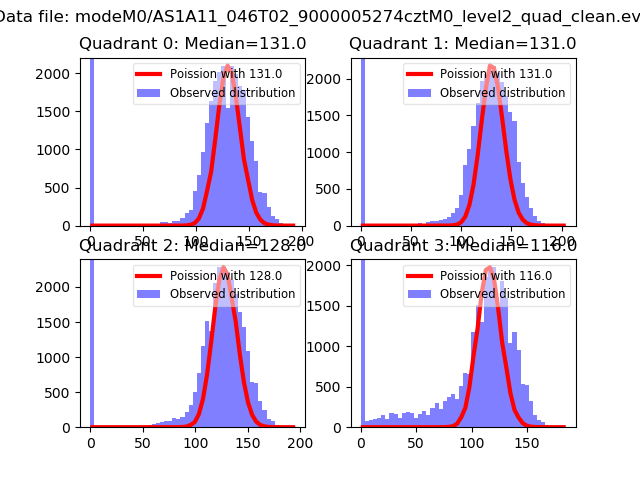 |
 |
| Quadrant-wise count rates Data is divided into 100 sec bins |
 |
|
| Module-wise count rates for Quadrant A Data is divided into 100 sec bins |
 |
 |
| Module-wise count rates for Quadrant B Data is divided into 100 sec bins |
 |
 |
| Module-wise count rates for Quadrant C Data is divided into 100 sec bins |
 |
 |
| Module-wise count rates for Quadrant D Data is divided into 100 sec bins |
 |
 |
| Parameter | Plot |
|---|---|
| CZT HV Monitor |  |
| D_VDD | 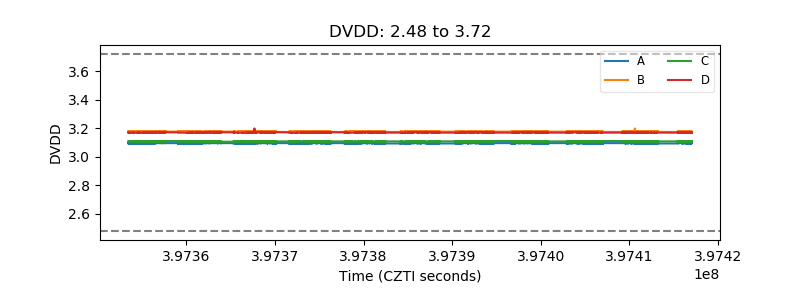 |
| Temperature 1 |  |
| Veto HV Monitor |  |
| Veto LLD |  |
| Alpha Counter |  |
| _CPM_Rate |  |
| CZT Counter |  |
| +2.5 Volts monitor |  |
| +5 Volts monitor |  |
| _ROLL_ROT |  |
| _Roll_DEC |  |
| _Roll_RA |  |
| Veto Counter | 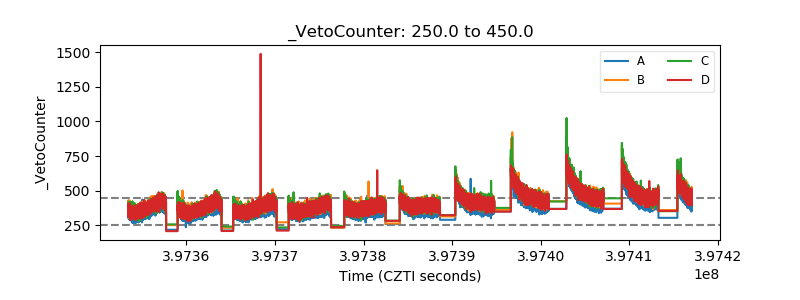 |