| Param | Original file | Final file |
|---|---|---|
| Filename | modeM0/AS1T05_046T01_9000005266cztM0_level2_bc.evt | modeM0/AS1T05_046T01_9000005266cztM0_level2_quad_clean.evt |
| Size (bytes) | 1,850,028,480 | 474,062,400 |
| Size | 1.7 GB | 452.1 MB |
| Events in quadrant A | 9,816,035 | 3,026,117 |
| Events in quadrant B | 13,498,425 | 2,945,315 |
| Events in quadrant C | 13,850,161 | 2,894,969 |
| Events in quadrant D | 16,153,323 | 2,757,707 |
| Mode M0 | |||
|---|---|---|---|
| Quadrant | BADHDUFLAG | Total packets | Discarded packets |
| A | 0 | 83615 | 0 |
| B | 0 | 101875 | 0 |
| C | 0 | 97449 | 0 |
| D | 0 | 109560 | 0 |
| Mode SS | |||
|---|---|---|---|
| Quadrant | BADHDUFLAG | Total packets | Discarded packets |
| A | 0 | 812 | 0 |
| B | 0 | 812 | 0 |
| C | 0 | 812 | 0 |
| D | 0 | 812 | 0 |
| Mode M9 | |||
|---|---|---|---|
| Quadrant | BADHDUFLAG | Total packets | Discarded packets |
| A | 0 | 161 | 0 |
| B | 0 | 161 | 0 |
| C | 0 | 161 | 0 |
| D | 0 | 161 | 0 |
| Quadrant | Total seconds | Saturated seconds | Saturation percentage |
|---|---|---|---|
| A | 39817 | 77 | 0.193385% |
| B | 39817 | 1559 | 3.915413% |
| C | 39816 | 873 | 2.192586% |
| D | 39816 | 1566 | 3.933092% |
Noise dominated data is calculated using 1-second bins in cleaned event files. If a bin has >2000 counts, and if more than 50% of those come from <1% of pixels, then it is considered to be noise-dominated and hence unusable.
| Quadrant | # 1 sec bins | Bins with >0 counts | Bins with >2000 counts | High rate bins dominated by noise | Noise dominated (total time) | Noise dominated (detector-on time) | Marked lightcurve |
|---|---|---|---|---|---|---|---|
| A | 61388 | 39826 | 5 | 5 | 0.01% | 0.01% |  |
| B | 61387 | 39817 | 76 | 76 | 0.12% | 0.19% |  |
| C | 61387 | 39815 | 207 | 207 | 0.34% | 0.52% |  |
| D | 61387 | 39816 | 257 | 257 | 0.42% | 0.65% |  |
Top three noisy pixels from each quadrant. If the there are fewer than three noisy pixels in the level2.evt file, extra rows are filled as -1
| Pixel properties | Quadrant properties | ||||||
|---|---|---|---|---|---|---|---|
| Quadrant | DetID | PixID | Counts | Sigma | Mean | Median | Sigma |
| A | 10 | 83 | 1354408 | 2884.28 | 2118 | 2086 | 468.9 |
| A | 9 | 143 | 117681 | 246.55 | 2118 | 2086 | 468.9 |
| A | 13 | 6 | 110621 | 231.49 | 2118 | 2086 | 468.9 |
| B | 5 | 184 | 3690090 | 8942.82 | 2080 | 2038 | 412.4 |
| B | 5 | 172 | 807710 | 1953.6 | 2080 | 2038 | 412.4 |
| B | 5 | 255 | 192645 | 462.19 | 2080 | 2038 | 412.4 |
| C | 15 | 214 | 1595190 | 3476.19 | 2011 | 1997 | 458.3 |
| C | 0 | 10 | 1435462 | 3127.68 | 2011 | 1997 | 458.3 |
| C | 1 | 23 | 1176851 | 2563.41 | 2011 | 1997 | 458.3 |
| D | 12 | 235 | 1731564 | 3599.85 | 2028 | 1967 | 480.5 |
| D | 2 | 250 | 1697523 | 3529.0 | 2028 | 1967 | 480.5 |
| D | 2 | 153 | 1197713 | 2488.73 | 2028 | 1967 | 480.5 |
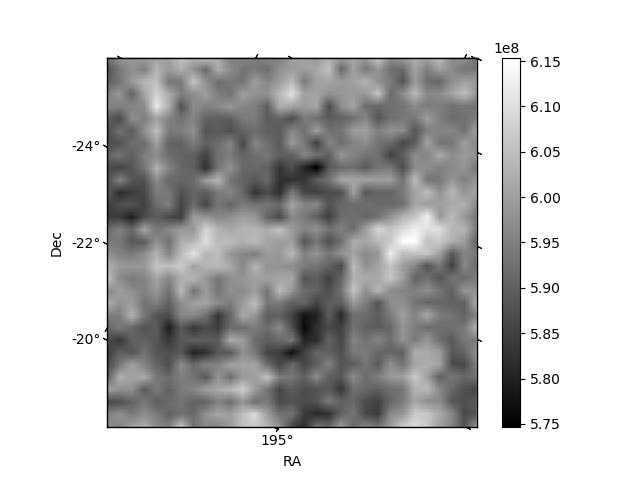
Histogram calculated using DETX and DETY for each event in the final _common_clean file
| Quadrant A |  |
 |
Quadrant B |
|---|---|---|---|
| Quadrant D |  |
 |
Quadrant C |
| Plot type | Count rate plots | Images |
|---|---|---|
| Comparison with Poisson distribution Blue bars denote a histogram of data divided into 1 sec bins. Red curve is a Poisson curve with rate = median count rate of data. |
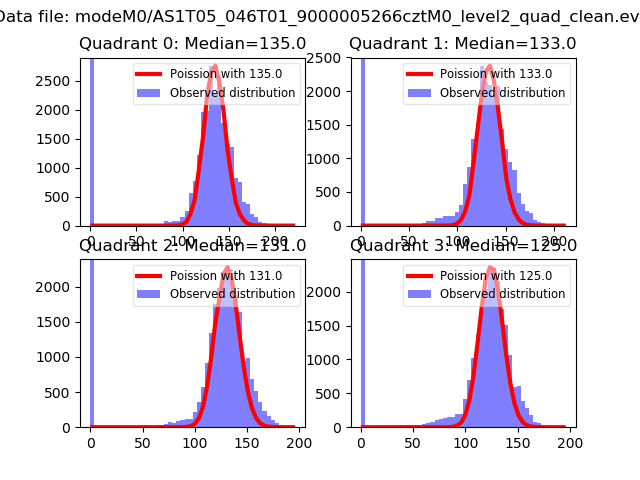 |
 |
| Quadrant-wise count rates Data is divided into 100 sec bins |
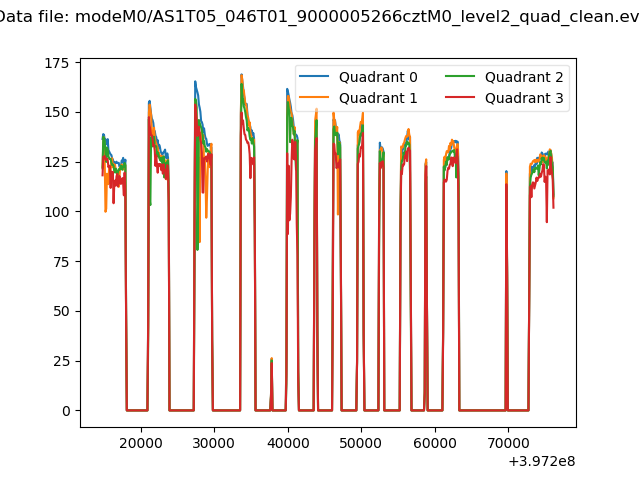 |
|
| Module-wise count rates for Quadrant A Data is divided into 100 sec bins |
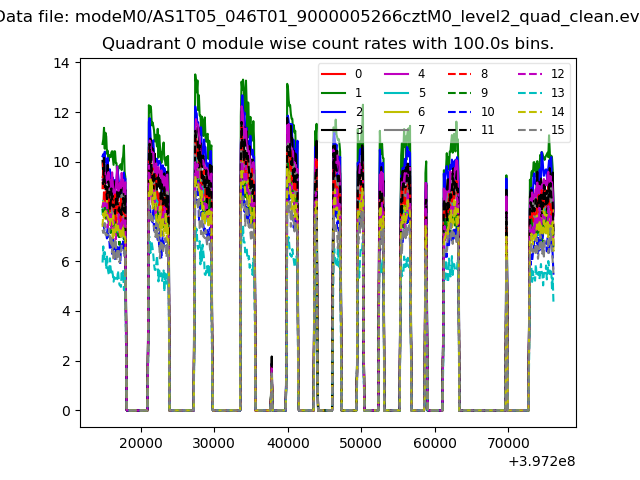 |
 |
| Module-wise count rates for Quadrant B Data is divided into 100 sec bins |
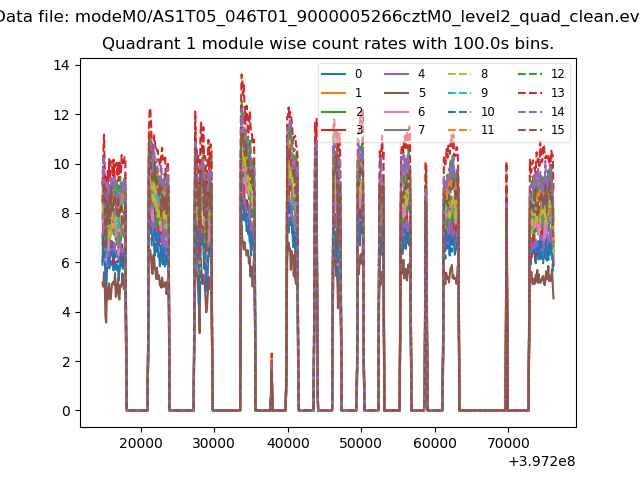 |
 |
| Module-wise count rates for Quadrant C Data is divided into 100 sec bins |
 |
 |
| Module-wise count rates for Quadrant D Data is divided into 100 sec bins |
 |
 |
| Parameter | Plot |
|---|---|
| CZT HV Monitor |  |
| D_VDD |  |
| Temperature 1 | 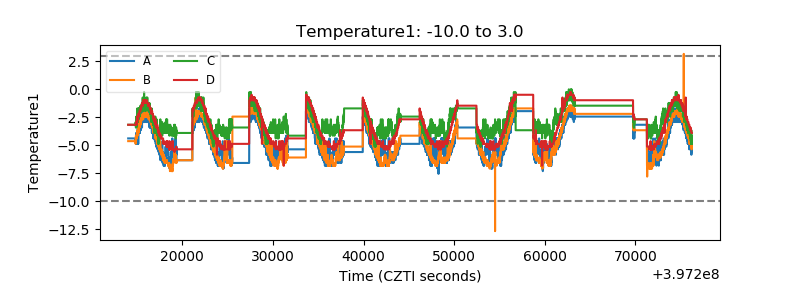 |
| Veto HV Monitor |  |
| Veto LLD |  |
| Alpha Counter |  |
| _CPM_Rate |  |
| CZT Counter |  |
| +2.5 Volts monitor |  |
| +5 Volts monitor |  |
| _ROLL_ROT |  |
| _Roll_DEC |  |
| _Roll_RA |  |
| Veto Counter |  |