| Param | Original file | Final file |
|---|---|---|
| Filename | modeM0/AS1C07_015T03_9000005260cztM0_level2_bc.evt | modeM0/AS1C07_015T03_9000005260cztM0_level2_quad_clean.evt |
| Size (bytes) | 330,382,080 | 122,529,600 |
| Size | 315.1 MB | 116.9 MB |
| Events in quadrant A | 1,921,267 | 805,887 |
| Events in quadrant B | 2,356,941 | 818,781 |
| Events in quadrant C | 2,919,428 | 787,876 |
| Events in quadrant D | 2,267,985 | 754,382 |
| Mode SS | |||
|---|---|---|---|
| Quadrant | BADHDUFLAG | Total packets | Discarded packets |
| A | 0 | 160 | 0 |
| B | 0 | 160 | 0 |
| C | 0 | 160 | 0 |
| D | 0 | 160 | 0 |
| Mode M9 | |||
|---|---|---|---|
| Quadrant | BADHDUFLAG | Total packets | Discarded packets |
| A | 0 | 26 | 0 |
| B | 0 | 26 | 0 |
| C | 0 | 26 | 0 |
| D | 0 | 26 | 0 |
| Mode M0 | |||
|---|---|---|---|
| Quadrant | BADHDUFLAG | Total packets | Discarded packets |
| A | 0 | 16551 | 0 |
| B | 0 | 18680 | 0 |
| C | 0 | 19691 | 0 |
| D | 0 | 17861 | 0 |
| Quadrant | Total seconds | Saturated seconds | Saturation percentage |
|---|---|---|---|
| A | 7823 | 19 | 0.242874% |
| B | 7823 | 215 | 2.748306% |
| C | 7823 | 200 | 2.556564% |
| D | 7823 | 79 | 1.009843% |
Noise dominated data is calculated using 1-second bins in cleaned event files. If a bin has >2000 counts, and if more than 50% of those come from <1% of pixels, then it is considered to be noise-dominated and hence unusable.
| Quadrant | # 1 sec bins | Bins with >0 counts | Bins with >2000 counts | High rate bins dominated by noise | Noise dominated (total time) | Noise dominated (detector-on time) | Marked lightcurve |
|---|---|---|---|---|---|---|---|
| A | 9616 | 7824 | 0 | 0 | 0.00% | 0.00% | 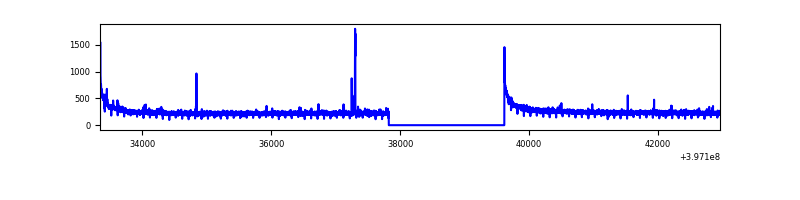 |
| B | 9615 | 7822 | 11 | 11 | 0.11% | 0.14% |  |
| C | 9615 | 7822 | 92 | 92 | 0.96% | 1.18% |  |
| D | 9615 | 7822 | 20 | 20 | 0.21% | 0.26% |  |
Top three noisy pixels from each quadrant. If the there are fewer than three noisy pixels in the level2.evt file, extra rows are filled as -1
| Pixel properties | Quadrant properties | ||||||
|---|---|---|---|---|---|---|---|
| Quadrant | DetID | PixID | Counts | Sigma | Mean | Median | Sigma |
| A | 10 | 83 | 249143 | 2580.8 | 427 | 420 | 96.4 |
| A | 9 | 143 | 17493 | 177.15 | 427 | 420 | 96.4 |
| A | 13 | 254 | 7748 | 76.04 | 427 | 420 | 96.4 |
| B | 5 | 172 | 541634 | 6282.15 | 429 | 421 | 86.2 |
| B | 4 | 81 | 124096 | 1435.56 | 429 | 421 | 86.2 |
| B | 0 | 213 | 28164 | 322.03 | 429 | 421 | 86.2 |
| C | 1 | 23 | 754057 | 7893.98 | 415 | 413 | 95.5 |
| C | 15 | 214 | 314993 | 3295.04 | 415 | 413 | 95.5 |
| C | 10 | 20 | 104075 | 1085.8 | 415 | 413 | 95.5 |
| D | 12 | 235 | 157081 | 1641.54 | 415 | 404 | 95.4 |
| D | 12 | 17 | 117783 | 1229.81 | 415 | 404 | 95.4 |
| D | 2 | 250 | 116088 | 1212.05 | 415 | 404 | 95.4 |
Histogram calculated using DETX and DETY for each event in the final _common_clean file
| Quadrant A |  |
 |
Quadrant B |
|---|---|---|---|
| Quadrant D |  |
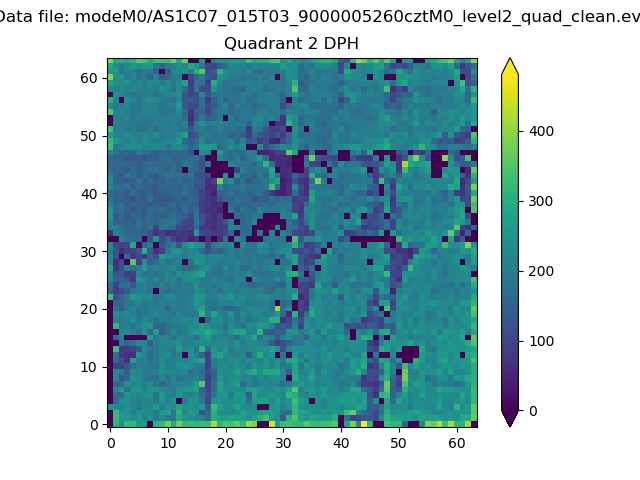 |
Quadrant C |
| Plot type | Count rate plots | Images |
|---|---|---|
| Comparison with Poisson distribution Blue bars denote a histogram of data divided into 1 sec bins. Red curve is a Poisson curve with rate = median count rate of data. |
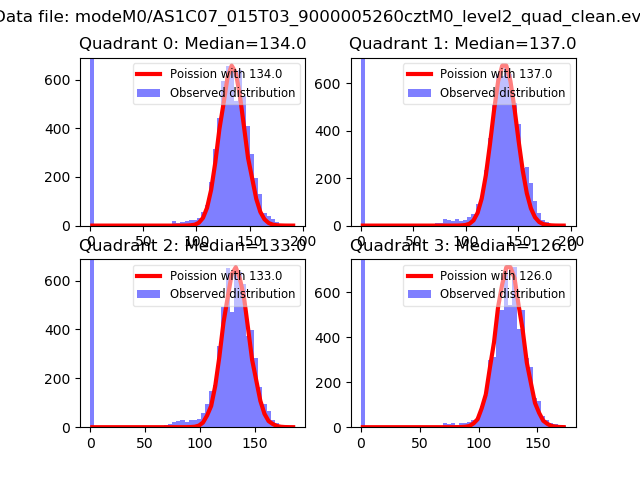 |
 |
| Quadrant-wise count rates Data is divided into 100 sec bins |
 |
|
| Module-wise count rates for Quadrant A Data is divided into 100 sec bins |
 |
 |
| Module-wise count rates for Quadrant B Data is divided into 100 sec bins |
 |
 |
| Module-wise count rates for Quadrant C Data is divided into 100 sec bins |
 |
 |
| Module-wise count rates for Quadrant D Data is divided into 100 sec bins |
 |
 |
| Parameter | Plot |
|---|---|
| CZT HV Monitor |  |
| D_VDD |  |
| Temperature 1 | 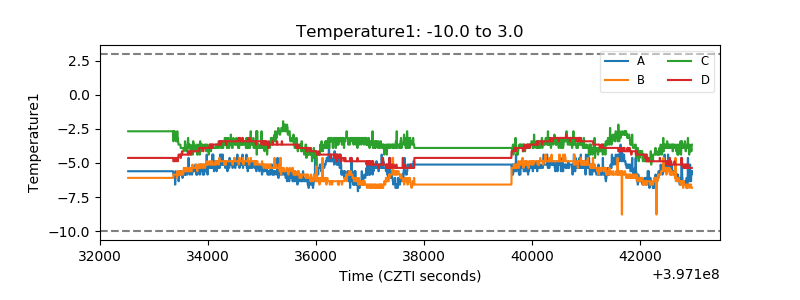 |
| Veto HV Monitor |  |
| Veto LLD |  |
| Alpha Counter | 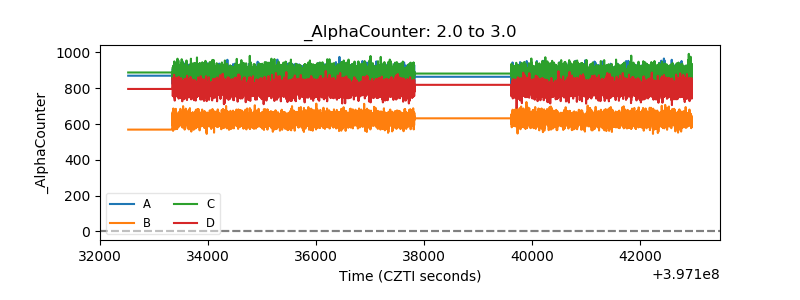 |
| _CPM_Rate |  |
| CZT Counter | 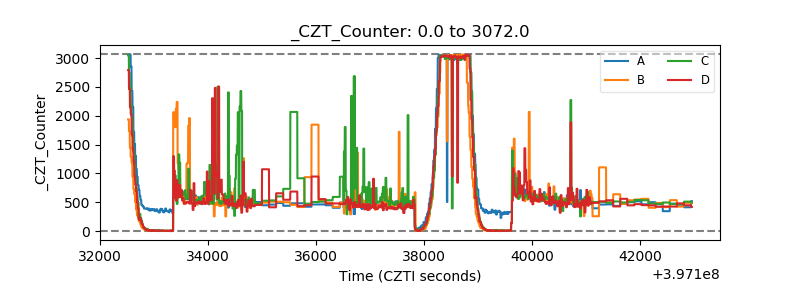 |
| +2.5 Volts monitor | 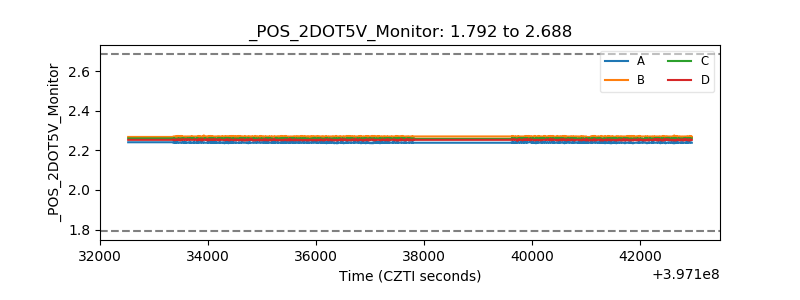 |
| +5 Volts monitor |  |
| _ROLL_ROT |  |
| _Roll_DEC |  |
| _Roll_RA |  |
| Veto Counter |  |