| Param | Original file | Final file |
|---|---|---|
| Filename | modeM0/AS1C07_015T02_9000005258cztM0_level2_bc.evt | modeM0/AS1C07_015T02_9000005258cztM0_level2_quad_clean.evt |
| Size (bytes) | 361,843,200 | 135,587,520 |
| Size | 345.1 MB | 129.3 MB |
| Events in quadrant A | 2,060,897 | 885,889 |
| Events in quadrant B | 2,133,516 | 890,675 |
| Events in quadrant C | 2,506,981 | 888,156 |
| Events in quadrant D | 3,643,342 | 823,653 |
| Mode M0 | |||
|---|---|---|---|
| Quadrant | BADHDUFLAG | Total packets | Discarded packets |
| A | 0 | 18306 | 0 |
| B | 0 | 19034 | 0 |
| C | 0 | 19340 | 0 |
| D | 0 | 24680 | 0 |
| Mode SS | |||
|---|---|---|---|
| Quadrant | BADHDUFLAG | Total packets | Discarded packets |
| A | 0 | 181 | 0 |
| B | 0 | 180 | 0 |
| C | 0 | 178 | 0 |
| D | 0 | 180 | 0 |
| Mode M9 | |||
|---|---|---|---|
| Quadrant | BADHDUFLAG | Total packets | Discarded packets |
| A | 0 | 17 | 0 |
| B | 0 | 17 | 0 |
| C | 0 | 17 | 0 |
| D | 0 | 17 | 0 |
| Quadrant | Total seconds | Saturated seconds | Saturation percentage |
|---|---|---|---|
| A | 8918 | 12 | 0.134559% |
| B | 8915 | 59 | 0.661806% |
| C | 8906 | 66 | 0.741073% |
| D | 8915 | 395 | 4.430735% |
Noise dominated data is calculated using 1-second bins in cleaned event files. If a bin has >2000 counts, and if more than 50% of those come from <1% of pixels, then it is considered to be noise-dominated and hence unusable.
| Quadrant | # 1 sec bins | Bins with >0 counts | Bins with >2000 counts | High rate bins dominated by noise | Noise dominated (total time) | Noise dominated (detector-on time) | Marked lightcurve |
|---|---|---|---|---|---|---|---|
| A | 10483 | 8951 | 0 | 0 | 0.00% | 0.00% |  |
| B | 10482 | 8939 | 4 | 4 | 0.04% | 0.04% | 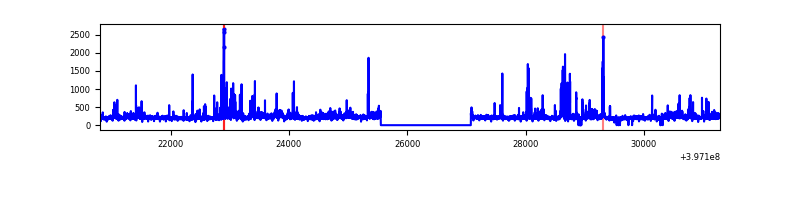 |
| C | 10482 | 8934 | 18 | 18 | 0.17% | 0.20% |  |
| D | 10482 | 8942 | 55 | 55 | 0.52% | 0.62% | 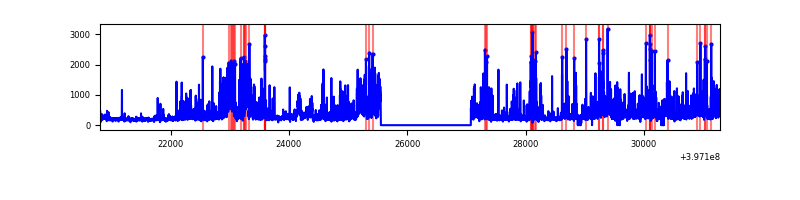 |
Top three noisy pixels from each quadrant. If the there are fewer than three noisy pixels in the level2.evt file, extra rows are filled as -1
| Pixel properties | Quadrant properties | ||||||
|---|---|---|---|---|---|---|---|
| Quadrant | DetID | PixID | Counts | Sigma | Mean | Median | Sigma |
| A | 10 | 83 | 307321 | 3038.91 | 438 | 430 | 101.0 |
| A | 12 | 189 | 28436 | 277.32 | 438 | 430 | 101.0 |
| A | 13 | 6 | 20879 | 202.49 | 438 | 430 | 101.0 |
| B | 5 | 172 | 116043 | 1277.74 | 438 | 428 | 90.5 |
| B | 0 | 213 | 65293 | 716.87 | 438 | 428 | 90.5 |
| B | 0 | 190 | 52132 | 571.42 | 438 | 428 | 90.5 |
| C | 15 | 214 | 355642 | 3455.77 | 428 | 425 | 102.8 |
| C | 1 | 23 | 162664 | 1578.36 | 428 | 425 | 102.8 |
| C | 10 | 20 | 141660 | 1374.02 | 428 | 425 | 102.8 |
| D | 2 | 250 | 696304 | 6747.61 | 421 | 407 | 103.1 |
| D | 1 | 52 | 383456 | 3714.15 | 421 | 407 | 103.1 |
| D | 2 | 153 | 294209 | 2848.79 | 421 | 407 | 103.1 |
Histogram calculated using DETX and DETY for each event in the final _common_clean file
| Quadrant A |  |
 |
Quadrant B |
|---|---|---|---|
| Quadrant D | 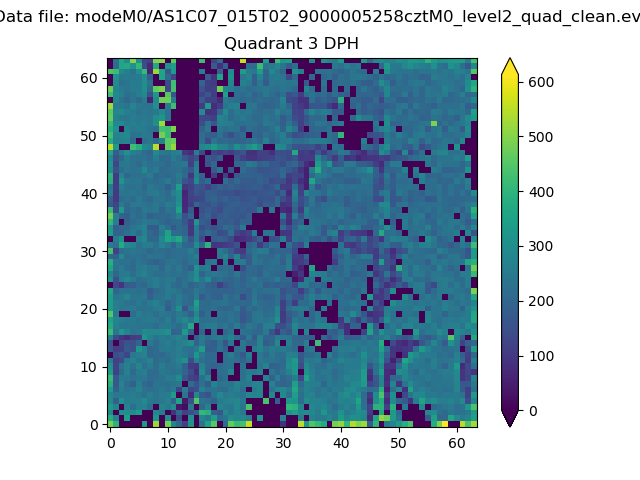 |
 |
Quadrant C |
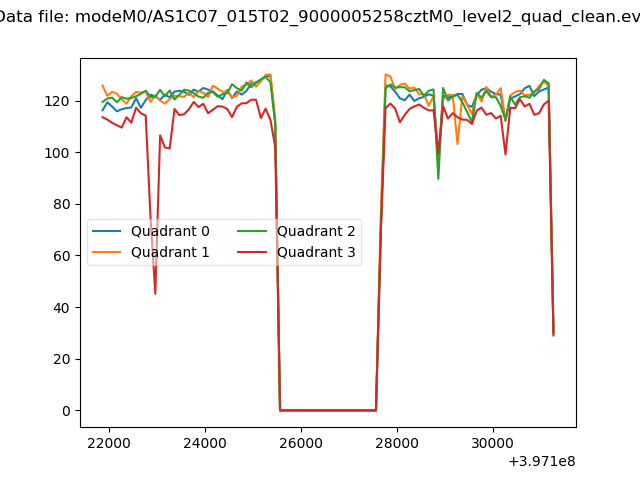
| Plot type | Count rate plots | Images |
|---|---|---|
| Comparison with Poisson distribution Blue bars denote a histogram of data divided into 1 sec bins. Red curve is a Poisson curve with rate = median count rate of data. |
 |
 |
| Quadrant-wise count rates Data is divided into 100 sec bins |
 |
|
| Module-wise count rates for Quadrant A Data is divided into 100 sec bins |
 |
 |
| Module-wise count rates for Quadrant B Data is divided into 100 sec bins |
 |
 |
| Module-wise count rates for Quadrant C Data is divided into 100 sec bins |
 |
 |
| Module-wise count rates for Quadrant D Data is divided into 100 sec bins |
 |
 |
| Parameter | Plot |
|---|---|
| CZT HV Monitor |  |
| D_VDD |  |
| Temperature 1 | 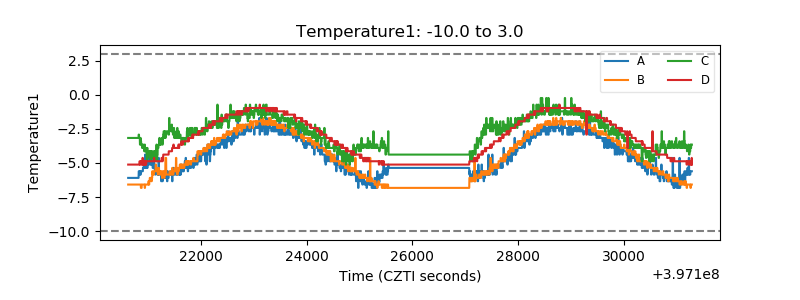 |
| Veto HV Monitor |  |
| Veto LLD |  |
| Alpha Counter | 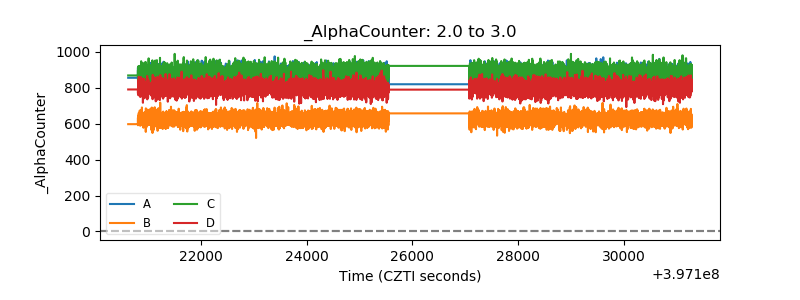 |
| _CPM_Rate |  |
| CZT Counter |  |
| +2.5 Volts monitor |  |
| +5 Volts monitor | 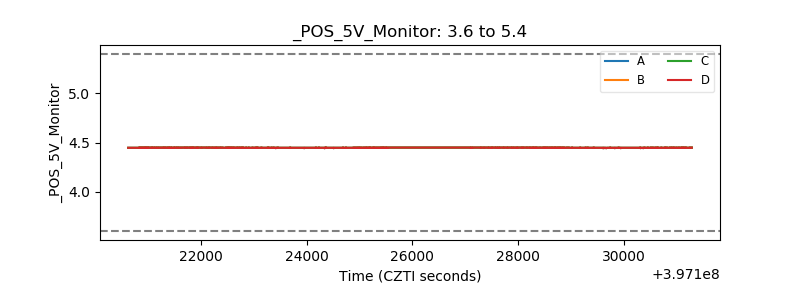 |
| _ROLL_ROT | 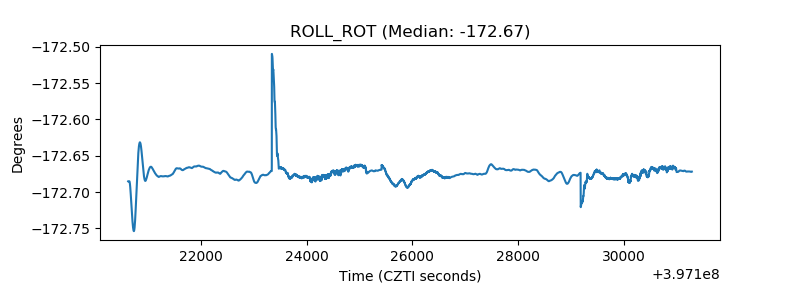 |
| _Roll_DEC | 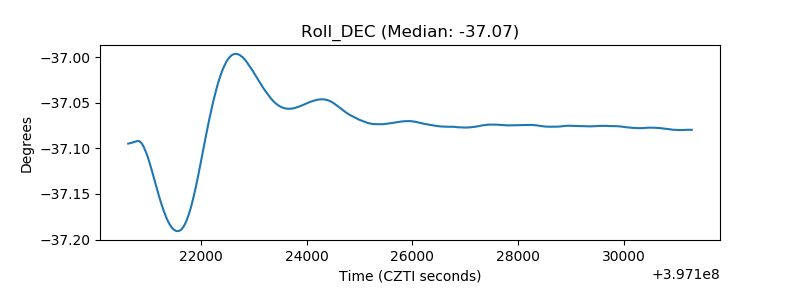 |
| _Roll_RA |  |
| Veto Counter |  |