| Param | Original file | Final file |
|---|---|---|
| Filename | modeM0/AS1C07_015T01_9000005256cztM0_level2_bc.evt | modeM0/AS1C07_015T01_9000005256cztM0_level2_quad_clean.evt |
| Size (bytes) | 705,608,640 | 233,879,040 |
| Size | 672.9 MB | 223.0 MB |
| Events in quadrant A | 3,567,916 | 1,549,280 |
| Events in quadrant B | 6,412,826 | 1,496,293 |
| Events in quadrant C | 3,825,356 | 1,536,218 |
| Events in quadrant D | 6,519,645 | 1,449,831 |
| Mode M9 | |||
|---|---|---|---|
| Quadrant | BADHDUFLAG | Total packets | Discarded packets |
| A | 0 | 39 | 0 |
| B | 0 | 39 | 0 |
| C | 0 | 39 | 0 |
| D | 0 | 39 | 0 |
| Mode SS | |||
|---|---|---|---|
| Quadrant | BADHDUFLAG | Total packets | Discarded packets |
| A | 0 | 312 | 0 |
| B | 0 | 312 | 0 |
| C | 0 | 312 | 0 |
| D | 0 | 312 | 0 |
| Mode M0 | |||
|---|---|---|---|
| Quadrant | BADHDUFLAG | Total packets | Discarded packets |
| A | 0 | 31422 | 0 |
| B | 0 | 42241 | 0 |
| C | 0 | 31923 | 0 |
| D | 0 | 43731 | 0 |
| Quadrant | Total seconds | Saturated seconds | Saturation percentage |
|---|---|---|---|
| A | 15236 | 19 | 0.124705% |
| B | 15236 | 1522 | 9.989499% |
| C | 15236 | 28 | 0.183775% |
| D | 15236 | 746 | 4.896298% |
Noise dominated data is calculated using 1-second bins in cleaned event files. If a bin has >2000 counts, and if more than 50% of those come from <1% of pixels, then it is considered to be noise-dominated and hence unusable.
| Quadrant | # 1 sec bins | Bins with >0 counts | Bins with >2000 counts | High rate bins dominated by noise | Noise dominated (total time) | Noise dominated (detector-on time) | Marked lightcurve |
|---|---|---|---|---|---|---|---|
| A | 19174 | 15239 | 4 | 4 | 0.02% | 0.03% | 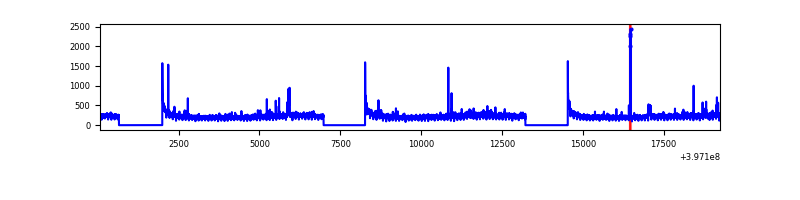 |
| B | 19174 | 15236 | 288 | 288 | 1.50% | 1.89% |  |
| C | 19174 | 15236 | 8 | 8 | 0.04% | 0.05% |  |
| D | 19174 | 15237 | 90 | 90 | 0.47% | 0.59% | 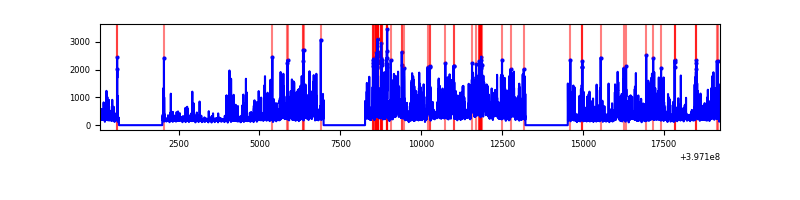 |
Top three noisy pixels from each quadrant. If the there are fewer than three noisy pixels in the level2.evt file, extra rows are filled as -1
| Pixel properties | Quadrant properties | ||||||
|---|---|---|---|---|---|---|---|
| Quadrant | DetID | PixID | Counts | Sigma | Mean | Median | Sigma |
| A | 10 | 83 | 512279 | 3041.81 | 740 | 726 | 168.2 |
| A | 15 | 174 | 74148 | 436.58 | 740 | 726 | 168.2 |
| A | 12 | 189 | 60853 | 357.53 | 740 | 726 | 168.2 |
| B | 5 | 184 | 2523205 | 16923.64 | 721 | 703 | 149.1 |
| B | 5 | 172 | 535130 | 3585.51 | 721 | 703 | 149.1 |
| B | 0 | 213 | 178087 | 1190.08 | 721 | 703 | 149.1 |
| C | 15 | 214 | 616588 | 3667.7 | 723 | 716 | 167.9 |
| C | 0 | 10 | 131921 | 781.36 | 723 | 716 | 167.9 |
| C | 14 | 254 | 61136 | 359.82 | 723 | 716 | 167.9 |
| D | 1 | 52 | 884045 | 5043.66 | 720 | 696 | 175.1 |
| D | 2 | 153 | 705016 | 4021.45 | 720 | 696 | 175.1 |
| D | 2 | 250 | 644507 | 3675.97 | 720 | 696 | 175.1 |
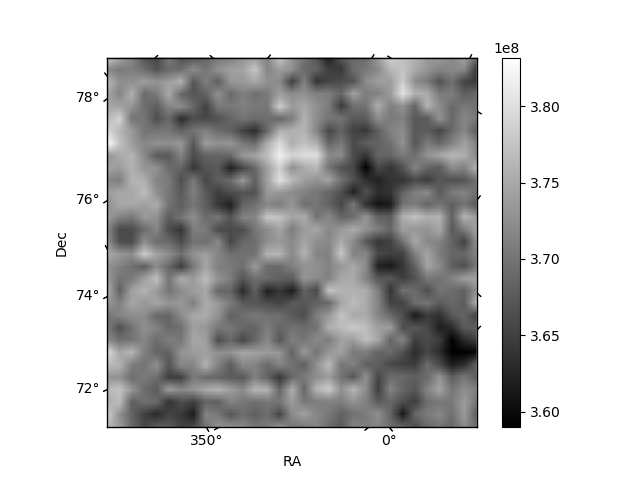
Histogram calculated using DETX and DETY for each event in the final _common_clean file
| Quadrant A |  |
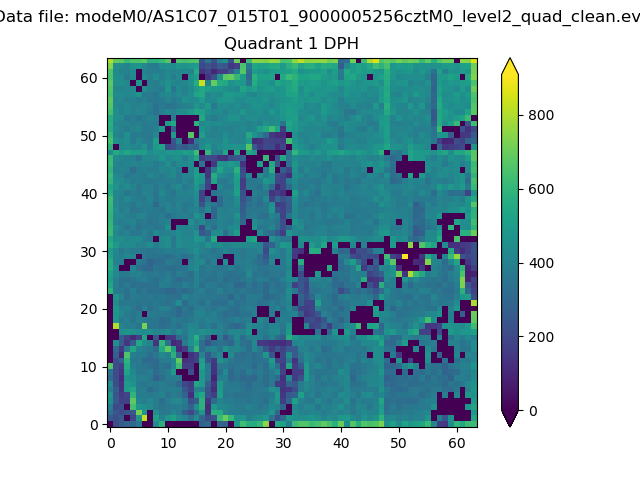 |
Quadrant B |
|---|---|---|---|
| Quadrant D |  |
 |
Quadrant C |
| Plot type | Count rate plots | Images |
|---|---|---|
| Comparison with Poisson distribution Blue bars denote a histogram of data divided into 1 sec bins. Red curve is a Poisson curve with rate = median count rate of data. |
 |
 |
| Quadrant-wise count rates Data is divided into 100 sec bins |
 |
|
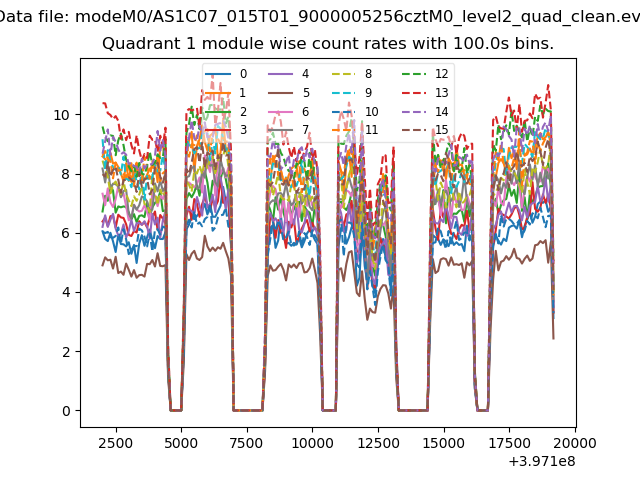
| Module-wise count rates for Quadrant A Data is divided into 100 sec bins |
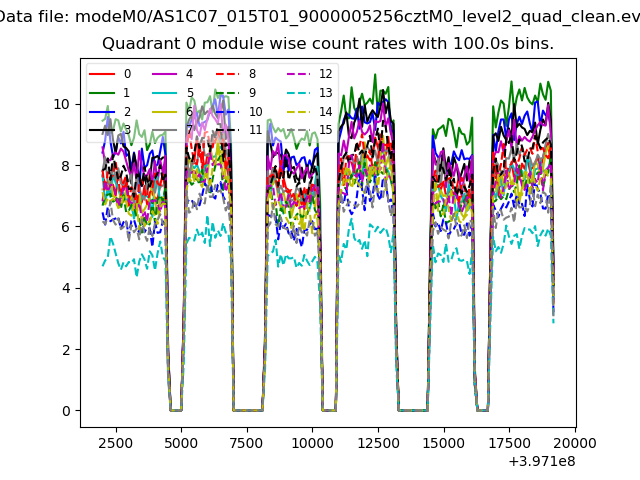 |
 |
| Module-wise count rates for Quadrant B Data is divided into 100 sec bins |
 |
 |
| Module-wise count rates for Quadrant C Data is divided into 100 sec bins |
 |
 |
| Module-wise count rates for Quadrant D Data is divided into 100 sec bins |
 |
 |
| Parameter | Plot |
|---|---|
| CZT HV Monitor |  |
| D_VDD |  |
| Temperature 1 |  |
| Veto HV Monitor | 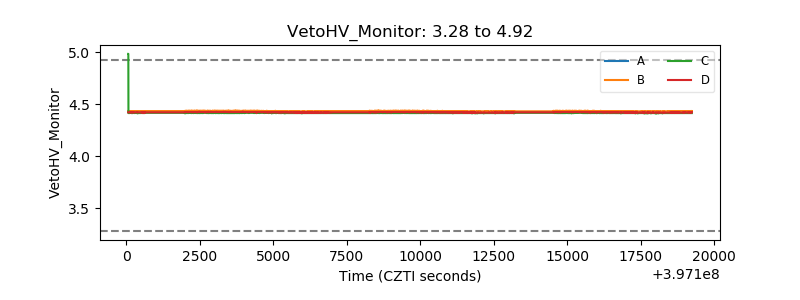 |
| Veto LLD |  |
| Alpha Counter | 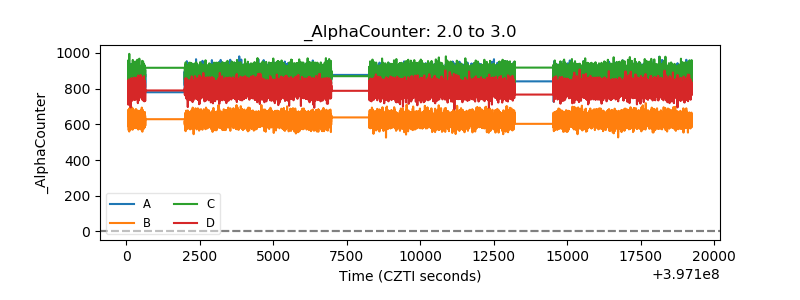 |
| _CPM_Rate |  |
| CZT Counter |  |
| +2.5 Volts monitor | 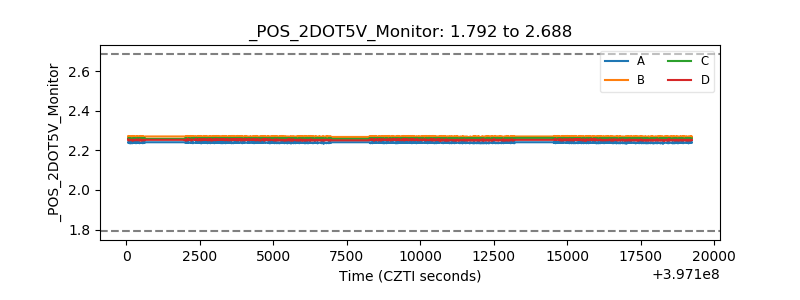 |
| +5 Volts monitor |  |
| _ROLL_ROT |  |
| _Roll_DEC | 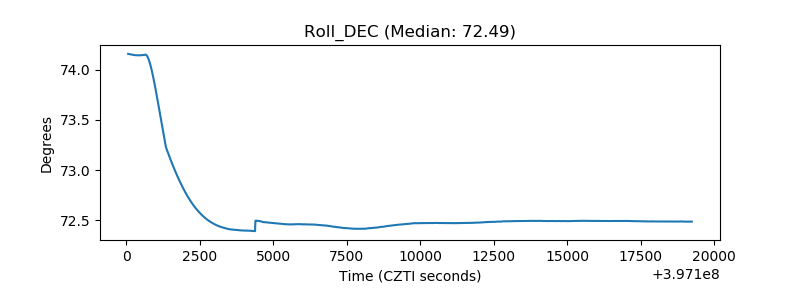 |
| _Roll_RA |  |
| Veto Counter |  |