| Param | Original file | Final file |
|---|---|---|
| Filename | modeM0/AS1A11_079T01_9000005254cztM0_level2_bc.evt | modeM0/AS1A11_079T01_9000005254cztM0_level2_quad_clean.evt |
| Size (bytes) | 6,946,545,600 | 1,680,384,960 |
| Size | 6.5 GB | 1.6 GB |
| Events in quadrant A | 31,530,154 | 10,854,039 |
| Events in quadrant B | 78,837,240 | 10,110,098 |
| Events in quadrant C | 38,093,040 | 10,887,886 |
| Events in quadrant D | 53,059,727 | 10,104,195 |
| Mode SS | |||
|---|---|---|---|
| Quadrant | BADHDUFLAG | Total packets | Discarded packets |
| A | 0 | 2666 | 0 |
| B | 0 | 2666 | 0 |
| C | 0 | 2664 | 0 |
| D | 0 | 2662 | 0 |
| Mode M9 | |||
|---|---|---|---|
| Quadrant | BADHDUFLAG | Total packets | Discarded packets |
| A | 0 | 495 | 0 |
| B | 0 | 495 | 0 |
| C | 0 | 495 | 0 |
| D | 0 | 495 | 0 |
| Mode M0 | |||
|---|---|---|---|
| Quadrant | BADHDUFLAG | Total packets | Discarded packets |
| A | 0 | 273231 | 0 |
| B | 0 | 458060 | 0 |
| C | 0 | 290305 | 0 |
| D | 0 | 355671 | 0 |
| Quadrant | Total seconds | Saturated seconds | Saturation percentage |
|---|---|---|---|
| A | 130408 | 259 | 0.198607% |
| B | 130403 | 17728 | 13.594779% |
| C | 130449 | 927 | 0.710623% |
| D | 130405 | 7389 | 5.666194% |
Noise dominated data is calculated using 1-second bins in cleaned event files. If a bin has >2000 counts, and if more than 50% of those come from <1% of pixels, then it is considered to be noise-dominated and hence unusable.
| Quadrant | # 1 sec bins | Bins with >0 counts | Bins with >2000 counts | High rate bins dominated by noise | Noise dominated (total time) | Noise dominated (detector-on time) | Marked lightcurve |
|---|---|---|---|---|---|---|---|
| A | 179056 | 130561 | 17 | 17 | 0.01% | 0.01% |  |
| B | 179055 | 130536 | 3633 | 3633 | 2.03% | 2.78% |  |
| C | 179055 | 130577 | 280 | 280 | 0.16% | 0.21% |  |
| D | 179055 | 130535 | 2930 | 2930 | 1.64% | 2.24% |  |
Top three noisy pixels from each quadrant. If the there are fewer than three noisy pixels in the level2.evt file, extra rows are filled as -1
| Pixel properties | Quadrant properties | ||||||
|---|---|---|---|---|---|---|---|
| Quadrant | DetID | PixID | Counts | Sigma | Mean | Median | Sigma |
| A | 10 | 83 | 4084511 | 2770.15 | 6699 | 6596 | 1472.1 |
| A | 15 | 222 | 806442 | 543.34 | 6699 | 6596 | 1472.1 |
| A | 9 | 143 | 380566 | 254.04 | 6699 | 6596 | 1472.1 |
| B | 5 | 184 | 46821990 | 37085.3 | 6405 | 6271 | 1262.4 |
| B | 4 | 81 | 1936548 | 1529.08 | 6405 | 6271 | 1262.4 |
| B | 0 | 221 | 1178357 | 928.47 | 6405 | 6271 | 1262.4 |
| C | 15 | 214 | 5241914 | 3433.3 | 6637 | 6594 | 1524.9 |
| C | 0 | 10 | 2048512 | 1339.08 | 6637 | 6594 | 1524.9 |
| C | 0 | 207 | 1231793 | 803.48 | 6637 | 6594 | 1524.9 |
| D | 12 | 17 | 13414899 | 8688.56 | 6492 | 6299 | 1543.2 |
| D | 2 | 250 | 2977101 | 1925.03 | 6492 | 6299 | 1543.2 |
| D | 1 | 52 | 2784990 | 1800.55 | 6492 | 6299 | 1543.2 |
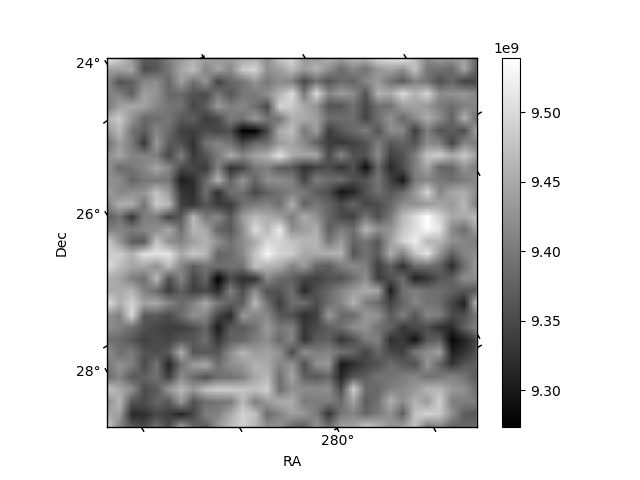
Histogram calculated using DETX and DETY for each event in the final _common_clean file
| Quadrant A |  |
 |
Quadrant B |
|---|---|---|---|
| Quadrant D |  |
 |
Quadrant C |
| Plot type | Count rate plots | Images |
|---|---|---|
| Comparison with Poisson distribution Blue bars denote a histogram of data divided into 1 sec bins. Red curve is a Poisson curve with rate = median count rate of data. |
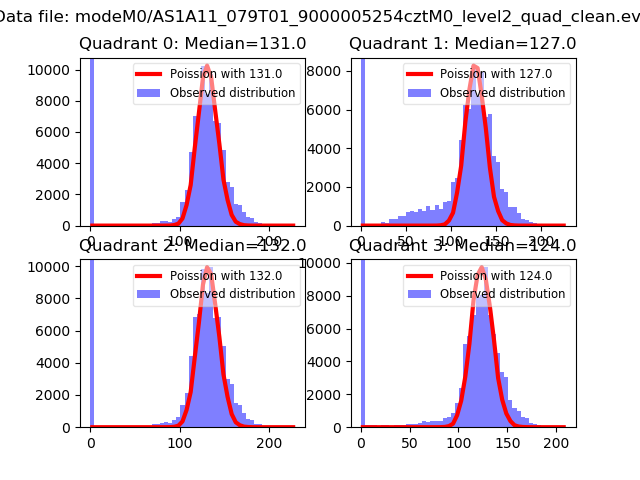 |
 |
| Quadrant-wise count rates Data is divided into 100 sec bins |
 |
|
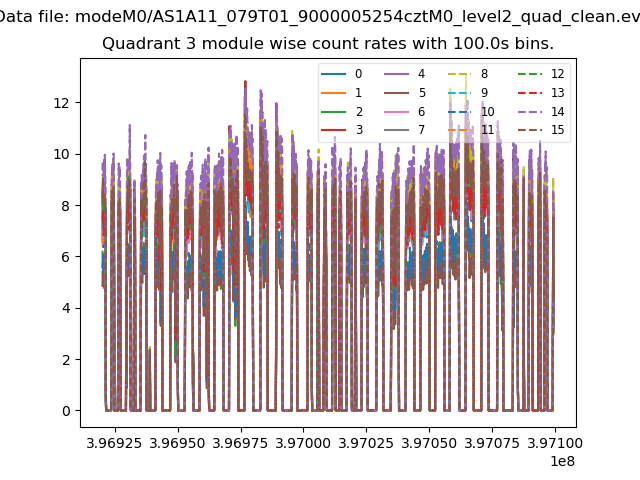
| Module-wise count rates for Quadrant A Data is divided into 100 sec bins |
 |
 |
| Module-wise count rates for Quadrant B Data is divided into 100 sec bins |
 |
 |
| Module-wise count rates for Quadrant C Data is divided into 100 sec bins |
 |
 |
| Module-wise count rates for Quadrant D Data is divided into 100 sec bins |
 |
 |
| Parameter | Plot |
|---|---|
| CZT HV Monitor |  |
| D_VDD |  |
| Temperature 1 |  |
| Veto HV Monitor |  |
| Veto LLD | 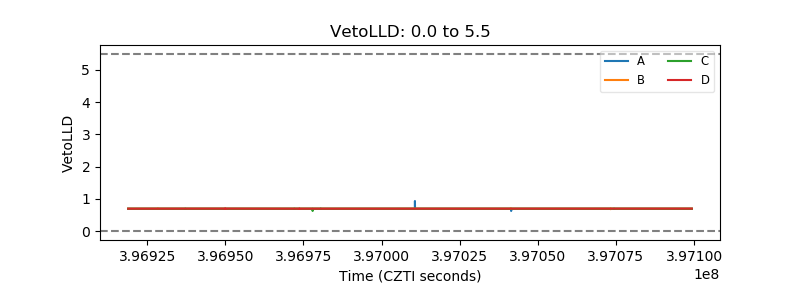 |
| Alpha Counter | 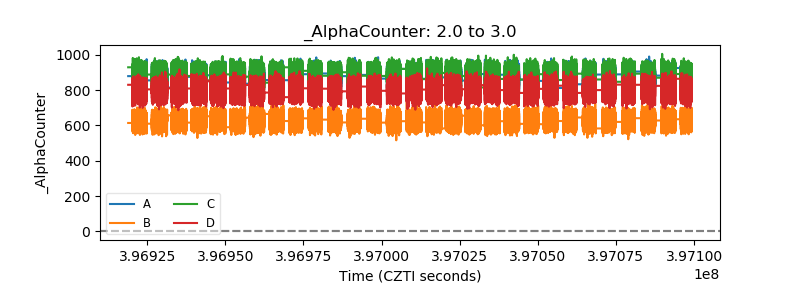 |
| _CPM_Rate |  |
| CZT Counter |  |
| +2.5 Volts monitor |  |
| +5 Volts monitor |  |
| _ROLL_ROT |  |
| _Roll_DEC |  |
| _Roll_RA |  |
| Veto Counter | 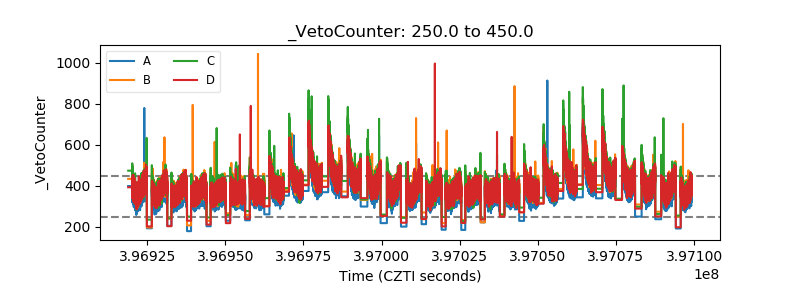 |