| Param | Original file | Final file |
|---|---|---|
| Filename | modeM0/AS1C07_001T10_9000005252cztM0_level2_bc.evt | modeM0/AS1C07_001T10_9000005252cztM0_level2_quad_clean.evt |
| Size (bytes) | 4,202,233,920 | 1,389,470,400 |
| Size | 3.9 GB | 1.3 GB |
| Events in quadrant A | 22,597,941 | 9,345,351 |
| Events in quadrant B | 36,817,049 | 8,882,292 |
| Events in quadrant C | 25,158,814 | 9,352,632 |
| Events in quadrant D | 37,037,706 | 8,803,227 |
| Mode M0 | |||
|---|---|---|---|
| Quadrant | BADHDUFLAG | Total packets | Discarded packets |
| A | 0 | 182386 | 0 |
| B | 0 | 248213 | 0 |
| C | 0 | 187100 | 0 |
| D | 0 | 239583 | 0 |
| Mode SS | |||
|---|---|---|---|
| Quadrant | BADHDUFLAG | Total packets | Discarded packets |
| A | 0 | 1704 | 0 |
| B | 0 | 1704 | 0 |
| C | 0 | 1704 | 0 |
| D | 0 | 1704 | 0 |
| Mode M9 | |||
|---|---|---|---|
| Quadrant | BADHDUFLAG | Total packets | Discarded packets |
| A | 0 | 322 | 0 |
| B | 0 | 322 | 0 |
| C | 0 | 322 | 0 |
| D | 0 | 322 | 0 |
| Quadrant | Total seconds | Saturated seconds | Saturation percentage |
|---|---|---|---|
| A | 83162 | 717 | 0.862173% |
| B | 83161 | 7393 | 8.889984% |
| C | 83162 | 971 | 1.167601% |
| D | 83162 | 5839 | 7.021236% |
Noise dominated data is calculated using 1-second bins in cleaned event files. If a bin has >2000 counts, and if more than 50% of those come from <1% of pixels, then it is considered to be noise-dominated and hence unusable.
| Quadrant | # 1 sec bins | Bins with >0 counts | Bins with >2000 counts | High rate bins dominated by noise | Noise dominated (total time) | Noise dominated (detector-on time) | Marked lightcurve |
|---|---|---|---|---|---|---|---|
| A | 115646 | 83179 | 143 | 143 | 0.12% | 0.17% |  |
| B | 115646 | 83155 | 546 | 546 | 0.47% | 0.66% |  |
| C | 115646 | 83164 | 237 | 237 | 0.20% | 0.28% |  |
| D | 115646 | 83157 | 1610 | 1610 | 1.39% | 1.94% |  |
Top three noisy pixels from each quadrant. If the there are fewer than three noisy pixels in the level2.evt file, extra rows are filled as -1
| Pixel properties | Quadrant properties | ||||||
|---|---|---|---|---|---|---|---|
| Quadrant | DetID | PixID | Counts | Sigma | Mean | Median | Sigma |
| A | 10 | 83 | 2998301 | 3199.67 | 4227 | 4168 | 935.8 |
| A | 15 | 237 | 1057556 | 1125.7 | 4227 | 4168 | 935.8 |
| A | 12 | 189 | 619350 | 657.41 | 4227 | 4168 | 935.8 |
| B | 5 | 184 | 12314505 | 15283.89 | 4075 | 3994 | 805.5 |
| B | 4 | 171 | 1740669 | 2156.14 | 4075 | 3994 | 805.5 |
| B | 5 | 172 | 1414344 | 1750.99 | 4075 | 3994 | 805.5 |
| C | 15 | 214 | 3388323 | 3486.04 | 4187 | 4166 | 970.8 |
| C | 0 | 10 | 1544185 | 1586.38 | 4187 | 4166 | 970.8 |
| C | 14 | 254 | 1286153 | 1320.58 | 4187 | 4166 | 970.8 |
| D | 12 | 17 | 11451496 | 11389.76 | 4118 | 4005 | 1005.1 |
| D | 2 | 250 | 2667599 | 2650.16 | 4118 | 4005 | 1005.1 |
| D | 2 | 249 | 892639 | 884.15 | 4118 | 4005 | 1005.1 |
Histogram calculated using DETX and DETY for each event in the final _common_clean file
| Quadrant A | 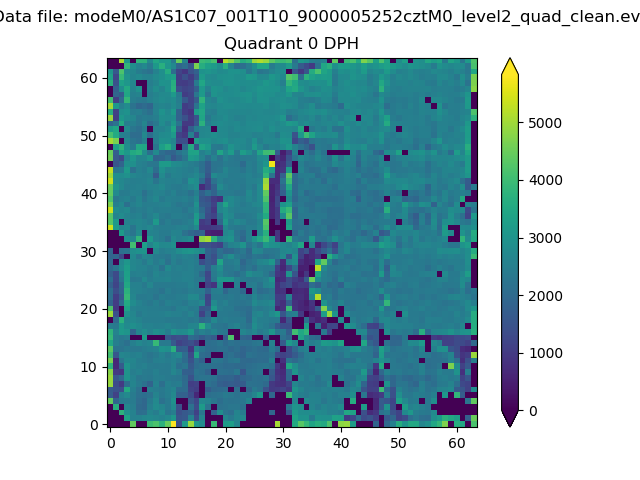 |
 |
Quadrant B |
|---|---|---|---|
| Quadrant D |  |
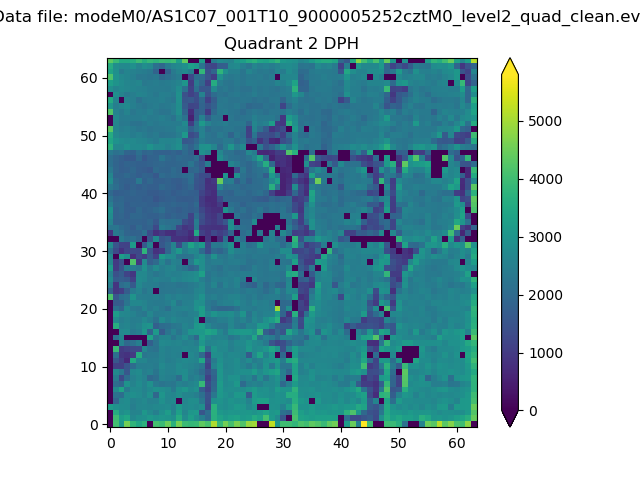 |
Quadrant C |
| Plot type | Count rate plots | Images |
|---|---|---|
| Comparison with Poisson distribution Blue bars denote a histogram of data divided into 1 sec bins. Red curve is a Poisson curve with rate = median count rate of data. |
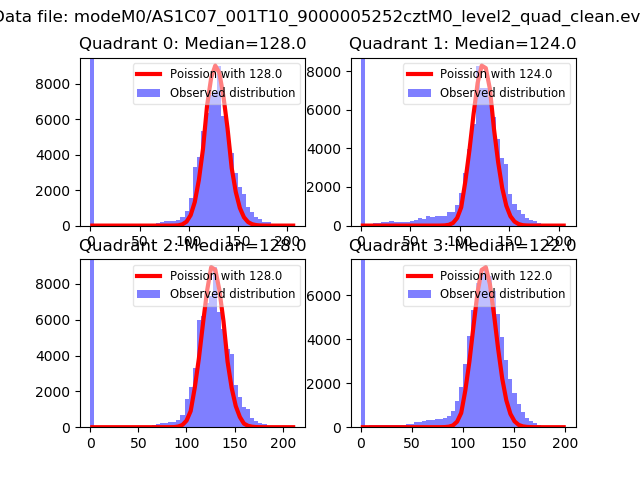 |
 |
| Quadrant-wise count rates Data is divided into 100 sec bins |
 |
|
| Module-wise count rates for Quadrant A Data is divided into 100 sec bins |
 |
 |
| Module-wise count rates for Quadrant B Data is divided into 100 sec bins |
 |
 |
| Module-wise count rates for Quadrant C Data is divided into 100 sec bins |
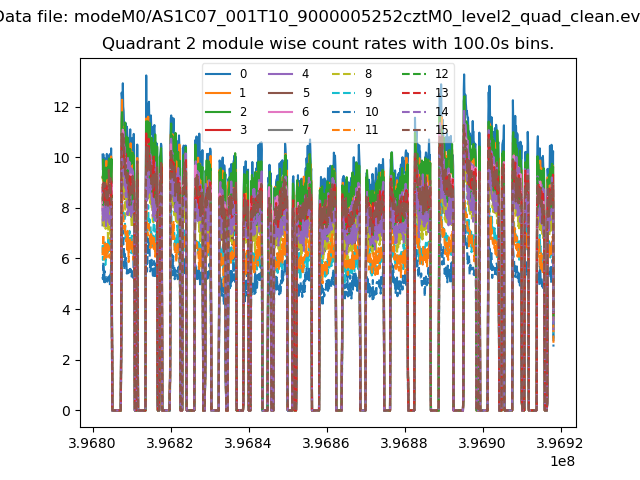 |
 |
| Module-wise count rates for Quadrant D Data is divided into 100 sec bins |
 |
 |
| Parameter | Plot |
|---|---|
| CZT HV Monitor |  |
| D_VDD |  |
| Temperature 1 |  |
| Veto HV Monitor |  |
| Veto LLD | 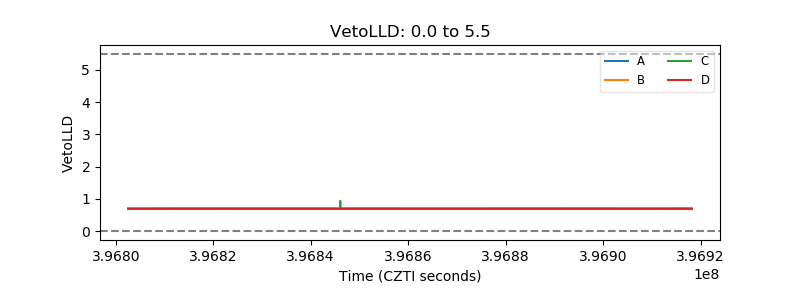 |
| Alpha Counter | 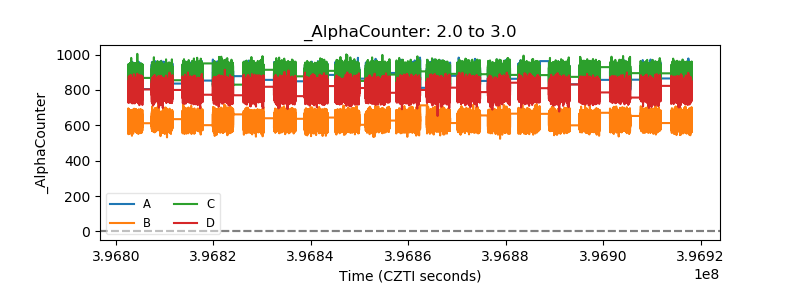 |
| _CPM_Rate |  |
| CZT Counter |  |
| +2.5 Volts monitor | 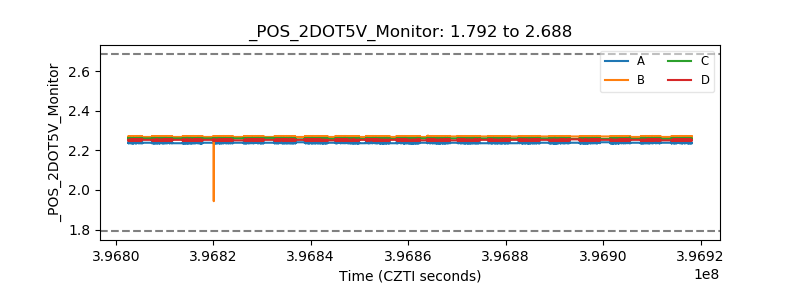 |
| +5 Volts monitor |  |
| _ROLL_ROT |  |
| _Roll_DEC | 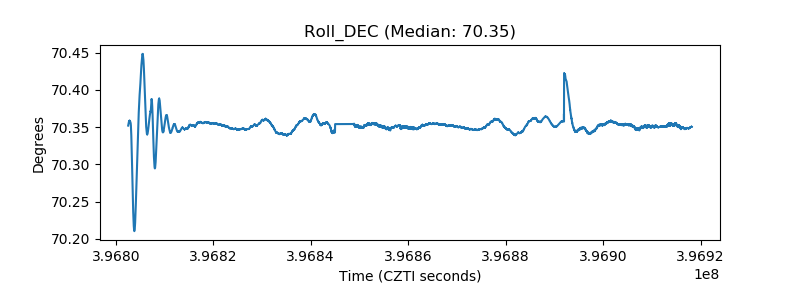 |
| _Roll_RA |  |
| Veto Counter | 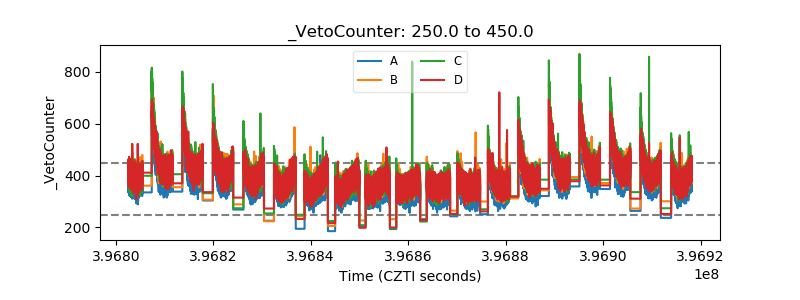 |