| Param | Original file | Final file |
|---|---|---|
| Filename | modeM0/AS1A11_024T01_9000005250cztM0_level2_bc.evt | modeM0/AS1A11_024T01_9000005250cztM0_level2_quad_clean.evt |
| Size (bytes) | 2,958,877,440 | 838,114,560 |
| Size | 2.8 GB | 799.3 MB |
| Events in quadrant A | 15,570,265 | 5,365,713 |
| Events in quadrant B | 21,643,590 | 5,312,419 |
| Events in quadrant C | 20,729,826 | 5,295,389 |
| Events in quadrant D | 27,269,733 | 4,979,338 |
| Mode M9 | |||
|---|---|---|---|
| Quadrant | BADHDUFLAG | Total packets | Discarded packets |
| A | 0 | 256 | 0 |
| B | 0 | 256 | 0 |
| C | 0 | 256 | 0 |
| D | 0 | 256 | 0 |
| Mode SS | |||
|---|---|---|---|
| Quadrant | BADHDUFLAG | Total packets | Discarded packets |
| A | 0 | 1326 | 0 |
| B | 0 | 1326 | 0 |
| C | 0 | 1326 | 0 |
| D | 0 | 1326 | 0 |
| Mode M0 | |||
|---|---|---|---|
| Quadrant | BADHDUFLAG | Total packets | Discarded packets |
| A | 0 | 135174 | 0 |
| B | 0 | 163716 | 0 |
| C | 0 | 153255 | 0 |
| D | 0 | 178956 | 0 |
| Quadrant | Total seconds | Saturated seconds | Saturation percentage |
|---|---|---|---|
| A | 64618 | 140 | 0.216658% |
| B | 64618 | 2286 | 3.537714% |
| C | 64618 | 1530 | 2.367761% |
| D | 64618 | 3460 | 5.354545% |
Noise dominated data is calculated using 1-second bins in cleaned event files. If a bin has >2000 counts, and if more than 50% of those come from <1% of pixels, then it is considered to be noise-dominated and hence unusable.
| Quadrant | # 1 sec bins | Bins with >0 counts | Bins with >2000 counts | High rate bins dominated by noise | Noise dominated (total time) | Noise dominated (detector-on time) | Marked lightcurve |
|---|---|---|---|---|---|---|---|
| A | 90402 | 64633 | 14 | 14 | 0.02% | 0.02% |  |
| B | 90402 | 64613 | 153 | 153 | 0.17% | 0.24% |  |
| C | 90402 | 64620 | 168 | 168 | 0.19% | 0.26% |  |
| D | 90402 | 64614 | 1249 | 1249 | 1.38% | 1.93% |  |
Top three noisy pixels from each quadrant. If the there are fewer than three noisy pixels in the level2.evt file, extra rows are filled as -1
| Pixel properties | Quadrant properties | ||||||
|---|---|---|---|---|---|---|---|
| Quadrant | DetID | PixID | Counts | Sigma | Mean | Median | Sigma |
| A | 10 | 83 | 2245827 | 3074.99 | 3308 | 3258 | 729.3 |
| A | 13 | 6 | 115980 | 154.56 | 3308 | 3258 | 729.3 |
| A | 13 | 254 | 103915 | 138.02 | 3308 | 3258 | 729.3 |
| B | 5 | 184 | 2412526 | 3677.13 | 3278 | 3204 | 655.2 |
| B | 0 | 229 | 1459656 | 2222.85 | 3278 | 3204 | 655.2 |
| B | 5 | 172 | 1397915 | 2128.62 | 3278 | 3204 | 655.2 |
| C | 14 | 254 | 3881993 | 5243.11 | 3205 | 3184 | 739.8 |
| C | 15 | 214 | 2600542 | 3510.93 | 3205 | 3184 | 739.8 |
| C | 0 | 10 | 1395434 | 1881.95 | 3205 | 3184 | 739.8 |
| D | 12 | 17 | 5861901 | 7780.87 | 3171 | 3079 | 753.0 |
| D | 2 | 250 | 1491447 | 1976.64 | 3171 | 3079 | 753.0 |
| D | 2 | 153 | 1231302 | 1631.15 | 3171 | 3079 | 753.0 |
Histogram calculated using DETX and DETY for each event in the final _common_clean file
| Quadrant A |  |
 |
Quadrant B |
|---|---|---|---|
| Quadrant D |  |
 |
Quadrant C |
| Plot type | Count rate plots | Images |
|---|---|---|
| Comparison with Poisson distribution Blue bars denote a histogram of data divided into 1 sec bins. Red curve is a Poisson curve with rate = median count rate of data. |
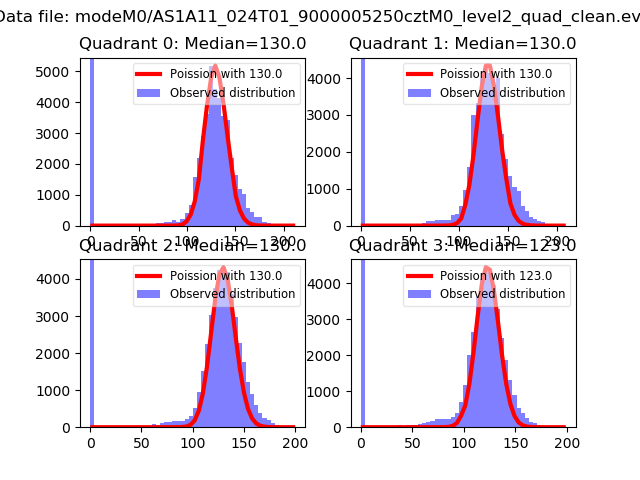 |
 |
| Quadrant-wise count rates Data is divided into 100 sec bins |
 |
|
| Module-wise count rates for Quadrant A Data is divided into 100 sec bins |
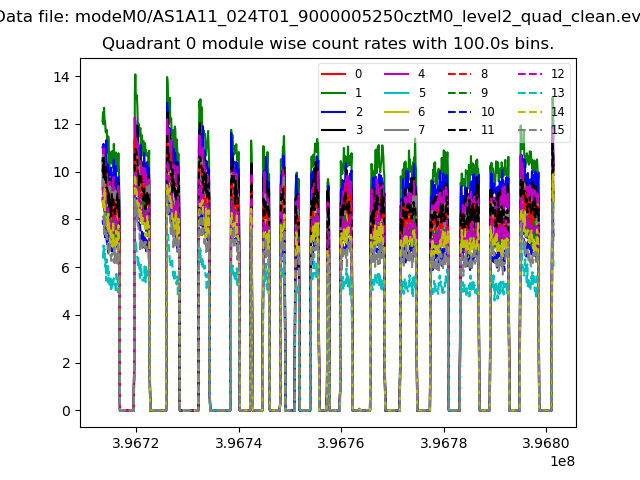 |
 |
| Module-wise count rates for Quadrant B Data is divided into 100 sec bins |
 |
 |
| Module-wise count rates for Quadrant C Data is divided into 100 sec bins |
 |
 |
| Module-wise count rates for Quadrant D Data is divided into 100 sec bins |
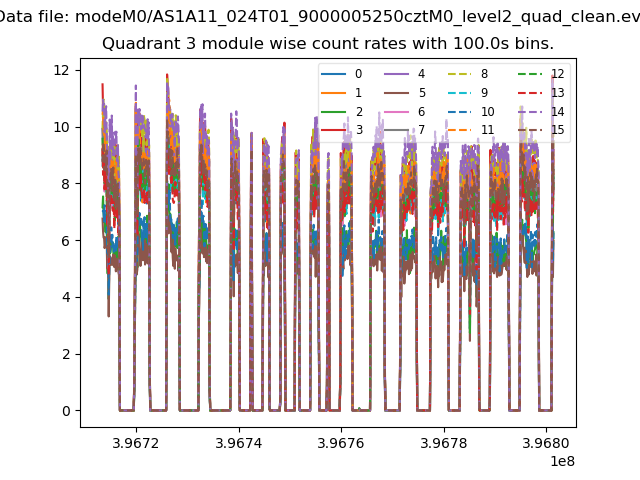 |
 |
| Parameter | Plot |
|---|---|
| CZT HV Monitor | 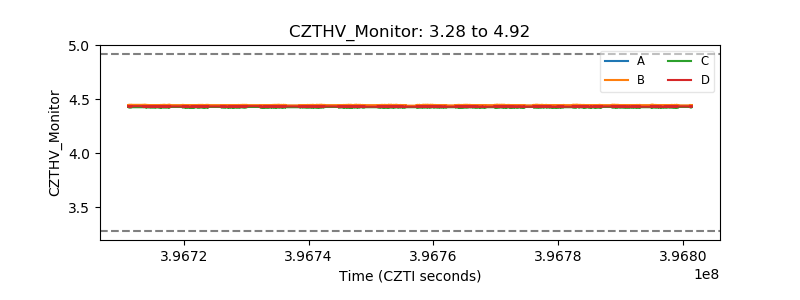 |
| D_VDD |  |
| Temperature 1 |  |
| Veto HV Monitor | 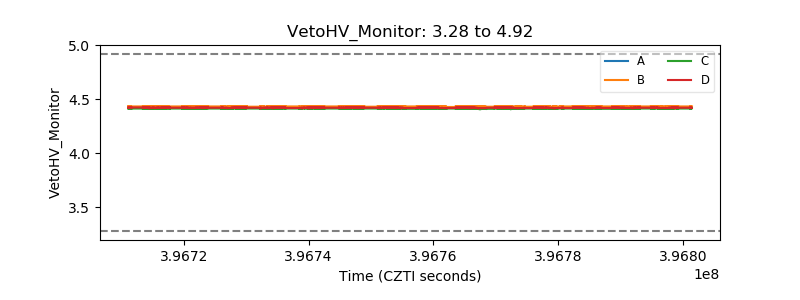 |
| Veto LLD |  |
| Alpha Counter | 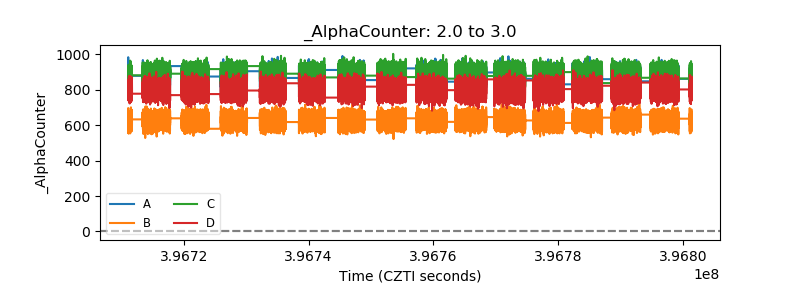 |
| _CPM_Rate |  |
| CZT Counter | 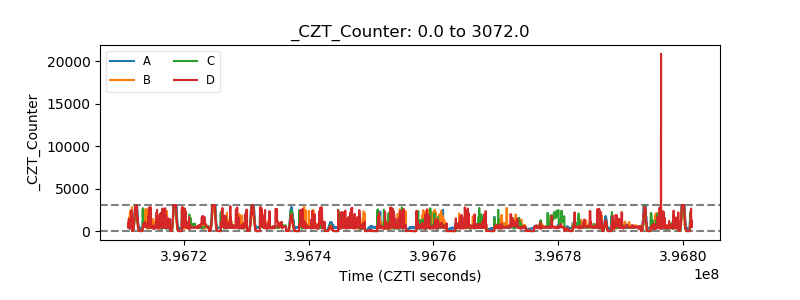 |
| +2.5 Volts monitor |  |
| +5 Volts monitor | 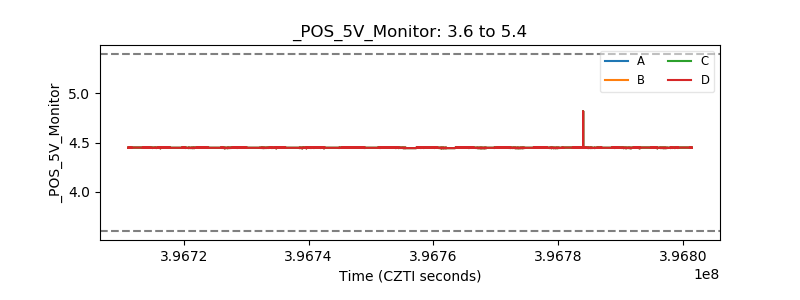 |
| _ROLL_ROT |  |
| _Roll_DEC |  |
| _Roll_RA |  |
| Veto Counter |  |