| Param | Original file | Final file |
|---|---|---|
| Filename | modeM0/AS1A11_087T05_9000005248cztM0_level2_bc.evt | modeM0/AS1A11_087T05_9000005248cztM0_level2_quad_clean.evt |
| Size (bytes) | 1,716,511,680 | 497,465,280 |
| Size | 1.6 GB | 474.4 MB |
| Events in quadrant A | 9,916,151 | 3,041,301 |
| Events in quadrant B | 11,282,181 | 3,092,652 |
| Events in quadrant C | 11,663,440 | 3,054,075 |
| Events in quadrant D | 16,139,568 | 2,874,985 |
| Mode M0 | |||
|---|---|---|---|
| Quadrant | BADHDUFLAG | Total packets | Discarded packets |
| A | 0 | 90041 | 0 |
| B | 0 | 97003 | 0 |
| C | 0 | 93448 | 0 |
| D | 0 | 116410 | 0 |
| Mode SS | |||
|---|---|---|---|
| Quadrant | BADHDUFLAG | Total packets | Discarded packets |
| A | 0 | 894 | 0 |
| B | 0 | 894 | 0 |
| C | 0 | 894 | 0 |
| D | 0 | 894 | 0 |
| Mode M9 | |||
|---|---|---|---|
| Quadrant | BADHDUFLAG | Total packets | Discarded packets |
| A | 0 | 145 | 0 |
| B | 0 | 145 | 0 |
| C | 0 | 145 | 0 |
| D | 0 | 145 | 0 |
| Quadrant | Total seconds | Saturated seconds | Saturation percentage |
|---|---|---|---|
| A | 43760 | 94 | 0.214808% |
| B | 43760 | 438 | 1.000914% |
| C | 43760 | 320 | 0.731261% |
| D | 43760 | 2498 | 5.708410% |
Noise dominated data is calculated using 1-second bins in cleaned event files. If a bin has >2000 counts, and if more than 50% of those come from <1% of pixels, then it is considered to be noise-dominated and hence unusable.
| Quadrant | # 1 sec bins | Bins with >0 counts | Bins with >2000 counts | High rate bins dominated by noise | Noise dominated (total time) | Noise dominated (detector-on time) | Marked lightcurve |
|---|---|---|---|---|---|---|---|
| A | 58307 | 43769 | 11 | 11 | 0.02% | 0.03% |  |
| B | 58307 | 43762 | 26 | 26 | 0.04% | 0.06% |  |
| C | 58307 | 43760 | 80 | 80 | 0.14% | 0.18% |  |
| D | 58307 | 43758 | 522 | 522 | 0.90% | 1.19% |  |
Top three noisy pixels from each quadrant. If the there are fewer than three noisy pixels in the level2.evt file, extra rows are filled as -1
| Pixel properties | Quadrant properties | ||||||
|---|---|---|---|---|---|---|---|
| Quadrant | DetID | PixID | Counts | Sigma | Mean | Median | Sigma |
| A | 10 | 83 | 1390679 | 2910.46 | 2140 | 2098 | 477.1 |
| A | 15 | 174 | 141998 | 293.23 | 2140 | 2098 | 477.1 |
| A | 13 | 254 | 56973 | 115.02 | 2140 | 2098 | 477.1 |
| B | 0 | 182 | 710449 | 1639.3 | 2163 | 2112 | 432.1 |
| B | 5 | 172 | 591487 | 1363.99 | 2163 | 2112 | 432.1 |
| B | 0 | 229 | 571020 | 1316.62 | 2163 | 2112 | 432.1 |
| C | 15 | 214 | 1761367 | 3626.95 | 2114 | 2096 | 485.1 |
| C | 0 | 10 | 1173142 | 2414.25 | 2114 | 2096 | 485.1 |
| C | 15 | 159 | 188167 | 383.61 | 2114 | 2096 | 485.1 |
| D | 12 | 17 | 2287561 | 4577.68 | 2082 | 2017 | 499.3 |
| D | 12 | 233 | 1958777 | 3919.17 | 2082 | 2017 | 499.3 |
| D | 10 | 253 | 1517171 | 3034.68 | 2082 | 2017 | 499.3 |
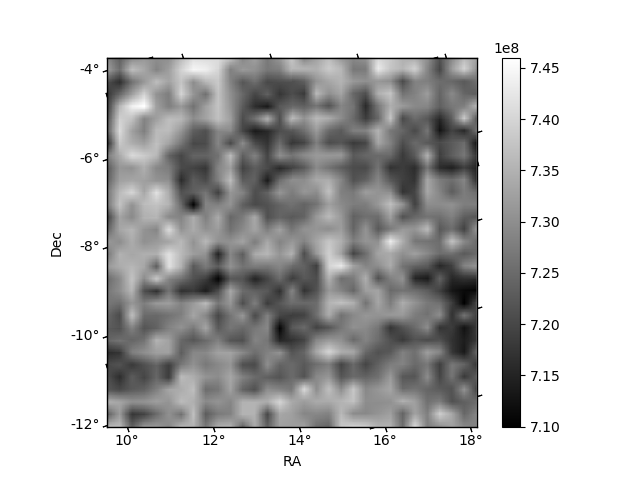
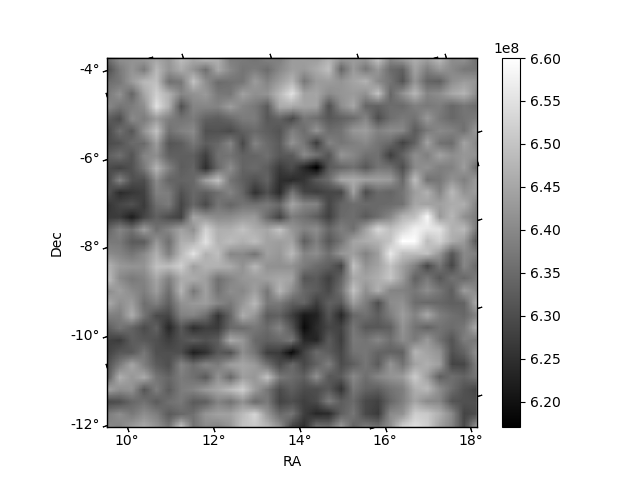
Histogram calculated using DETX and DETY for each event in the final _common_clean file
| Quadrant A |  |
 |
Quadrant B |
|---|---|---|---|
| Quadrant D |  |
 |
Quadrant C |
| Plot type | Count rate plots | Images |
|---|---|---|
| Comparison with Poisson distribution Blue bars denote a histogram of data divided into 1 sec bins. Red curve is a Poisson curve with rate = median count rate of data. |
 |
 |
| Quadrant-wise count rates Data is divided into 100 sec bins |
 |
|
| Module-wise count rates for Quadrant A Data is divided into 100 sec bins |
 |
 |
| Module-wise count rates for Quadrant B Data is divided into 100 sec bins |
 |
 |
| Module-wise count rates for Quadrant C Data is divided into 100 sec bins |
 |
 |
| Module-wise count rates for Quadrant D Data is divided into 100 sec bins |
 |
 |
| Parameter | Plot |
|---|---|
| CZT HV Monitor |  |
| D_VDD |  |
| Temperature 1 |  |
| Veto HV Monitor |  |
| Veto LLD |  |
| Alpha Counter |  |
| _CPM_Rate |  |
| CZT Counter |  |
| +2.5 Volts monitor |  |
| +5 Volts monitor | 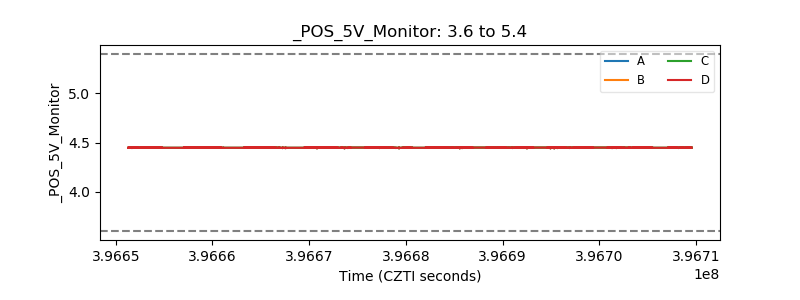 |
| _ROLL_ROT |  |
| _Roll_DEC |  |
| _Roll_RA |  |
| Veto Counter |  |