| Param | Original file | Final file |
|---|---|---|
| Filename | modeM0/AS1C07_010T01_9000005246cztM0_level2_bc.evt | modeM0/AS1C07_010T01_9000005246cztM0_level2_quad_clean.evt |
| Size (bytes) | 4,561,813,440 | 1,552,397,760 |
| Size | 4.2 GB | 1.4 GB |
| Events in quadrant A | 32,437,782 | 11,455,798 |
| Events in quadrant B | 6,080,026 | 2,461,754 |
| Events in quadrant C | 39,329,420 | 12,374,302 |
| Events in quadrant D | 51,322,385 | 11,756,890 |
| Mode SS | |||
|---|---|---|---|
| Quadrant | BADHDUFLAG | Total packets | Discarded packets |
| A | 0 | 2576 | 0 |
| B | 0 | 2681 | 0 |
| C | 0 | 2678 | 0 |
| D | 0 | 2672 | 0 |
| Mode M9 | |||
|---|---|---|---|
| Quadrant | BADHDUFLAG | Total packets | Discarded packets |
| A | 0 | 506 | 0 |
| B | 0 | 543 | 0 |
| C | 0 | 506 | 0 |
| D | 0 | 543 | 0 |
| Mode M0 | |||
|---|---|---|---|
| Quadrant | BADHDUFLAG | Total packets | Discarded packets |
| A | 0 | 275683 | 0 |
| B | 0 | 158956 | 0 |
| C | 0 | 272672 | 0 |
| D | 0 | 331219 | 0 |
| Quadrant | Total seconds | Saturated seconds | Saturation percentage |
|---|---|---|---|
| A | 130167 | 598 | 0.459410% |
| B | 131658 | 111155 | 84.427076% |
| C | 130181 | 595 | 0.457056% |
| D | 130057 | 5200 | 3.998247% |
Noise dominated data is calculated using 1-second bins in cleaned event files. If a bin has >2000 counts, and if more than 50% of those come from <1% of pixels, then it is considered to be noise-dominated and hence unusable.
| Quadrant | # 1 sec bins | Bins with >0 counts | Bins with >2000 counts | High rate bins dominated by noise | Noise dominated (total time) | Noise dominated (detector-on time) | Marked lightcurve |
|---|---|---|---|---|---|---|---|
| A | 203199 | 134347 | 75 | 75 | 0.04% | 0.06% |  |
| B | 203190 | 38869 | 10 | 10 | 0.00% | 0.03% |  |
| C | 203199 | 134362 | 106 | 106 | 0.05% | 0.08% | 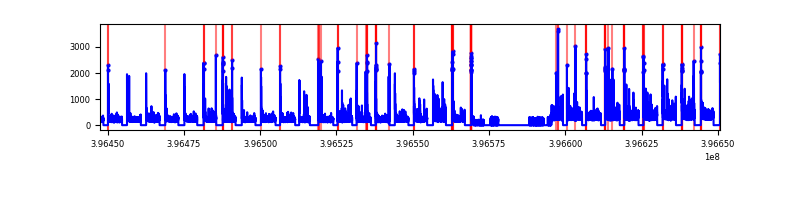 |
| D | 203199 | 134106 | 1490 | 1490 | 0.73% | 1.11% |  |
Top three noisy pixels from each quadrant. If the there are fewer than three noisy pixels in the level2.evt file, extra rows are filled as -1
| Pixel properties | Quadrant properties | ||||||
|---|---|---|---|---|---|---|---|
| Quadrant | DetID | PixID | Counts | Sigma | Mean | Median | Sigma |
| A | 10 | 83 | 4183809 | 2850.45 | 6676 | 6573 | 1465.5 |
| A | 15 | 223 | 765301 | 517.74 | 6676 | 6573 | 1465.5 |
| A | 9 | 143 | 709860 | 479.91 | 6676 | 6573 | 1465.5 |
| B | 5 | 172 | 334550 | 1402.25 | 1200 | 1175 | 237.7 |
| B | 0 | 229 | 306770 | 1285.4 | 1200 | 1175 | 237.7 |
| B | 0 | 213 | 172746 | 721.67 | 1200 | 1175 | 237.7 |
| C | 15 | 214 | 5252819 | 2974.67 | 8057 | 8089 | 1763.1 |
| C | 0 | 10 | 1839477 | 1038.71 | 8057 | 8089 | 1763.1 |
| C | 0 | 207 | 539821 | 301.58 | 8057 | 8089 | 1763.1 |
| D | 13 | 249 | 3991219 | 2229.54 | 8002 | 7823 | 1786.6 |
| D | 12 | 17 | 3859903 | 2156.04 | 8002 | 7823 | 1786.6 |
| D | 12 | 233 | 2182086 | 1216.95 | 8002 | 7823 | 1786.6 |
Histogram calculated using DETX and DETY for each event in the final _common_clean file
| Quadrant A |  |
 |
Quadrant B |
|---|---|---|---|
| Quadrant D |  |
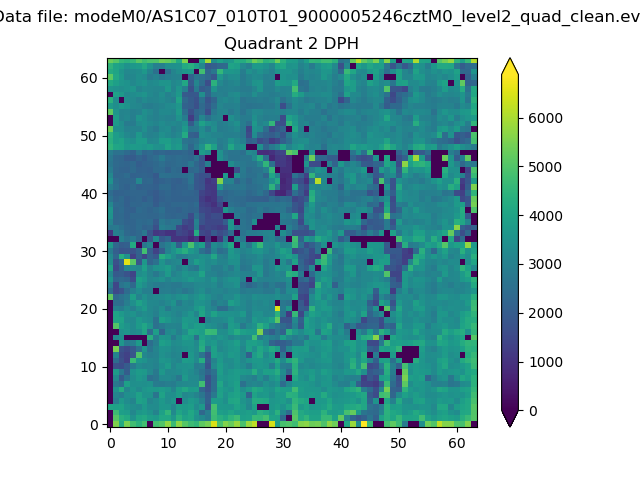 |
Quadrant C |
| Plot type | Count rate plots | Images |
|---|---|---|
| Comparison with Poisson distribution Blue bars denote a histogram of data divided into 1 sec bins. Red curve is a Poisson curve with rate = median count rate of data. |
 |
 |
| Quadrant-wise count rates Data is divided into 100 sec bins |
 |
|
| Module-wise count rates for Quadrant A Data is divided into 100 sec bins |
 |
 |
| Module-wise count rates for Quadrant B Data is divided into 100 sec bins |
 |
 |
| Module-wise count rates for Quadrant C Data is divided into 100 sec bins |
 |
 |
| Module-wise count rates for Quadrant D Data is divided into 100 sec bins |
 |
 |
| Parameter | Plot |
|---|---|
| CZT HV Monitor |  |
| D_VDD |  |
| Temperature 1 |  |
| Veto HV Monitor |  |
| Veto LLD |  |
| Alpha Counter |  |
| _CPM_Rate |  |
| CZT Counter |  |
| +2.5 Volts monitor | 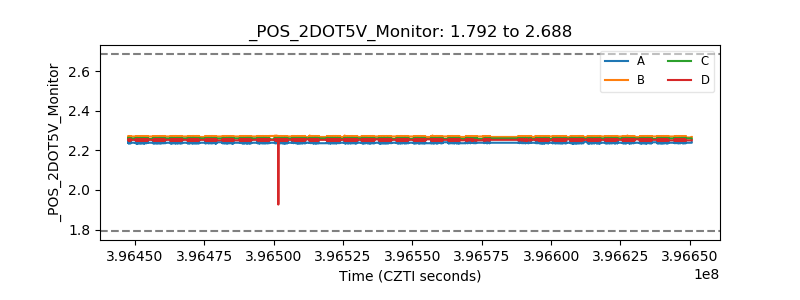 |
| +5 Volts monitor |  |
| _ROLL_ROT |  |
| _Roll_DEC |  |
| _Roll_RA | 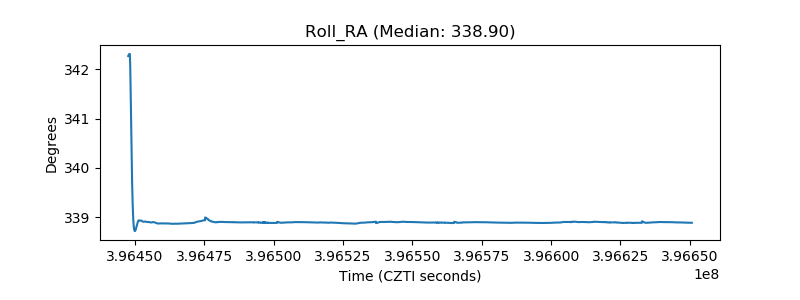 |
| Veto Counter |  |