| Param | Original file | Final file |
|---|---|---|
| Filename | modeM0/AS1A11_075T01_9000005244cztM0_level2_bc.evt | modeM0/AS1A11_075T01_9000005244cztM0_level2_quad_clean.evt |
| Size (bytes) | 22,538,056,320 | 4,537,140,480 |
| Size | 21.0 GB | 4.2 GB |
| Events in quadrant A | 94,097,880 | 33,746,101 |
| Events in quadrant B | 286,511,242 | 11,004,253 |
| Events in quadrant C | 110,601,725 | 34,294,986 |
| Events in quadrant D | 165,057,965 | 31,958,423 |
| Mode SS | |||
|---|---|---|---|
| Quadrant | BADHDUFLAG | Total packets | Discarded packets |
| A | 0 | 7862 | 0 |
| B | 0 | 7860 | 0 |
| C | 0 | 7860 | 0 |
| D | 0 | 7862 | 0 |
| Mode M0 | |||
|---|---|---|---|
| Quadrant | BADHDUFLAG | Total packets | Discarded packets |
| A | 0 | 808907 | 0 |
| B | 0 | 1450002 | 0 |
| C | 0 | 852155 | 0 |
| D | 0 | 1080834 | 0 |
| Mode M9 | |||
|---|---|---|---|
| Quadrant | BADHDUFLAG | Total packets | Discarded packets |
| A | 0 | 1474 | 0 |
| B | 0 | 1474 | 0 |
| C | 0 | 1474 | 0 |
| D | 0 | 1475 | 0 |
| Quadrant | Total seconds | Saturated seconds | Saturation percentage |
|---|---|---|---|
| A | 384316 | 1128 | 0.293508% |
| B | 384188 | 327296 | 85.191625% |
| C | 384308 | 4600 | 1.196957% |
| D | 384313 | 21996 | 5.723460% |
Noise dominated data is calculated using 1-second bins in cleaned event files. If a bin has >2000 counts, and if more than 50% of those come from <1% of pixels, then it is considered to be noise-dominated and hence unusable.
| Quadrant | # 1 sec bins | Bins with >0 counts | Bins with >2000 counts | High rate bins dominated by noise | Noise dominated (total time) | Noise dominated (detector-on time) | Marked lightcurve |
|---|---|---|---|---|---|---|---|
| A | 589203 | 384428 | 119 | 119 | 0.02% | 0.03% |  |
| B | 589202 | 216618 | 58284 | 58284 | 9.89% | 26.91% |  |
| C | 589203 | 384336 | 906 | 906 | 0.15% | 0.24% |  |
| D | 589203 | 384308 | 7463 | 7463 | 1.27% | 1.94% |  |
Top three noisy pixels from each quadrant. If the there are fewer than three noisy pixels in the level2.evt file, extra rows are filled as -1
| Pixel properties | Quadrant properties | ||||||
|---|---|---|---|---|---|---|---|
| Quadrant | DetID | PixID | Counts | Sigma | Mean | Median | Sigma |
| A | 10 | 83 | 13110881 | 3038.03 | 19333 | 19051 | 4309.3 |
| A | 9 | 143 | 1687083 | 387.08 | 19333 | 19051 | 4309.3 |
| A | 14 | 235 | 950863 | 216.23 | 19333 | 19051 | 4309.3 |
| B | 12 | 1 | 248765106 | 198760.22 | 6220 | 6080 | 1251.6 |
| B | 5 | 172 | 3601383 | 2872.67 | 6220 | 6080 | 1251.6 |
| B | 5 | 255 | 1505131 | 1197.75 | 6220 | 6080 | 1251.6 |
| C | 15 | 214 | 15616305 | 3564.18 | 19104 | 19015 | 4376.1 |
| C | 0 | 10 | 6229559 | 1419.19 | 19104 | 19015 | 4376.1 |
| C | 14 | 254 | 5213294 | 1186.96 | 19104 | 19015 | 4376.1 |
| D | 12 | 235 | 16444870 | 3637.85 | 18792 | 18230 | 4515.5 |
| D | 13 | 249 | 12437006 | 2750.27 | 18792 | 18230 | 4515.5 |
| D | 12 | 17 | 9570846 | 2115.53 | 18792 | 18230 | 4515.5 |
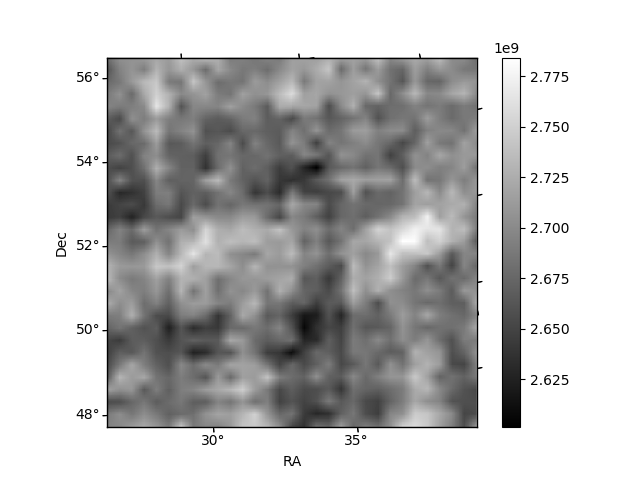
Histogram calculated using DETX and DETY for each event in the final _common_clean file
| Quadrant A |  |
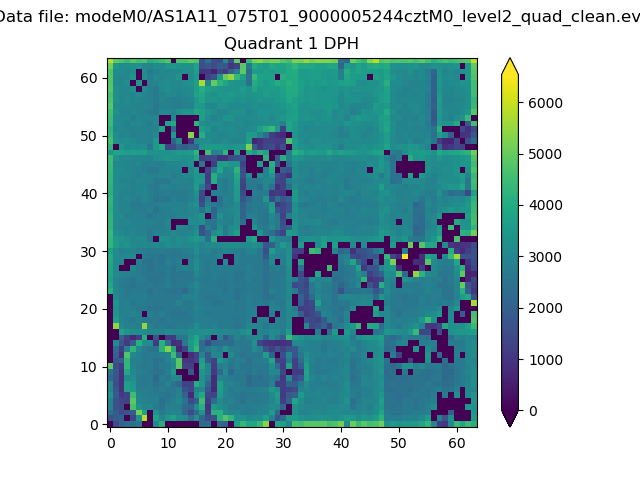 |
Quadrant B |
|---|---|---|---|
| Quadrant D |  |
 |
Quadrant C |
| Plot type | Count rate plots | Images |
|---|---|---|
| Comparison with Poisson distribution Blue bars denote a histogram of data divided into 1 sec bins. Red curve is a Poisson curve with rate = median count rate of data. |
 |
 |
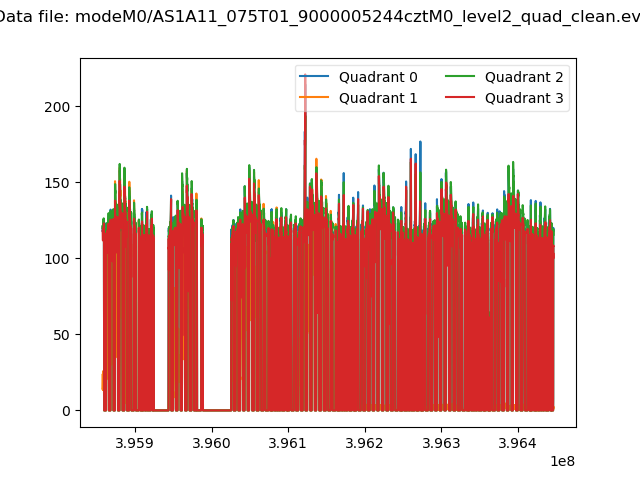
| Quadrant-wise count rates Data is divided into 100 sec bins |
 |
|
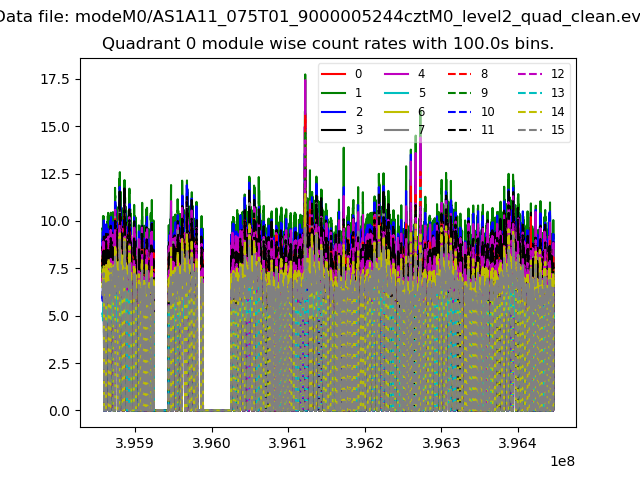
| Module-wise count rates for Quadrant A Data is divided into 100 sec bins |
 |
 |
| Module-wise count rates for Quadrant B Data is divided into 100 sec bins |
 |
 |
| Module-wise count rates for Quadrant C Data is divided into 100 sec bins |
 |
 |
| Module-wise count rates for Quadrant D Data is divided into 100 sec bins |
 |
 |
| Parameter | Plot |
|---|---|
| CZT HV Monitor | 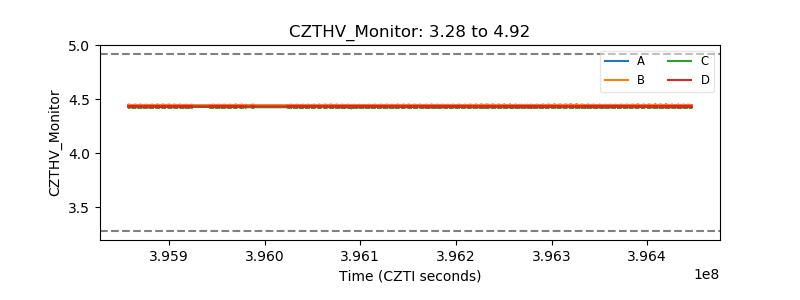 |
| D_VDD |  |
| Temperature 1 | 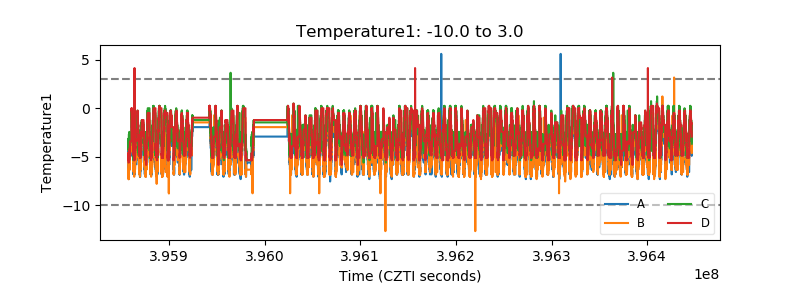 |
| Veto HV Monitor |  |
| Veto LLD | 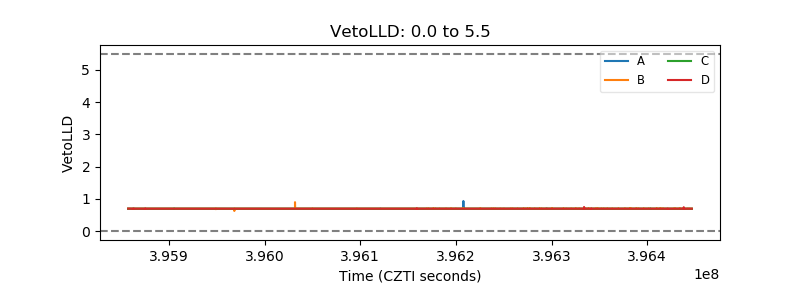 |
| Alpha Counter |  |
| _CPM_Rate |  |
| CZT Counter | 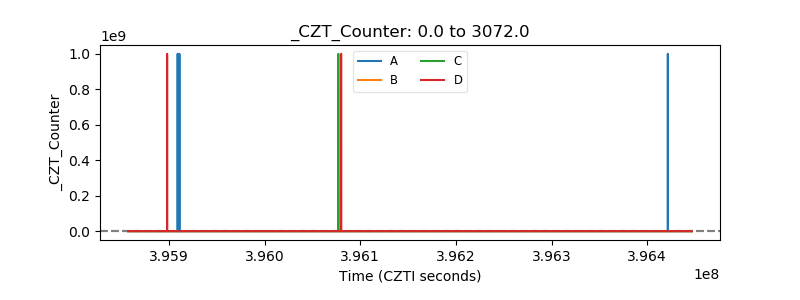 |
| +2.5 Volts monitor |  |
| +5 Volts monitor |  |
| _ROLL_ROT | 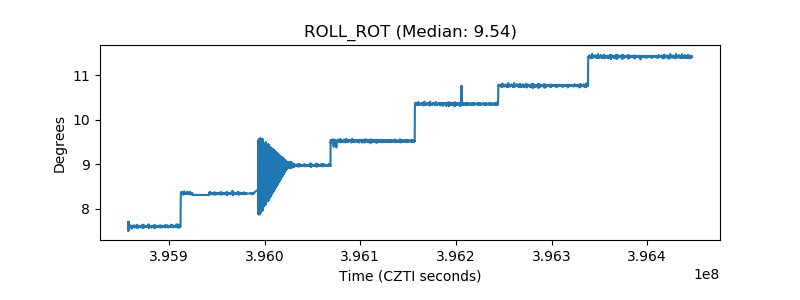 |
| _Roll_DEC |  |
| _Roll_RA |  |
| Veto Counter |  |