| Param | Original file | Final file |
|---|---|---|
| Filename | modeM0/AS1A11_083T01_9000005242cztM0_level2_bc.evt | modeM0/AS1A11_083T01_9000005242cztM0_level2_quad_clean.evt |
| Size (bytes) | 3,435,770,880 | 562,809,600 |
| Size | 3.2 GB | 536.7 MB |
| Events in quadrant A | 12,194,493 | 4,031,277 |
| Events in quadrant B | 53,109,884 | 2,009,811 |
| Events in quadrant C | 14,391,253 | 3,947,806 |
| Events in quadrant D | 21,013,713 | 3,681,087 |
| Mode SS | |||
|---|---|---|---|
| Quadrant | BADHDUFLAG | Total packets | Discarded packets |
| A | 0 | 998 | 0 |
| B | 0 | 998 | 0 |
| C | 0 | 998 | 0 |
| D | 0 | 998 | 0 |
| Mode M9 | |||
|---|---|---|---|
| Quadrant | BADHDUFLAG | Total packets | Discarded packets |
| A | 0 | 193 | 0 |
| B | 0 | 193 | 0 |
| C | 0 | 193 | 0 |
| D | 0 | 193 | 0 |
| Mode M0 | |||
|---|---|---|---|
| Quadrant | BADHDUFLAG | Total packets | Discarded packets |
| A | 0 | 104075 | 0 |
| B | 0 | 315697 | 0 |
| C | 0 | 109765 | 0 |
| D | 0 | 137762 | 0 |
| Quadrant | Total seconds | Saturated seconds | Saturation percentage |
|---|---|---|---|
| A | 49059 | 220 | 0.448440% |
| B | 49059 | 30916 | 63.017999% |
| C | 49059 | 525 | 1.070140% |
| D | 49059 | 2528 | 5.152979% |
Noise dominated data is calculated using 1-second bins in cleaned event files. If a bin has >2000 counts, and if more than 50% of those come from <1% of pixels, then it is considered to be noise-dominated and hence unusable.
| Quadrant | # 1 sec bins | Bins with >0 counts | Bins with >2000 counts | High rate bins dominated by noise | Noise dominated (total time) | Noise dominated (detector-on time) | Marked lightcurve |
|---|---|---|---|---|---|---|---|
| A | 68123 | 49070 | 11 | 11 | 0.02% | 0.02% | 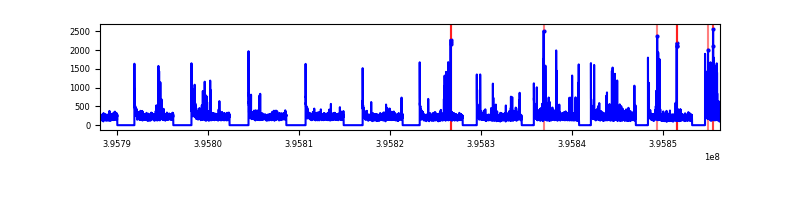 |
| B | 68122 | 48813 | 7243 | 7243 | 10.63% | 14.84% |  |
| C | 68123 | 49059 | 90 | 90 | 0.13% | 0.18% |  |
| D | 68123 | 49056 | 579 | 579 | 0.85% | 1.18% |  |
Top three noisy pixels from each quadrant. If the there are fewer than three noisy pixels in the level2.evt file, extra rows are filled as -1
| Pixel properties | Quadrant properties | ||||||
|---|---|---|---|---|---|---|---|
| Quadrant | DetID | PixID | Counts | Sigma | Mean | Median | Sigma |
| A | 10 | 83 | 1638431 | 2922.51 | 2529 | 2490 | 559.8 |
| A | 9 | 143 | 241023 | 426.12 | 2529 | 2490 | 559.8 |
| A | 15 | 223 | 204611 | 361.08 | 2529 | 2490 | 559.8 |
| B | 12 | 1 | 45182667 | 150218.54 | 1517 | 1488 | 300.8 |
| B | 4 | 171 | 845844 | 2807.32 | 1517 | 1488 | 300.8 |
| B | 5 | 172 | 266569 | 881.34 | 1517 | 1488 | 300.8 |
| C | 15 | 214 | 2069947 | 3672.23 | 2455 | 2439 | 563.0 |
| C | 14 | 254 | 1334534 | 2366.02 | 2455 | 2439 | 563.0 |
| C | 0 | 207 | 986738 | 1748.28 | 2455 | 2439 | 563.0 |
| D | 12 | 6 | 3264615 | 5686.48 | 2422 | 2352 | 573.7 |
| D | 12 | 227 | 1635945 | 2847.53 | 2422 | 2352 | 573.7 |
| D | 13 | 249 | 1540748 | 2681.59 | 2422 | 2352 | 573.7 |
Histogram calculated using DETX and DETY for each event in the final _common_clean file
| Quadrant A |  |
 |
Quadrant B |
|---|---|---|---|
| Quadrant D |  |
 |
Quadrant C |
| Plot type | Count rate plots | Images |
|---|---|---|
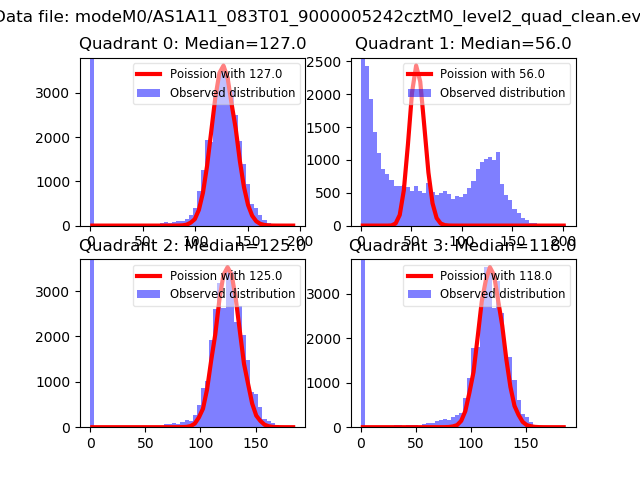
| Comparison with Poisson distribution Blue bars denote a histogram of data divided into 1 sec bins. Red curve is a Poisson curve with rate = median count rate of data. |
 |
 |
| Quadrant-wise count rates Data is divided into 100 sec bins |
 |
|
| Module-wise count rates for Quadrant A Data is divided into 100 sec bins |
 |
 |
| Module-wise count rates for Quadrant B Data is divided into 100 sec bins |
 |
 |
| Module-wise count rates for Quadrant C Data is divided into 100 sec bins |
 |
 |
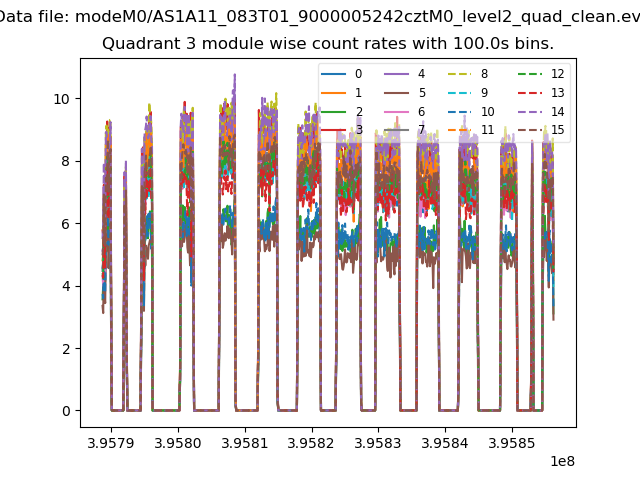
| Module-wise count rates for Quadrant D Data is divided into 100 sec bins |
 |
 |
| Parameter | Plot |
|---|---|
| CZT HV Monitor |  |
| D_VDD |  |
| Temperature 1 |  |
| Veto HV Monitor |  |
| Veto LLD | 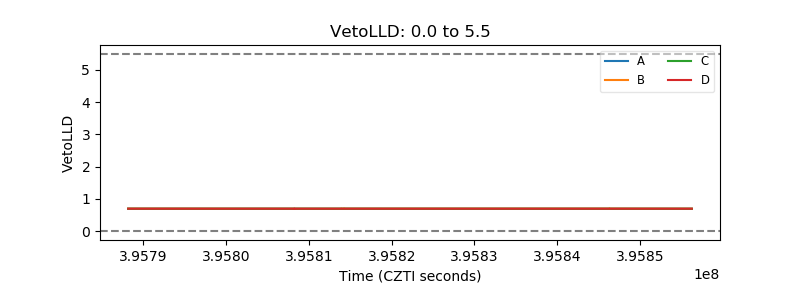 |
| Alpha Counter |  |
| _CPM_Rate | 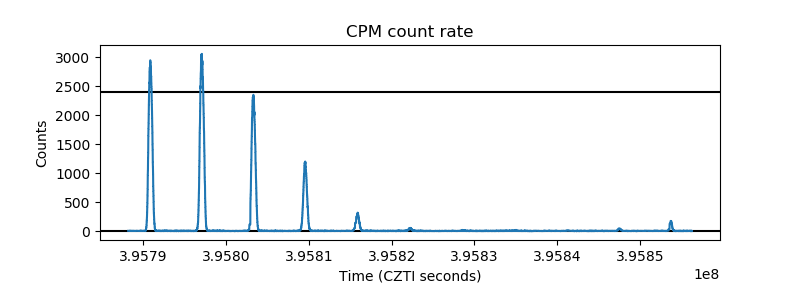 |
| CZT Counter |  |
| +2.5 Volts monitor |  |
| +5 Volts monitor |  |
| _ROLL_ROT |  |
| _Roll_DEC |  |
| _Roll_RA |  |
| Veto Counter |  |