| Param | Original file | Final file |
|---|---|---|
| Filename | modeM0/AS1A11_101T01_9000005238cztM0_level2_bc.evt | modeM0/AS1A11_101T01_9000005238cztM0_level2_quad_clean.evt |
| Size (bytes) | 9,689,235,840 | 2,644,764,480 |
| Size | 9.0 GB | 2.5 GB |
| Events in quadrant A | 50,324,681 | 17,456,077 |
| Events in quadrant B | 63,710,508 | 14,791,318 |
| Events in quadrant C | 70,537,144 | 17,029,046 |
| Events in quadrant D | 94,169,800 | 16,039,186 |
| Mode M0 | |||
|---|---|---|---|
| Quadrant | BADHDUFLAG | Total packets | Discarded packets |
| A | 0 | 447610 | 0 |
| B | 0 | 676787 | 0 |
| C | 0 | 521222 | 0 |
| D | 0 | 605017 | 0 |
| Mode SS | |||
|---|---|---|---|
| Quadrant | BADHDUFLAG | Total packets | Discarded packets |
| A | 0 | 4418 | 0 |
| B | 0 | 4416 | 0 |
| C | 0 | 4424 | 0 |
| D | 0 | 4417 | 0 |
| Mode M9 | |||
|---|---|---|---|
| Quadrant | BADHDUFLAG | Total packets | Discarded packets |
| A | 0 | 786 | 0 |
| B | 0 | 787 | 0 |
| C | 0 | 787 | 0 |
| D | 0 | 787 | 0 |
| Quadrant | Total seconds | Saturated seconds | Saturation percentage |
|---|---|---|---|
| A | 215828 | 384 | 0.177919% |
| B | 215497 | 43487 | 20.179863% |
| C | 215814 | 6236 | 2.889525% |
| D | 215792 | 13530 | 6.269927% |
Noise dominated data is calculated using 1-second bins in cleaned event files. If a bin has >2000 counts, and if more than 50% of those come from <1% of pixels, then it is considered to be noise-dominated and hence unusable.
| Quadrant | # 1 sec bins | Bins with >0 counts | Bins with >2000 counts | High rate bins dominated by noise | Noise dominated (total time) | Noise dominated (detector-on time) | Marked lightcurve |
|---|---|---|---|---|---|---|---|
| A | 304433 | 216180 | 37 | 37 | 0.01% | 0.02% |  |
| B | 304432 | 209448 | 1385 | 1385 | 0.45% | 0.66% |  |
| C | 304433 | 216078 | 691 | 691 | 0.23% | 0.32% |  |
| D | 304433 | 216087 | 6547 | 6547 | 2.15% | 3.03% | 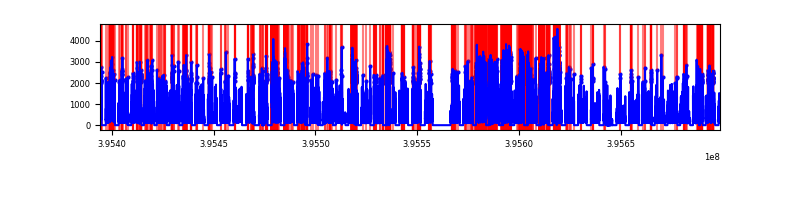 |
Top three noisy pixels from each quadrant. If the there are fewer than three noisy pixels in the level2.evt file, extra rows are filled as -1
| Pixel properties | Quadrant properties | ||||||
|---|---|---|---|---|---|---|---|
| Quadrant | DetID | PixID | Counts | Sigma | Mean | Median | Sigma |
| A | 10 | 83 | 6931410 | 2895.92 | 10782 | 10603 | 2389.9 |
| A | 9 | 143 | 780149 | 322.01 | 10782 | 10603 | 2389.9 |
| A | 13 | 254 | 353017 | 143.28 | 10782 | 10603 | 2389.9 |
| B | 12 | 1 | 13823482 | 7758.27 | 8995 | 8784 | 1780.6 |
| B | 4 | 171 | 2944034 | 1648.42 | 8995 | 8784 | 1780.6 |
| B | 5 | 255 | 2425996 | 1357.5 | 8995 | 8784 | 1780.6 |
| C | 14 | 254 | 13888076 | 5892.87 | 10357 | 10279 | 2355.0 |
| C | 15 | 214 | 8724112 | 3700.12 | 10357 | 10279 | 2355.0 |
| C | 0 | 10 | 5589392 | 2369.04 | 10357 | 10279 | 2355.0 |
| D | 12 | 227 | 21754663 | 8802.69 | 10310 | 9997 | 2470.2 |
| D | 1 | 20 | 6158824 | 2489.17 | 10310 | 9997 | 2470.2 |
| D | 13 | 249 | 4055254 | 1637.6 | 10310 | 9997 | 2470.2 |
Histogram calculated using DETX and DETY for each event in the final _common_clean file
| Quadrant A |  |
 |
Quadrant B |
|---|---|---|---|
| Quadrant D |  |
 |
Quadrant C |
| Plot type | Count rate plots | Images |
|---|---|---|
| Comparison with Poisson distribution Blue bars denote a histogram of data divided into 1 sec bins. Red curve is a Poisson curve with rate = median count rate of data. |
 |
 |
| Quadrant-wise count rates Data is divided into 100 sec bins |
 |
|
| Module-wise count rates for Quadrant A Data is divided into 100 sec bins |
 |
 |
| Module-wise count rates for Quadrant B Data is divided into 100 sec bins |
 |
 |
| Module-wise count rates for Quadrant C Data is divided into 100 sec bins |
 |
 |
| Module-wise count rates for Quadrant D Data is divided into 100 sec bins |
 |
 |
| Parameter | Plot |
|---|---|
| CZT HV Monitor | 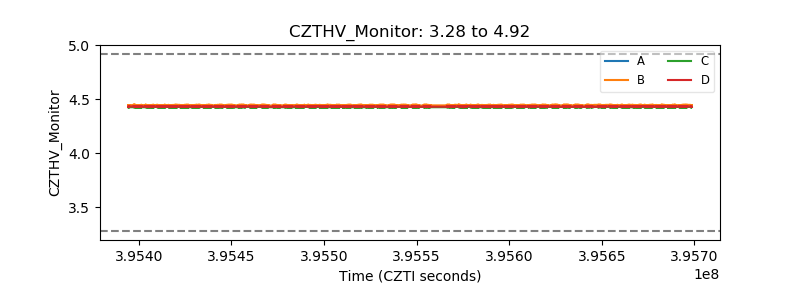 |
| D_VDD |  |
| Temperature 1 |  |
| Veto HV Monitor |  |
| Veto LLD | 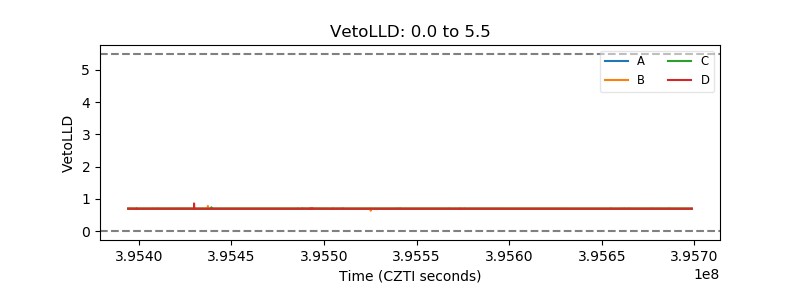 |
| Alpha Counter |  |
| _CPM_Rate |  |
| CZT Counter |  |
| +2.5 Volts monitor |  |
| +5 Volts monitor | 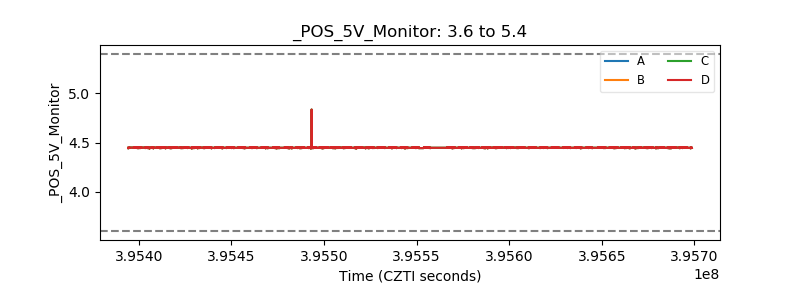 |
| _ROLL_ROT |  |
| _Roll_DEC | 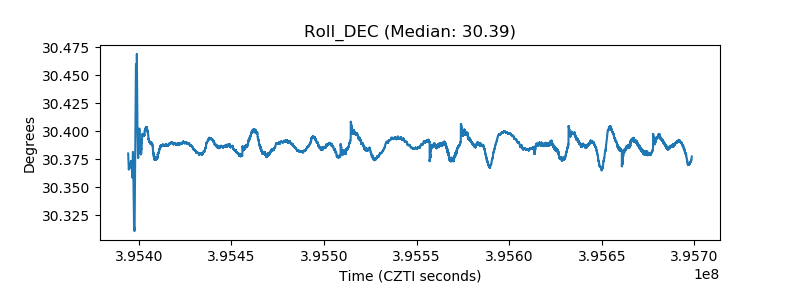 |
| _Roll_RA | 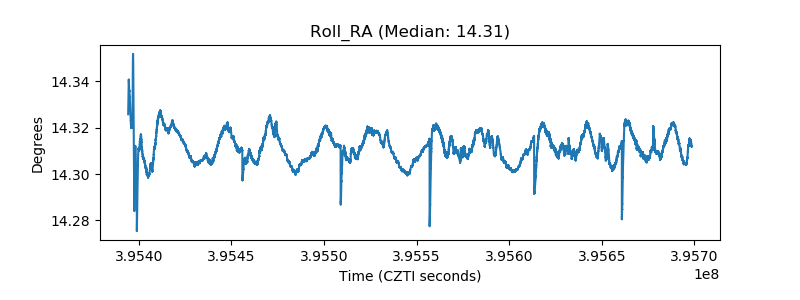 |
| Veto Counter |  |