| Param | Original file | Final file |
|---|---|---|
| Filename | modeM0/AS1T05_041T01_9000005234cztM0_level2_bc.evt | modeM0/AS1T05_041T01_9000005234cztM0_level2_quad_clean.evt |
| Size (bytes) | 3,812,451,840 | 1,644,071,040 |
| Size | 3.6 GB | 1.5 GB |
| Events in quadrant A | 20,590,523 | 11,146,405 |
| Events in quadrant B | 26,312,837 | 11,105,721 |
| Events in quadrant C | 29,451,977 | 11,090,129 |
| Events in quadrant D | 33,198,988 | 10,507,219 |
| Mode M9 | |||
|---|---|---|---|
| Quadrant | BADHDUFLAG | Total packets | Discarded packets |
| A | 0 | 326 | 0 |
| B | 0 | 326 | 0 |
| C | 0 | 326 | 0 |
| D | 0 | 326 | 0 |
| Mode M0 | |||
|---|---|---|---|
| Quadrant | BADHDUFLAG | Total packets | Discarded packets |
| A | 0 | 180515 | 0 |
| B | 0 | 205801 | 0 |
| C | 0 | 207266 | 0 |
| D | 0 | 231763 | 0 |
| Mode SS | |||
|---|---|---|---|
| Quadrant | BADHDUFLAG | Total packets | Discarded packets |
| A | 0 | 1774 | 0 |
| B | 0 | 1774 | 0 |
| C | 0 | 1774 | 0 |
| D | 0 | 1774 | 0 |
| Quadrant | Total seconds | Saturated seconds | Saturation percentage |
|---|---|---|---|
| A | 86845 | 170 | 0.195751% |
| B | 86845 | 2181 | 2.511371% |
| C | 86845 | 2749 | 3.165410% |
| D | 86845 | 3350 | 3.857447% |
Noise dominated data is calculated using 1-second bins in cleaned event files. If a bin has >2000 counts, and if more than 50% of those come from <1% of pixels, then it is considered to be noise-dominated and hence unusable.
| Quadrant | # 1 sec bins | Bins with >0 counts | Bins with >2000 counts | High rate bins dominated by noise | Noise dominated (total time) | Noise dominated (detector-on time) | Marked lightcurve |
|---|---|---|---|---|---|---|---|
| A | 119322 | 86864 | 15 | 15 | 0.01% | 0.02% |  |
| B | 119322 | 86845 | 239 | 239 | 0.20% | 0.28% |  |
| C | 119322 | 86845 | 959 | 959 | 0.80% | 1.10% | 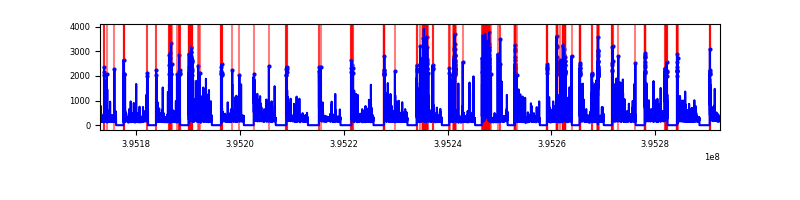 |
| D | 119322 | 86844 | 502 | 502 | 0.42% | 0.58% |  |
Top three noisy pixels from each quadrant. If the there are fewer than three noisy pixels in the level2.evt file, extra rows are filled as -1
| Pixel properties | Quadrant properties | ||||||
|---|---|---|---|---|---|---|---|
| Quadrant | DetID | PixID | Counts | Sigma | Mean | Median | Sigma |
| A | 10 | 83 | 2614880 | 2643.6 | 4462 | 4399 | 987.5 |
| A | 9 | 143 | 294945 | 294.23 | 4462 | 4399 | 987.5 |
| A | 13 | 6 | 179349 | 177.17 | 4462 | 4399 | 987.5 |
| B | 5 | 255 | 3813471 | 4372.38 | 4438 | 4353 | 871.2 |
| B | 0 | 189 | 3085601 | 3536.88 | 4438 | 4353 | 871.2 |
| B | 0 | 229 | 730862 | 833.94 | 4438 | 4353 | 871.2 |
| C | 15 | 214 | 3671563 | 3655.02 | 4378 | 4355 | 1003.3 |
| C | 1 | 23 | 3163631 | 3148.78 | 4378 | 4355 | 1003.3 |
| C | 0 | 10 | 3110764 | 3096.09 | 4378 | 4355 | 1003.3 |
| D | 2 | 249 | 2481322 | 2405.3 | 4386 | 4274 | 1029.8 |
| D | 13 | 249 | 2180902 | 2113.58 | 4386 | 4274 | 1029.8 |
| D | 12 | 233 | 1772712 | 1717.21 | 4386 | 4274 | 1029.8 |
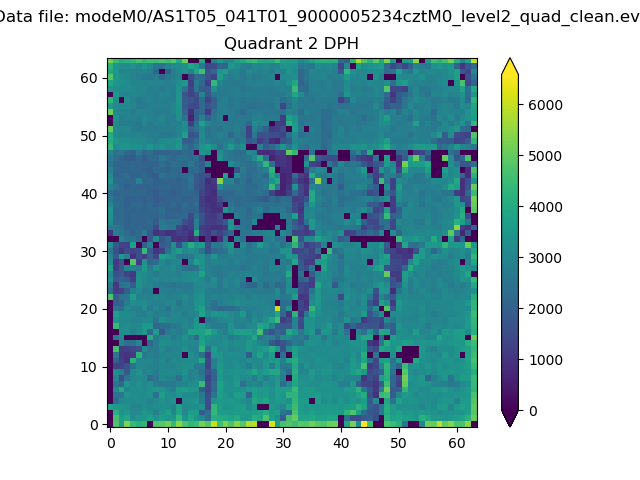
Histogram calculated using DETX and DETY for each event in the final _common_clean file
| Quadrant A |  |
 |
Quadrant B |
|---|---|---|---|
| Quadrant D |  |
 |
Quadrant C |
| Plot type | Count rate plots | Images |
|---|---|---|
| Comparison with Poisson distribution Blue bars denote a histogram of data divided into 1 sec bins. Red curve is a Poisson curve with rate = median count rate of data. |
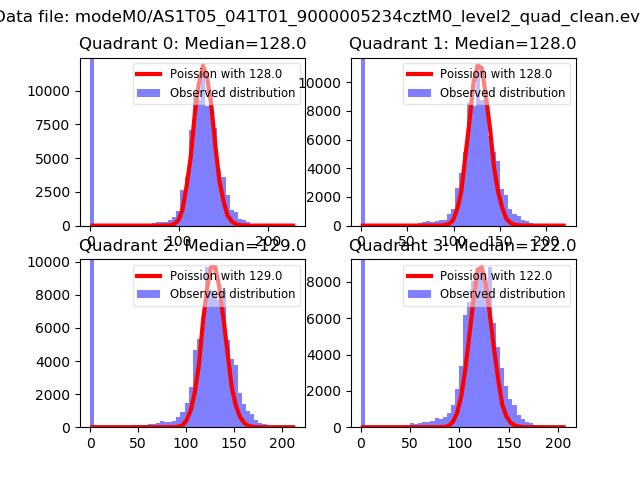 |
 |
| Quadrant-wise count rates Data is divided into 100 sec bins |
 |
|
| Module-wise count rates for Quadrant A Data is divided into 100 sec bins |
 |
 |
| Module-wise count rates for Quadrant B Data is divided into 100 sec bins |
 |
 |
| Module-wise count rates for Quadrant C Data is divided into 100 sec bins |
 |
 |
| Module-wise count rates for Quadrant D Data is divided into 100 sec bins |
 |
 |
| Parameter | Plot |
|---|---|
| CZT HV Monitor |  |
| D_VDD |  |
| Temperature 1 |  |
| Veto HV Monitor |  |
| Veto LLD |  |
| Alpha Counter |  |
| _CPM_Rate | 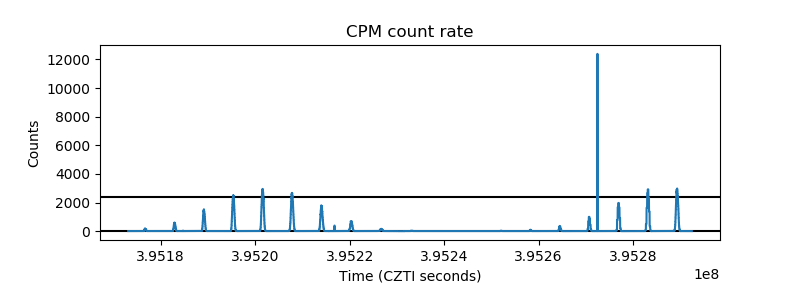 |
| CZT Counter |  |
| +2.5 Volts monitor |  |
| +5 Volts monitor |  |
| _ROLL_ROT |  |
| _Roll_DEC |  |
| _Roll_RA | 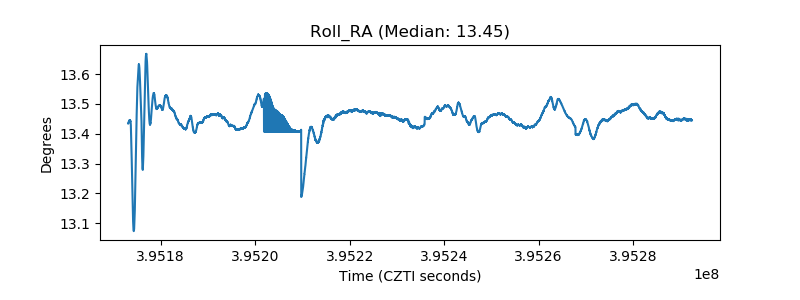 |
| Veto Counter | 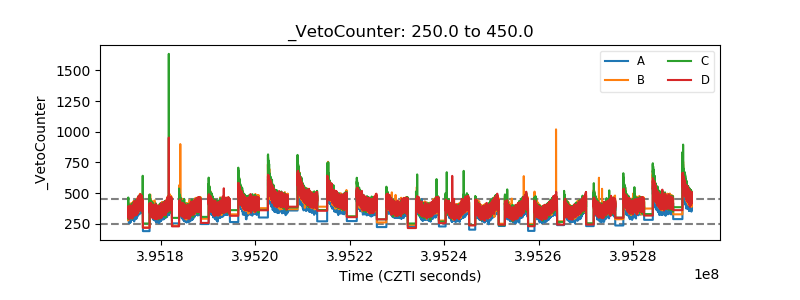 |