| Param | Original file | Final file |
|---|---|---|
| Filename | modeM0/AS1A11_049T04_9000005230cztM0_level2_bc.evt | modeM0/AS1A11_049T04_9000005230cztM0_level2_quad_clean.evt |
| Size (bytes) | 2,460,044,160 | 677,632,320 |
| Size | 2.3 GB | 646.2 MB |
| Events in quadrant A | 13,300,301 | 4,344,303 |
| Events in quadrant B | 14,500,185 | 4,303,557 |
| Events in quadrant C | 17,288,948 | 4,198,167 |
| Events in quadrant D | 25,672,464 | 3,906,639 |
| Mode M0 | |||
|---|---|---|---|
| Quadrant | BADHDUFLAG | Total packets | Discarded packets |
| A | 0 | 115354 | 0 |
| B | 0 | 121339 | 0 |
| C | 0 | 128540 | 0 |
| D | 0 | 165309 | 0 |
| Mode M9 | |||
|---|---|---|---|
| Quadrant | BADHDUFLAG | Total packets | Discarded packets |
| A | 0 | 201 | 0 |
| B | 0 | 201 | 0 |
| C | 0 | 201 | 0 |
| D | 0 | 201 | 0 |
| Mode SS | |||
|---|---|---|---|
| Quadrant | BADHDUFLAG | Total packets | Discarded packets |
| A | 0 | 1122 | 0 |
| B | 0 | 1122 | 0 |
| C | 0 | 1122 | 0 |
| D | 0 | 1122 | 0 |
| Quadrant | Total seconds | Saturated seconds | Saturation percentage |
|---|---|---|---|
| A | 54971 | 128 | 0.232850% |
| B | 54971 | 661 | 1.202452% |
| C | 54971 | 1370 | 2.492223% |
| D | 54971 | 3542 | 6.443397% |
Noise dominated data is calculated using 1-second bins in cleaned event files. If a bin has >2000 counts, and if more than 50% of those come from <1% of pixels, then it is considered to be noise-dominated and hence unusable.
| Quadrant | # 1 sec bins | Bins with >0 counts | Bins with >2000 counts | High rate bins dominated by noise | Noise dominated (total time) | Noise dominated (detector-on time) | Marked lightcurve |
|---|---|---|---|---|---|---|---|
| A | 75017 | 54983 | 14 | 14 | 0.02% | 0.03% |  |
| B | 75017 | 54972 | 114 | 114 | 0.15% | 0.21% |  |
| C | 75017 | 54971 | 311 | 311 | 0.41% | 0.57% |  |
| D | 75017 | 54970 | 581 | 581 | 0.77% | 1.06% |  |
Top three noisy pixels from each quadrant. If the there are fewer than three noisy pixels in the level2.evt file, extra rows are filled as -1
| Pixel properties | Quadrant properties | ||||||
|---|---|---|---|---|---|---|---|
| Quadrant | DetID | PixID | Counts | Sigma | Mean | Median | Sigma |
| A | 10 | 83 | 1640157 | 2542.87 | 2895 | 2851 | 643.9 |
| A | 9 | 143 | 275559 | 423.54 | 2895 | 2851 | 643.9 |
| A | 13 | 6 | 99377 | 149.91 | 2895 | 2851 | 643.9 |
| B | 0 | 190 | 1300181 | 2275.41 | 2887 | 2831 | 570.2 |
| B | 5 | 255 | 771479 | 1348.12 | 2887 | 2831 | 570.2 |
| B | 0 | 221 | 353853 | 615.65 | 2887 | 2831 | 570.2 |
| C | 0 | 10 | 2192604 | 3494.16 | 2763 | 2743 | 626.7 |
| C | 15 | 214 | 2175074 | 3466.19 | 2763 | 2743 | 626.7 |
| C | 14 | 254 | 1332090 | 2121.12 | 2763 | 2743 | 626.7 |
| D | 12 | 235 | 8689764 | 13262.23 | 2763 | 2680 | 655.0 |
| D | 12 | 6 | 1249014 | 1902.73 | 2763 | 2680 | 655.0 |
| D | 2 | 153 | 836219 | 1272.53 | 2763 | 2680 | 655.0 |
Histogram calculated using DETX and DETY for each event in the final _common_clean file
| Quadrant A |  |
 |
Quadrant B |
|---|---|---|---|
| Quadrant D |  |
 |
Quadrant C |
| Plot type | Count rate plots | Images |
|---|---|---|
| Comparison with Poisson distribution Blue bars denote a histogram of data divided into 1 sec bins. Red curve is a Poisson curve with rate = median count rate of data. |
 |
 |
| Quadrant-wise count rates Data is divided into 100 sec bins |
 |
|
| Module-wise count rates for Quadrant A Data is divided into 100 sec bins |
 |
 |
| Module-wise count rates for Quadrant B Data is divided into 100 sec bins |
 |
 |
| Module-wise count rates for Quadrant C Data is divided into 100 sec bins |
 |
 |
| Module-wise count rates for Quadrant D Data is divided into 100 sec bins |
 |
 |
| Parameter | Plot |
|---|---|
| CZT HV Monitor |  |
| D_VDD |  |
| Temperature 1 |  |
| Veto HV Monitor |  |
| Veto LLD |  |
| Alpha Counter |  |
| _CPM_Rate |  |
| CZT Counter |  |
| +2.5 Volts monitor | 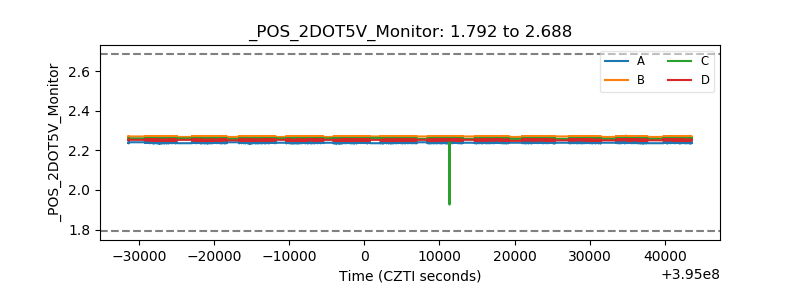 |
| +5 Volts monitor |  |
| _ROLL_ROT |  |
| _Roll_DEC |  |
| _Roll_RA |  |
| Veto Counter |  |