| Param | Original file | Final file |
|---|---|---|
| Filename | modeM0/AS1A11_049T03_9000005228cztM0_level2_bc.evt | modeM0/AS1A11_049T03_9000005228cztM0_level2_quad_clean.evt |
| Size (bytes) | 3,465,996,480 | 604,800,000 |
| Size | 3.2 GB | 576.8 MB |
| Events in quadrant A | 12,876,862 | 4,011,466 |
| Events in quadrant B | 31,057,725 | 3,466,623 |
| Events in quadrant C | 19,289,041 | 3,866,277 |
| Events in quadrant D | 38,286,435 | 3,476,149 |
| Mode SS | |||
|---|---|---|---|
| Quadrant | BADHDUFLAG | Total packets | Discarded packets |
| A | 0 | 1038 | 0 |
| B | 0 | 1038 | 0 |
| C | 0 | 1038 | 0 |
| D | 0 | 1038 | 0 |
| Mode M9 | |||
|---|---|---|---|
| Quadrant | BADHDUFLAG | Total packets | Discarded packets |
| A | 0 | 184 | 0 |
| B | 0 | 184 | 0 |
| C | 0 | 184 | 0 |
| D | 0 | 184 | 0 |
| Mode M0 | |||
|---|---|---|---|
| Quadrant | BADHDUFLAG | Total packets | Discarded packets |
| A | 0 | 108853 | 0 |
| B | 0 | 198429 | 0 |
| C | 0 | 136570 | 0 |
| D | 0 | 204565 | 0 |
| Quadrant | Total seconds | Saturated seconds | Saturation percentage |
|---|---|---|---|
| A | 50897 | 159 | 0.312396% |
| B | 50897 | 12526 | 24.610488% |
| C | 50897 | 2933 | 5.762619% |
| D | 50897 | 7376 | 14.492013% |
Noise dominated data is calculated using 1-second bins in cleaned event files. If a bin has >2000 counts, and if more than 50% of those come from <1% of pixels, then it is considered to be noise-dominated and hence unusable.
| Quadrant | # 1 sec bins | Bins with >0 counts | Bins with >2000 counts | High rate bins dominated by noise | Noise dominated (total time) | Noise dominated (detector-on time) | Marked lightcurve |
|---|---|---|---|---|---|---|---|
| A | 69212 | 50908 | 10 | 10 | 0.01% | 0.02% |  |
| B | 69212 | 50866 | 1040 | 1040 | 1.50% | 2.04% | 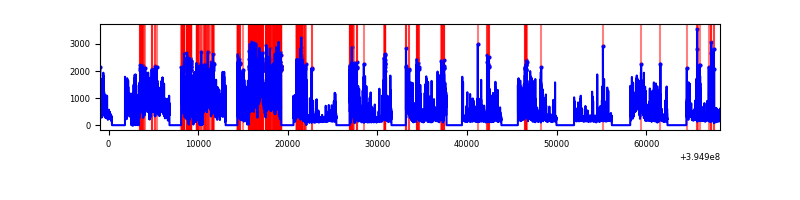 |
| C | 69212 | 50898 | 210 | 210 | 0.30% | 0.41% |  |
| D | 69212 | 50896 | 1909 | 1909 | 2.76% | 3.75% |  |
Top three noisy pixels from each quadrant. If the there are fewer than three noisy pixels in the level2.evt file, extra rows are filled as -1
| Pixel properties | Quadrant properties | ||||||
|---|---|---|---|---|---|---|---|
| Quadrant | DetID | PixID | Counts | Sigma | Mean | Median | Sigma |
| A | 10 | 83 | 1506329 | 2450.17 | 2749 | 2703 | 613.7 |
| A | 15 | 223 | 318539 | 514.66 | 2749 | 2703 | 613.7 |
| A | 9 | 143 | 117789 | 187.53 | 2749 | 2703 | 613.7 |
| B | 5 | 200 | 18954066 | 39315.13 | 2431 | 2381 | 482.0 |
| B | 5 | 255 | 1107077 | 2291.68 | 2431 | 2381 | 482.0 |
| B | 0 | 213 | 334417 | 688.81 | 2431 | 2381 | 482.0 |
| C | 14 | 254 | 4881091 | 8343.96 | 2577 | 2554 | 584.7 |
| C | 15 | 214 | 1986724 | 3393.61 | 2577 | 2554 | 584.7 |
| C | 0 | 10 | 1913674 | 3268.67 | 2577 | 2554 | 584.7 |
| D | 12 | 235 | 19313253 | 32354.19 | 2521 | 2449 | 596.9 |
| D | 2 | 250 | 3305928 | 5534.8 | 2521 | 2449 | 596.9 |
| D | 12 | 17 | 2492702 | 4172.28 | 2521 | 2449 | 596.9 |
Histogram calculated using DETX and DETY for each event in the final _common_clean file
| Quadrant A | 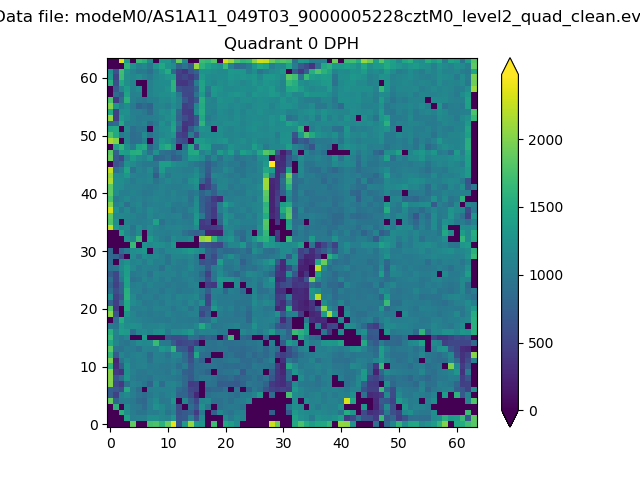 |
 |
Quadrant B |
|---|---|---|---|
| Quadrant D |  |
 |
Quadrant C |
| Plot type | Count rate plots | Images |
|---|---|---|
| Comparison with Poisson distribution Blue bars denote a histogram of data divided into 1 sec bins. Red curve is a Poisson curve with rate = median count rate of data. |
 |
 |
| Quadrant-wise count rates Data is divided into 100 sec bins |
 |
|
| Module-wise count rates for Quadrant A Data is divided into 100 sec bins |
 |
 |
| Module-wise count rates for Quadrant B Data is divided into 100 sec bins |
 |
 |
| Module-wise count rates for Quadrant C Data is divided into 100 sec bins |
 |
 |
| Module-wise count rates for Quadrant D Data is divided into 100 sec bins |
 |
 |
| Parameter | Plot |
|---|---|
| CZT HV Monitor |  |
| D_VDD | 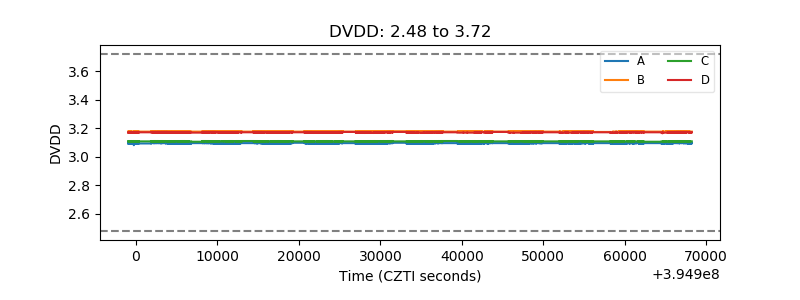 |
| Temperature 1 |  |
| Veto HV Monitor |  |
| Veto LLD |  |
| Alpha Counter |  |
| _CPM_Rate | 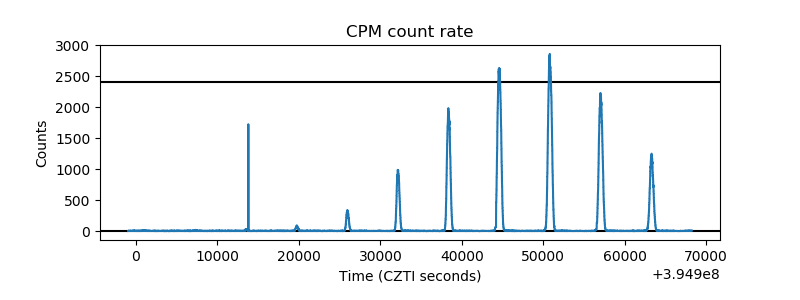 |
| CZT Counter |  |
| +2.5 Volts monitor |  |
| +5 Volts monitor | 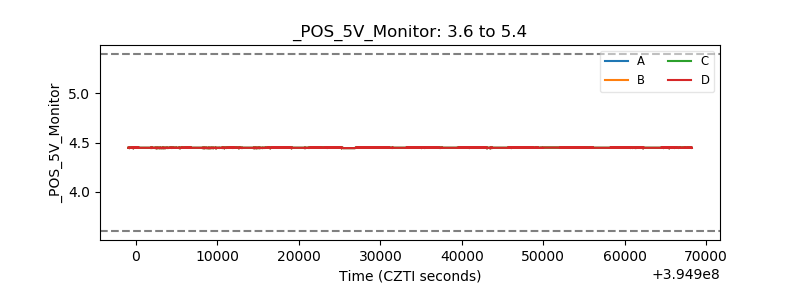 |
| _ROLL_ROT |  |
| _Roll_DEC | 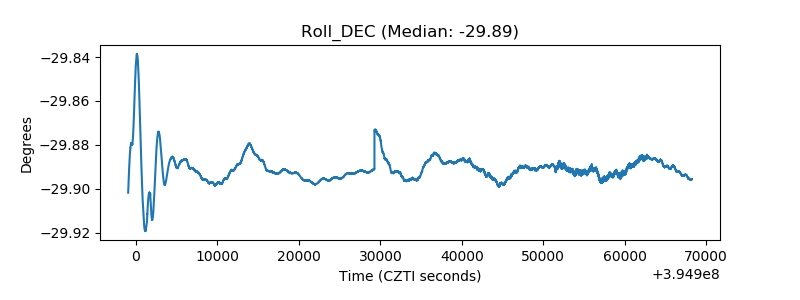 |
| _Roll_RA |  |
| Veto Counter |  |