| Param | Original file | Final file |
|---|---|---|
| Filename | modeM0/AS1A10_073T02_9000005226cztM0_level2_bc.evt | modeM0/AS1A10_073T02_9000005226cztM0_level2_quad_clean.evt |
| Size (bytes) | 4,862,900,160 | 1,070,493,120 |
| Size | 4.5 GB | 1020.9 MB |
| Events in quadrant A | 21,780,392 | 7,078,042 |
| Events in quadrant B | 30,407,393 | 6,567,411 |
| Events in quadrant C | 28,416,228 | 6,958,400 |
| Events in quadrant D | 61,004,561 | 6,097,442 |
| Mode SS | |||
|---|---|---|---|
| Quadrant | BADHDUFLAG | Total packets | Discarded packets |
| A | 0 | 1708 | 0 |
| B | 0 | 1708 | 0 |
| C | 0 | 1708 | 0 |
| D | 0 | 1708 | 0 |
| Mode M0 | |||
|---|---|---|---|
| Quadrant | BADHDUFLAG | Total packets | Discarded packets |
| A | 0 | 180837 | 0 |
| B | 0 | 241824 | 0 |
| C | 0 | 202424 | 0 |
| D | 0 | 341317 | 0 |
| Mode M9 | |||
|---|---|---|---|
| Quadrant | BADHDUFLAG | Total packets | Discarded packets |
| A | 0 | 326 | 0 |
| B | 0 | 326 | 0 |
| C | 0 | 326 | 0 |
| D | 0 | 326 | 0 |
| Quadrant | Total seconds | Saturated seconds | Saturation percentage |
|---|---|---|---|
| A | 83374 | 538 | 0.645285% |
| B | 83374 | 9737 | 11.678701% |
| C | 83374 | 2262 | 2.713076% |
| D | 83374 | 11685 | 14.015161% |
Noise dominated data is calculated using 1-second bins in cleaned event files. If a bin has >2000 counts, and if more than 50% of those come from <1% of pixels, then it is considered to be noise-dominated and hence unusable.
| Quadrant | # 1 sec bins | Bins with >0 counts | Bins with >2000 counts | High rate bins dominated by noise | Noise dominated (total time) | Noise dominated (detector-on time) | Marked lightcurve |
|---|---|---|---|---|---|---|---|
| A | 115711 | 83393 | 56 | 56 | 0.05% | 0.07% |  |
| B | 115710 | 83349 | 767 | 767 | 0.66% | 0.92% |  |
| C | 115710 | 83373 | 458 | 458 | 0.40% | 0.55% | 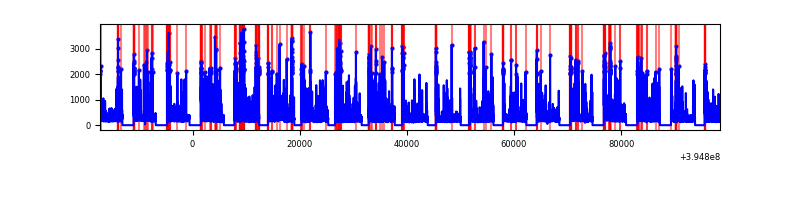 |
| D | 115710 | 83375 | 2310 | 2310 | 2.00% | 2.77% | 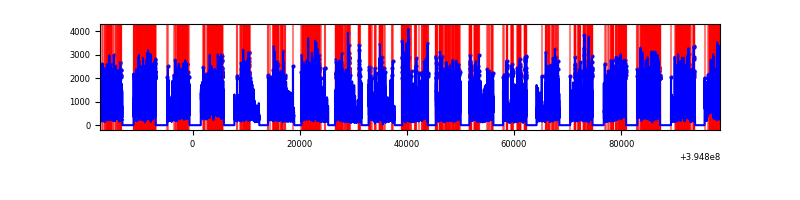 |
Top three noisy pixels from each quadrant. If the there are fewer than three noisy pixels in the level2.evt file, extra rows are filled as -1
| Pixel properties | Quadrant properties | ||||||
|---|---|---|---|---|---|---|---|
| Quadrant | DetID | PixID | Counts | Sigma | Mean | Median | Sigma |
| A | 10 | 83 | 2485917 | 2557.44 | 4449 | 4390 | 970.3 |
| A | 15 | 223 | 1824875 | 1876.17 | 4449 | 4390 | 970.3 |
| A | 13 | 6 | 117233 | 116.29 | 4449 | 4390 | 970.3 |
| B | 5 | 200 | 6618006 | 8123.48 | 4175 | 4091 | 814.2 |
| B | 4 | 171 | 4660896 | 5719.68 | 4175 | 4091 | 814.2 |
| B | 0 | 219 | 748809 | 914.69 | 4175 | 4091 | 814.2 |
| C | 0 | 10 | 3703405 | 3839.76 | 4288 | 4264 | 963.4 |
| C | 15 | 214 | 3312665 | 3434.16 | 4288 | 4264 | 963.4 |
| C | 0 | 207 | 2491552 | 2581.84 | 4288 | 4264 | 963.4 |
| D | 12 | 235 | 35700183 | 36174.55 | 4139 | 4017 | 986.8 |
| D | 12 | 17 | 1611489 | 1629.01 | 4139 | 4017 | 986.8 |
| D | 2 | 250 | 1233568 | 1246.03 | 4139 | 4017 | 986.8 |
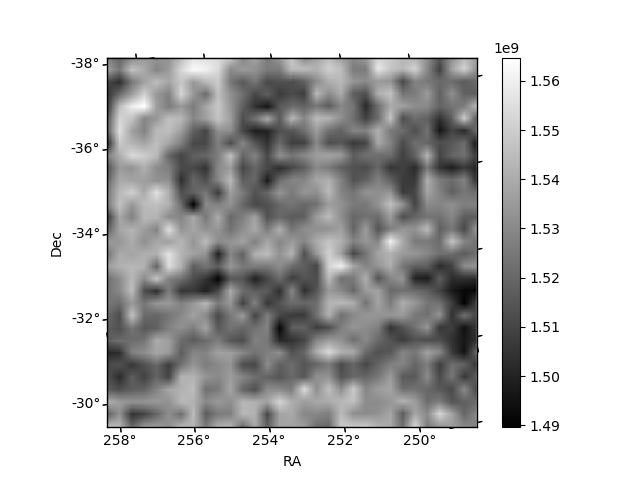
Histogram calculated using DETX and DETY for each event in the final _common_clean file
| Quadrant A | 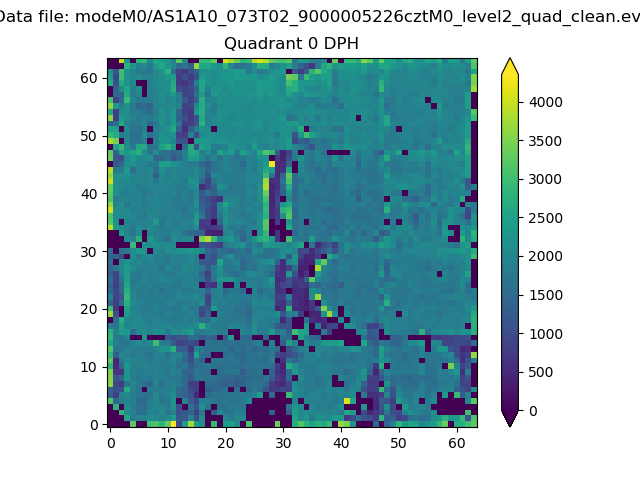 |
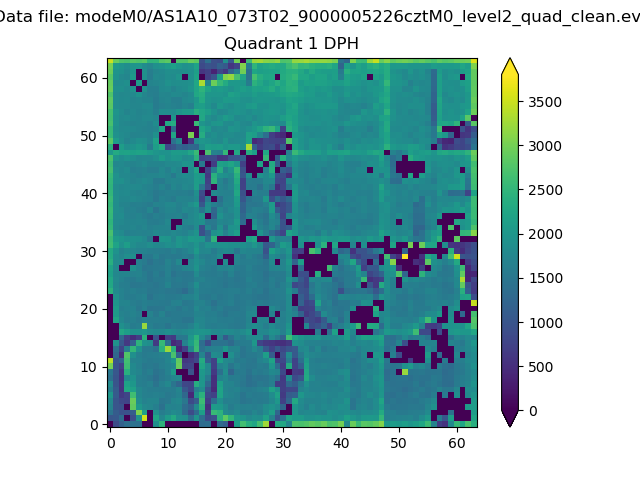 |
Quadrant B |
|---|---|---|---|
| Quadrant D |  |
 |
Quadrant C |
| Plot type | Count rate plots | Images |
|---|---|---|
| Comparison with Poisson distribution Blue bars denote a histogram of data divided into 1 sec bins. Red curve is a Poisson curve with rate = median count rate of data. |
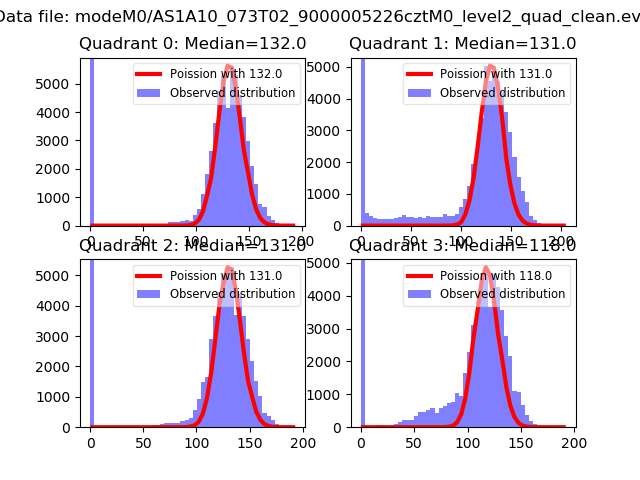 |
 |
| Quadrant-wise count rates Data is divided into 100 sec bins |
 |
|
| Module-wise count rates for Quadrant A Data is divided into 100 sec bins |
 |
 |
| Module-wise count rates for Quadrant B Data is divided into 100 sec bins |
 |
 |
| Module-wise count rates for Quadrant C Data is divided into 100 sec bins |
 |
 |
| Module-wise count rates for Quadrant D Data is divided into 100 sec bins |
 |
 |
| Parameter | Plot |
|---|---|
| CZT HV Monitor |  |
| D_VDD |  |
| Temperature 1 | 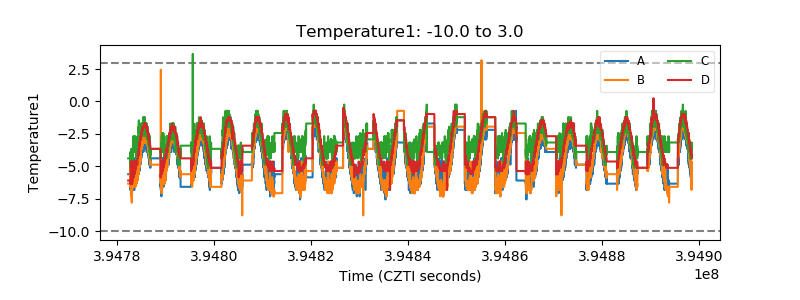 |
| Veto HV Monitor |  |
| Veto LLD |  |
| Alpha Counter |  |
| _CPM_Rate |  |
| CZT Counter |  |
| +2.5 Volts monitor |  |
| +5 Volts monitor |  |
| _ROLL_ROT |  |
| _Roll_DEC |  |
| _Roll_RA |  |
| Veto Counter |  |