| Param | Original file | Final file |
|---|---|---|
| Filename | modeM0/AS1A11_097T24_9000005224cztM0_level2_bc.evt | modeM0/AS1A11_097T24_9000005224cztM0_level2_quad_clean.evt |
| Size (bytes) | 4,190,999,040 | 1,188,783,360 |
| Size | 3.9 GB | 1.1 GB |
| Events in quadrant A | 24,092,218 | 7,560,539 |
| Events in quadrant B | 22,976,254 | 7,615,833 |
| Events in quadrant C | 32,977,524 | 7,174,616 |
| Events in quadrant D | 40,209,520 | 6,933,783 |
| Mode M0 | |||
|---|---|---|---|
| Quadrant | BADHDUFLAG | Total packets | Discarded packets |
| A | 0 | 207557 | 0 |
| B | 0 | 208107 | 0 |
| C | 0 | 236909 | 0 |
| D | 0 | 273327 | 0 |
| Mode M9 | |||
|---|---|---|---|
| Quadrant | BADHDUFLAG | Total packets | Discarded packets |
| A | 0 | 347 | 0 |
| B | 0 | 347 | 0 |
| C | 0 | 347 | 0 |
| D | 0 | 347 | 0 |
| Mode SS | |||
|---|---|---|---|
| Quadrant | BADHDUFLAG | Total packets | Discarded packets |
| A | 0 | 2002 | 0 |
| B | 0 | 2002 | 0 |
| C | 0 | 2002 | 0 |
| D | 0 | 2002 | 0 |
| Quadrant | Total seconds | Saturated seconds | Saturation percentage |
|---|---|---|---|
| A | 98086 | 389 | 0.396591% |
| B | 98084 | 556 | 0.566861% |
| C | 98086 | 2704 | 2.756764% |
| D | 98085 | 3651 | 3.722282% |
Noise dominated data is calculated using 1-second bins in cleaned event files. If a bin has >2000 counts, and if more than 50% of those come from <1% of pixels, then it is considered to be noise-dominated and hence unusable.
| Quadrant | # 1 sec bins | Bins with >0 counts | Bins with >2000 counts | High rate bins dominated by noise | Noise dominated (total time) | Noise dominated (detector-on time) | Marked lightcurve |
|---|---|---|---|---|---|---|---|
| A | 132678 | 98107 | 57 | 57 | 0.04% | 0.06% |  |
| B | 132678 | 98084 | 53 | 53 | 0.04% | 0.05% | 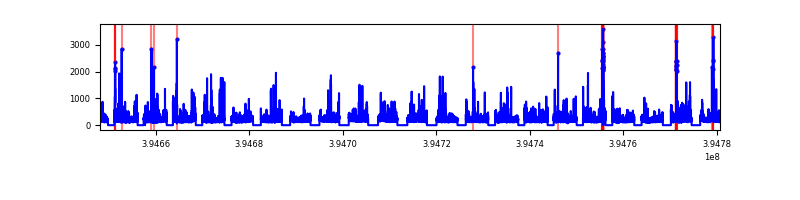 |
| C | 132678 | 98089 | 670 | 670 | 0.50% | 0.68% |  |
| D | 132678 | 98086 | 514 | 514 | 0.39% | 0.52% |  |
Top three noisy pixels from each quadrant. If the there are fewer than three noisy pixels in the level2.evt file, extra rows are filled as -1
| Pixel properties | Quadrant properties | ||||||
|---|---|---|---|---|---|---|---|
| Quadrant | DetID | PixID | Counts | Sigma | Mean | Median | Sigma |
| A | 10 | 83 | 2739090 | 2433.43 | 5118 | 5039 | 1123.5 |
| A | 15 | 223 | 1130383 | 1001.61 | 5118 | 5039 | 1123.5 |
| A | 9 | 143 | 287586 | 251.48 | 5118 | 5039 | 1123.5 |
| B | 0 | 213 | 830370 | 819.01 | 5117 | 5011 | 1007.8 |
| B | 4 | 171 | 508017 | 499.14 | 5117 | 5011 | 1007.8 |
| B | 0 | 190 | 383195 | 375.27 | 5117 | 5011 | 1007.8 |
| C | 15 | 214 | 3907685 | 3549.89 | 4826 | 4792 | 1099.4 |
| C | 0 | 10 | 3769492 | 3424.2 | 4826 | 4792 | 1099.4 |
| C | 0 | 207 | 2852772 | 2590.39 | 4826 | 4792 | 1099.4 |
| D | 12 | 235 | 7940828 | 6892.08 | 4895 | 4751 | 1151.5 |
| D | 2 | 250 | 1980118 | 1715.51 | 4895 | 4751 | 1151.5 |
| D | 2 | 153 | 1524254 | 1319.61 | 4895 | 4751 | 1151.5 |
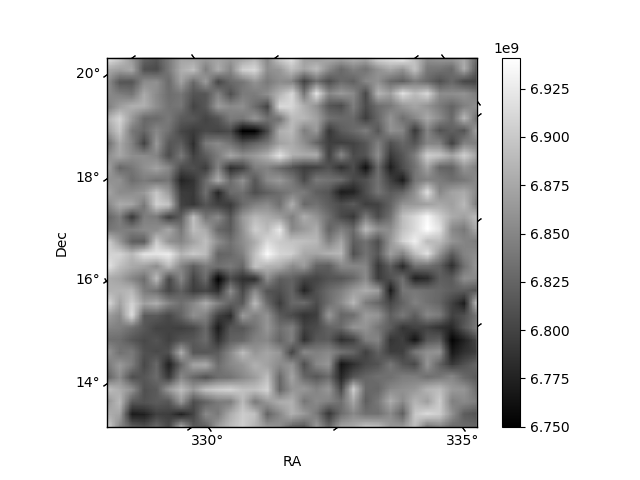
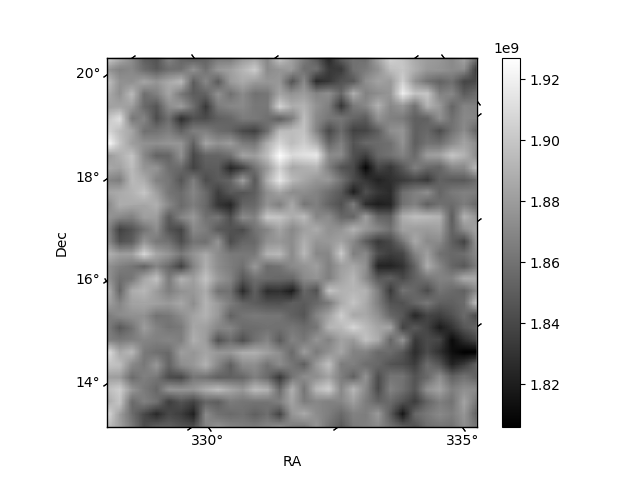
Histogram calculated using DETX and DETY for each event in the final _common_clean file
| Quadrant A | 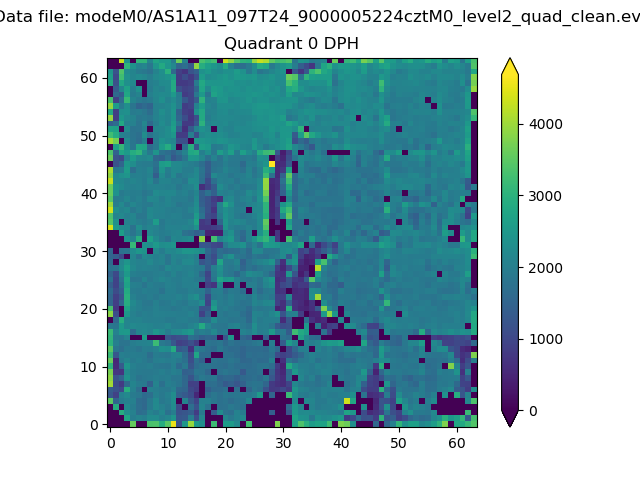 |
 |
Quadrant B |
|---|---|---|---|
| Quadrant D | 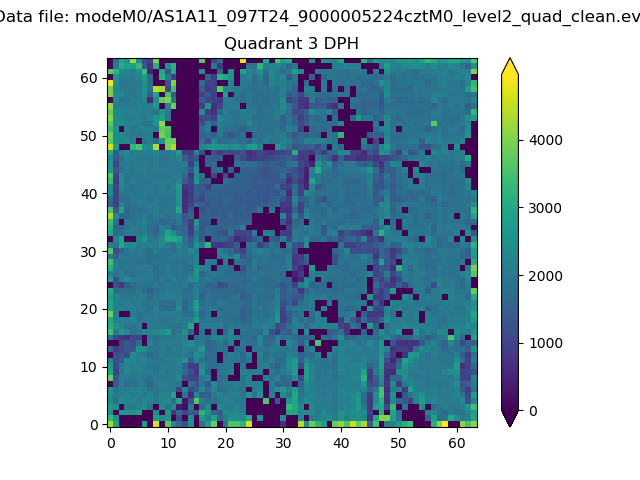 |
 |
Quadrant C |
| Plot type | Count rate plots | Images |
|---|---|---|
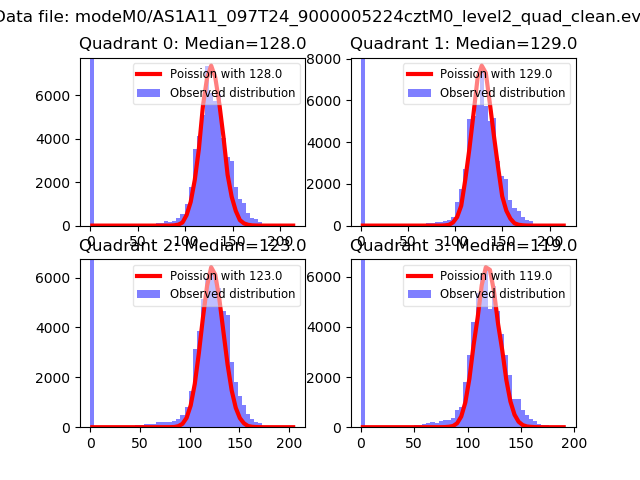
| Comparison with Poisson distribution Blue bars denote a histogram of data divided into 1 sec bins. Red curve is a Poisson curve with rate = median count rate of data. |
 |
 |
| Quadrant-wise count rates Data is divided into 100 sec bins |
 |
|
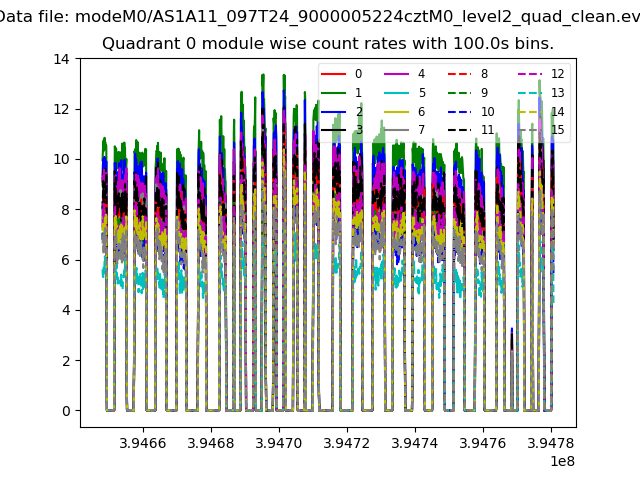
| Module-wise count rates for Quadrant A Data is divided into 100 sec bins |
 |
 |
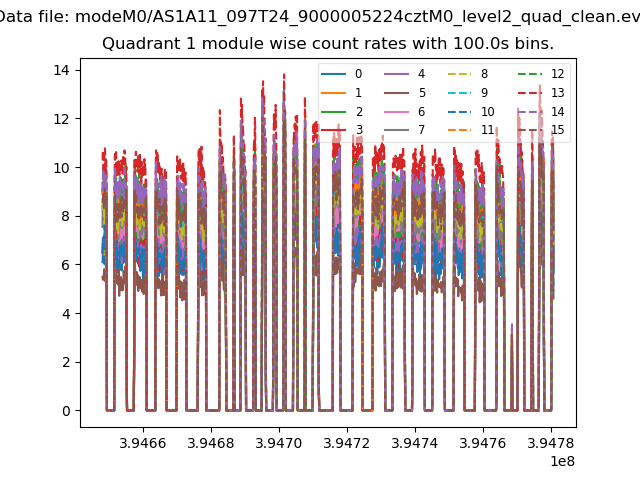
| Module-wise count rates for Quadrant B Data is divided into 100 sec bins |
 |
 |
| Module-wise count rates for Quadrant C Data is divided into 100 sec bins |
 |
 |
| Module-wise count rates for Quadrant D Data is divided into 100 sec bins |
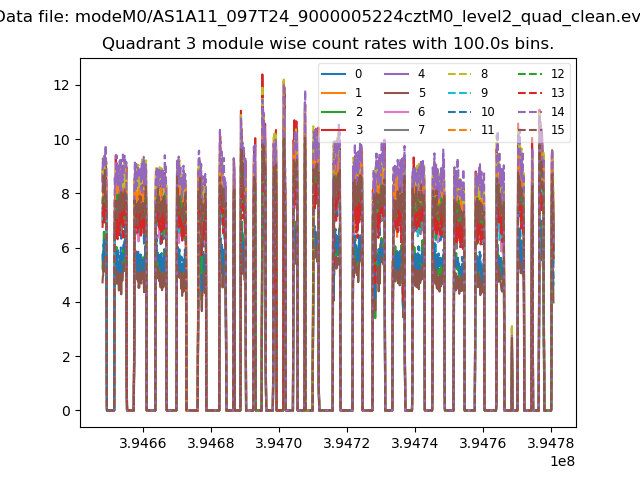 |
 |
| Parameter | Plot |
|---|---|
| CZT HV Monitor |  |
| D_VDD |  |
| Temperature 1 | 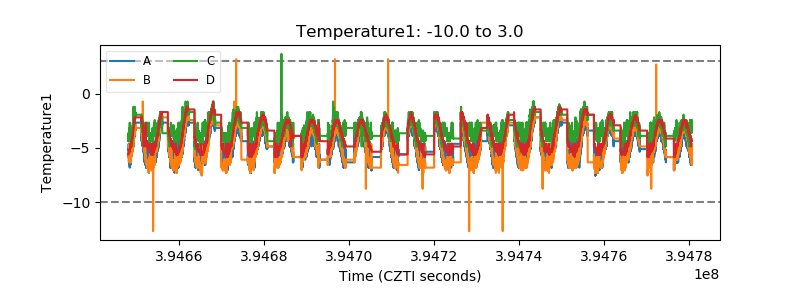 |
| Veto HV Monitor |  |
| Veto LLD |  |
| Alpha Counter |  |
| _CPM_Rate |  |
| CZT Counter |  |
| +2.5 Volts monitor |  |
| +5 Volts monitor |  |
| _ROLL_ROT |  |
| _Roll_DEC | 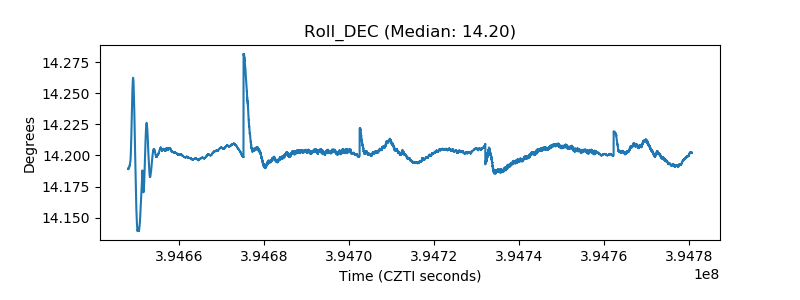 |
| _Roll_RA |  |
| Veto Counter | 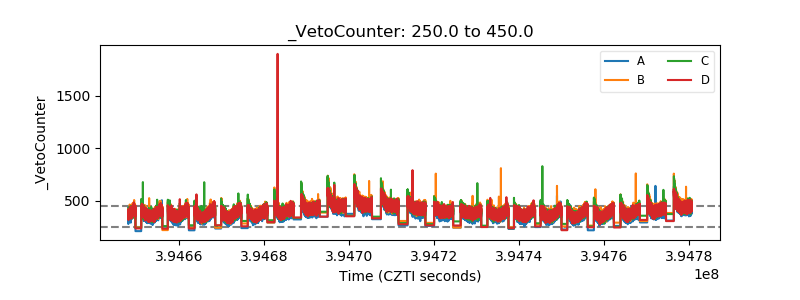 |