| Param | Original file | Final file |
|---|---|---|
| Filename | modeM0/AS1C07_006T01_9000005218cztM0_level2_bc.evt | modeM0/AS1C07_006T01_9000005218cztM0_level2_quad_clean.evt |
| Size (bytes) | 234,740,160 | 60,511,680 |
| Size | 223.9 MB | 57.7 MB |
| Events in quadrant A | 1,222,280 | 381,192 |
| Events in quadrant B | 1,421,302 | 377,998 |
| Events in quadrant C | 1,530,847 | 368,417 |
| Events in quadrant D | 2,586,394 | 353,212 |
| Mode M0 | |||
|---|---|---|---|
| Quadrant | BADHDUFLAG | Total packets | Discarded packets |
| A | 0 | 10595 | 0 |
| B | 0 | 11519 | 0 |
| C | 0 | 11558 | 0 |
| D | 0 | 16045 | 0 |
| Mode SS | |||
|---|---|---|---|
| Quadrant | BADHDUFLAG | Total packets | Discarded packets |
| A | 0 | 102 | 0 |
| B | 0 | 102 | 0 |
| C | 0 | 102 | 0 |
| D | 0 | 102 | 0 |
| Mode M9 | |||
|---|---|---|---|
| Quadrant | BADHDUFLAG | Total packets | Discarded packets |
| A | 0 | 20 | 0 |
| B | 0 | 20 | 0 |
| C | 0 | 20 | 0 |
| D | 0 | 20 | 0 |
| Quadrant | Total seconds | Saturated seconds | Saturation percentage |
|---|---|---|---|
| A | 5011 | 26 | 0.518859% |
| B | 5011 | 44 | 0.878068% |
| C | 5011 | 126 | 2.514468% |
| D | 5011 | 136 | 2.714029% |
Noise dominated data is calculated using 1-second bins in cleaned event files. If a bin has >2000 counts, and if more than 50% of those come from <1% of pixels, then it is considered to be noise-dominated and hence unusable.
| Quadrant | # 1 sec bins | Bins with >0 counts | Bins with >2000 counts | High rate bins dominated by noise | Noise dominated (total time) | Noise dominated (detector-on time) | Marked lightcurve |
|---|---|---|---|---|---|---|---|
| A | 6985 | 5012 | 4 | 4 | 0.06% | 0.08% |  |
| B | 6985 | 5011 | 4 | 4 | 0.06% | 0.08% | 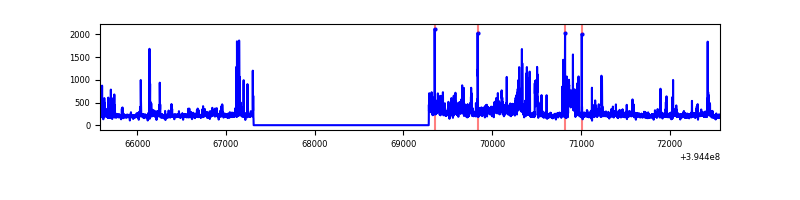 |
| C | 6985 | 5011 | 13 | 13 | 0.19% | 0.26% |  |
| D | 6985 | 5011 | 24 | 24 | 0.34% | 0.48% |  |
Top three noisy pixels from each quadrant. If the there are fewer than three noisy pixels in the level2.evt file, extra rows are filled as -1
| Pixel properties | Quadrant properties | ||||||
|---|---|---|---|---|---|---|---|
| Quadrant | DetID | PixID | Counts | Sigma | Mean | Median | Sigma |
| A | 10 | 83 | 145666 | 2497.29 | 250 | 246 | 58.2 |
| A | 15 | 223 | 85764 | 1468.6 | 250 | 246 | 58.2 |
| A | 9 | 143 | 13745 | 231.82 | 250 | 246 | 58.2 |
| B | 5 | 255 | 113510 | 2172.39 | 249 | 244 | 52.1 |
| B | 0 | 213 | 85722 | 1639.43 | 249 | 244 | 52.1 |
| B | 0 | 219 | 68069 | 1300.85 | 249 | 244 | 52.1 |
| C | 0 | 10 | 319380 | 5454.93 | 243 | 241 | 58.5 |
| C | 15 | 214 | 198232 | 3384.19 | 243 | 241 | 58.5 |
| C | 14 | 254 | 37105 | 630.1 | 243 | 241 | 58.5 |
| D | 12 | 235 | 1062934 | 17332.17 | 245 | 237 | 61.3 |
| D | 13 | 249 | 160584 | 2615.2 | 245 | 237 | 61.3 |
| D | 2 | 250 | 70388 | 1144.14 | 245 | 237 | 61.3 |
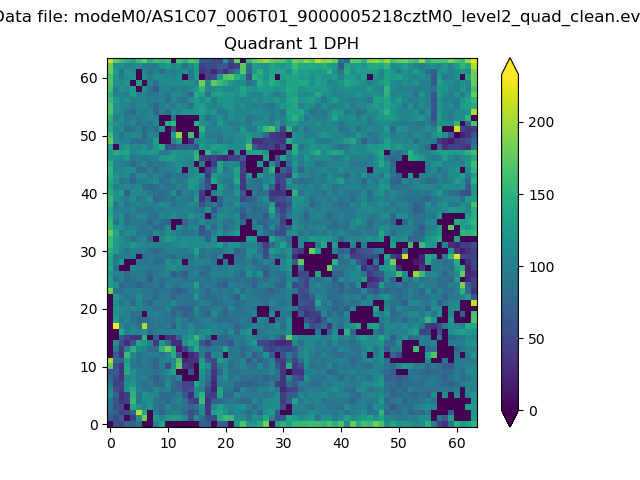
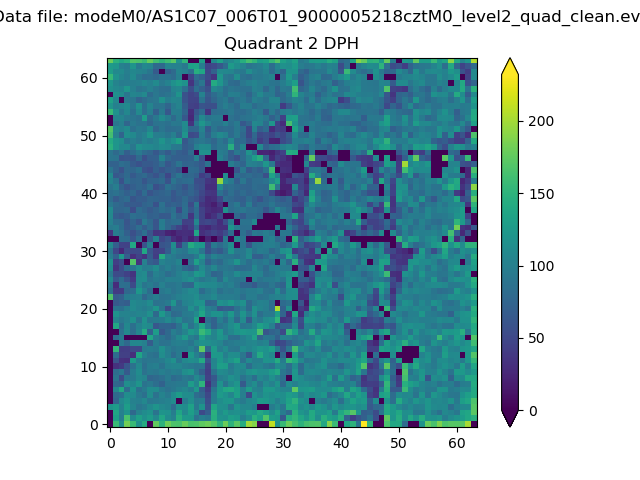
Histogram calculated using DETX and DETY for each event in the final _common_clean file
| Quadrant A |  |
 |
Quadrant B |
|---|---|---|---|
| Quadrant D |  |
 |
Quadrant C |
| Plot type | Count rate plots | Images |
|---|---|---|
| Comparison with Poisson distribution Blue bars denote a histogram of data divided into 1 sec bins. Red curve is a Poisson curve with rate = median count rate of data. |
 |
 |
| Quadrant-wise count rates Data is divided into 100 sec bins |
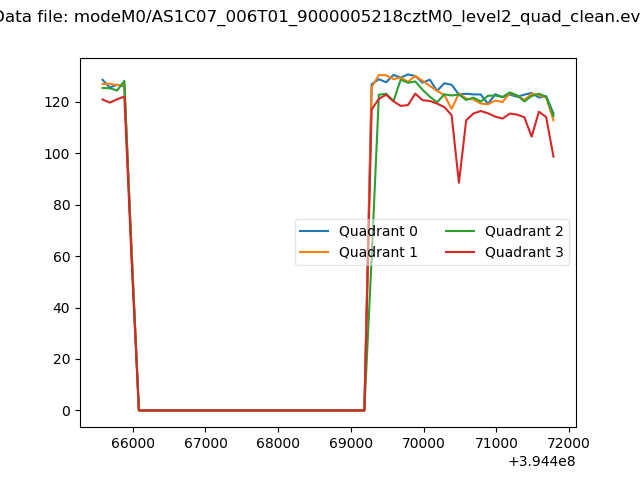 |
|
| Module-wise count rates for Quadrant A Data is divided into 100 sec bins |
 |
 |
| Module-wise count rates for Quadrant B Data is divided into 100 sec bins |
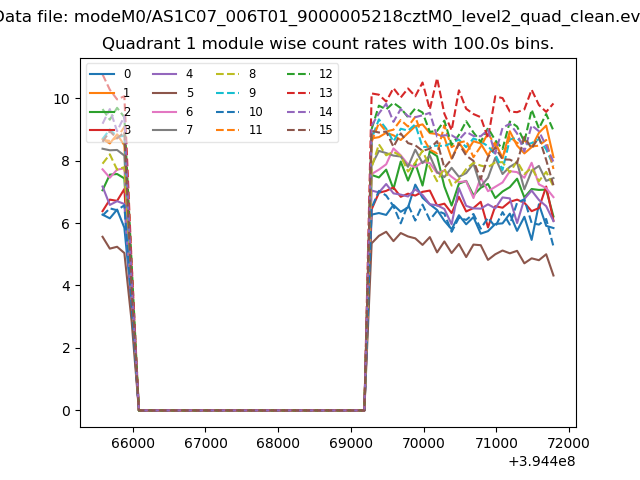 |
 |
| Module-wise count rates for Quadrant C Data is divided into 100 sec bins |
 |
 |
| Module-wise count rates for Quadrant D Data is divided into 100 sec bins |
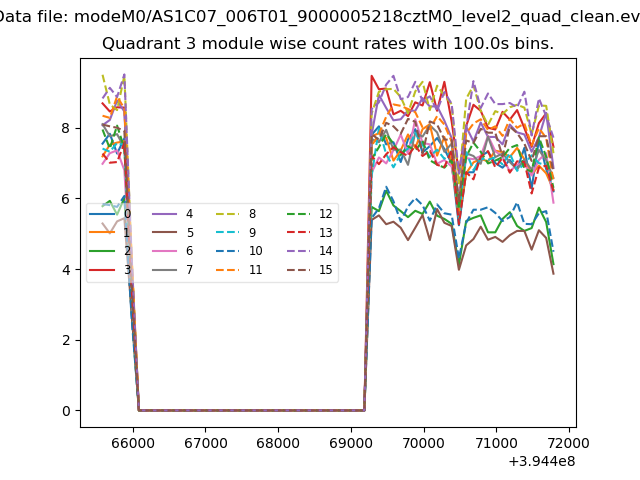 |
 |
| Parameter | Plot |
|---|---|
| CZT HV Monitor |  |
| D_VDD | 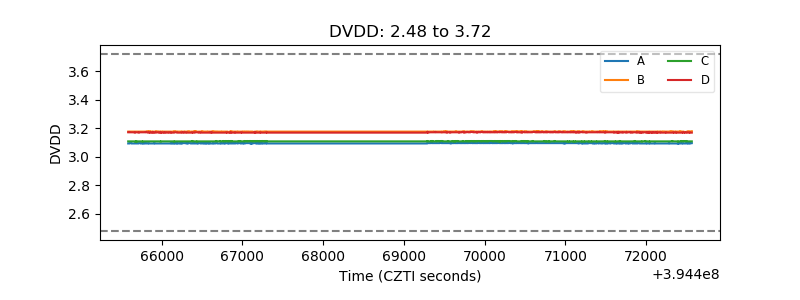 |
| Temperature 1 | 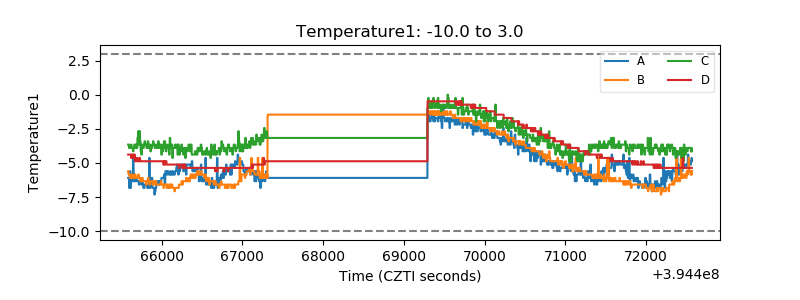 |
| Veto HV Monitor |  |
| Veto LLD |  |
| Alpha Counter |  |
| _CPM_Rate | 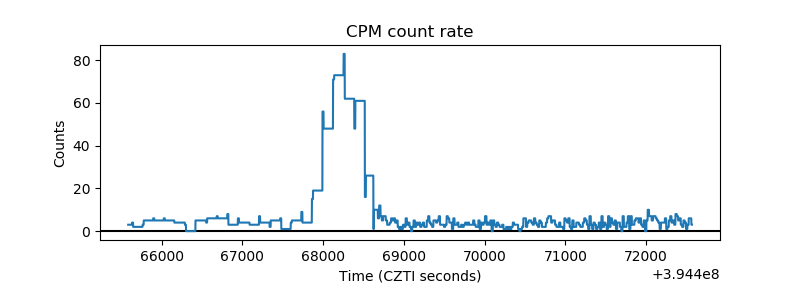 |
| CZT Counter |  |
| +2.5 Volts monitor |  |
| +5 Volts monitor |  |
| _ROLL_ROT |  |
| _Roll_DEC |  |
| _Roll_RA | 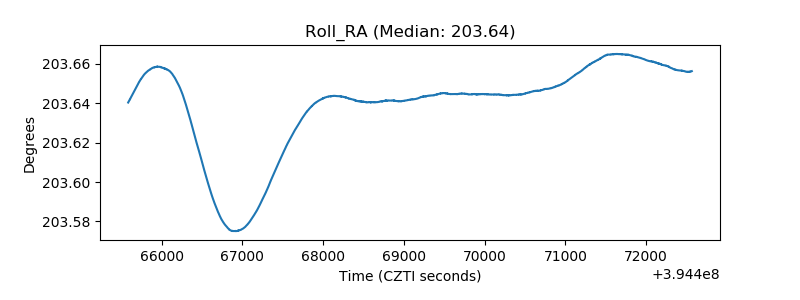 |
| Veto Counter |  |