| Param | Original file | Final file |
|---|---|---|
| Filename | modeM0/AS1A11_049T02_9000005220cztM0_level2_bc.evt | modeM0/AS1A11_049T02_9000005220cztM0_level2_quad_clean.evt |
| Size (bytes) | 2,097,849,600 | 644,849,280 |
| Size | 2.0 GB | 615.0 MB |
| Events in quadrant A | 13,145,825 | 4,124,525 |
| Events in quadrant B | 15,368,859 | 4,103,974 |
| Events in quadrant C | 14,092,306 | 4,054,334 |
| Events in quadrant D | 17,559,453 | 3,855,929 |
| Mode M9 | |||
|---|---|---|---|
| Quadrant | BADHDUFLAG | Total packets | Discarded packets |
| A | 0 | 180 | 0 |
| B | 0 | 180 | 0 |
| C | 0 | 180 | 0 |
| D | 0 | 180 | 0 |
| Mode M0 | |||
|---|---|---|---|
| Quadrant | BADHDUFLAG | Total packets | Discarded packets |
| A | 0 | 109873 | 0 |
| B | 0 | 119755 | 0 |
| C | 0 | 109872 | 0 |
| D | 0 | 129231 | 0 |
| Mode SS | |||
|---|---|---|---|
| Quadrant | BADHDUFLAG | Total packets | Discarded packets |
| A | 0 | 1012 | 0 |
| B | 0 | 1012 | 0 |
| C | 0 | 1012 | 0 |
| D | 0 | 1012 | 0 |
| Quadrant | Total seconds | Saturated seconds | Saturation percentage |
|---|---|---|---|
| A | 49438 | 605 | 1.223755% |
| B | 49438 | 1392 | 2.815648% |
| C | 49438 | 797 | 1.612120% |
| D | 49438 | 1486 | 3.005785% |
Noise dominated data is calculated using 1-second bins in cleaned event files. If a bin has >2000 counts, and if more than 50% of those come from <1% of pixels, then it is considered to be noise-dominated and hence unusable.
| Quadrant | # 1 sec bins | Bins with >0 counts | Bins with >2000 counts | High rate bins dominated by noise | Noise dominated (total time) | Noise dominated (detector-on time) | Marked lightcurve |
|---|---|---|---|---|---|---|---|
| A | 67449 | 49449 | 36 | 36 | 0.05% | 0.07% |  |
| B | 67449 | 49438 | 128 | 128 | 0.19% | 0.26% | 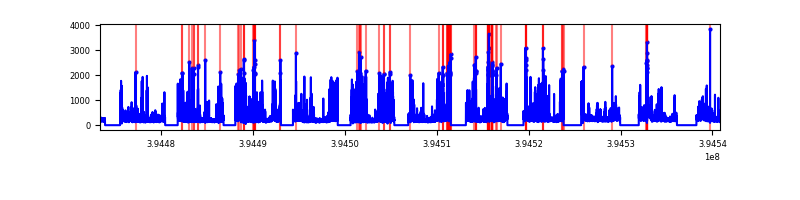 |
| C | 67449 | 49438 | 144 | 144 | 0.21% | 0.29% |  |
| D | 67449 | 49435 | 115 | 115 | 0.17% | 0.23% | 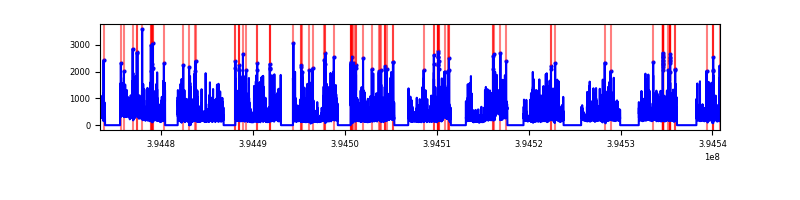 |
Top three noisy pixels from each quadrant. If the there are fewer than three noisy pixels in the level2.evt file, extra rows are filled as -1
| Pixel properties | Quadrant properties | ||||||
|---|---|---|---|---|---|---|---|
| Quadrant | DetID | PixID | Counts | Sigma | Mean | Median | Sigma |
| A | 10 | 83 | 1434216 | 2496.94 | 2603 | 2564 | 573.4 |
| A | 15 | 223 | 1260550 | 2194.05 | 2603 | 2564 | 573.4 |
| A | 9 | 143 | 200749 | 345.65 | 2603 | 2564 | 573.4 |
| B | 5 | 172 | 2732661 | 5361.03 | 2584 | 2530 | 509.3 |
| B | 5 | 255 | 1096090 | 2147.37 | 2584 | 2530 | 509.3 |
| B | 0 | 182 | 336413 | 655.63 | 2584 | 2530 | 509.3 |
| C | 15 | 214 | 1978767 | 3505.46 | 2503 | 2486 | 563.8 |
| C | 0 | 10 | 1708519 | 3026.1 | 2503 | 2486 | 563.8 |
| C | 14 | 254 | 353475 | 622.57 | 2503 | 2486 | 563.8 |
| D | 2 | 250 | 1625703 | 2757.02 | 2519 | 2452 | 588.8 |
| D | 12 | 235 | 1204697 | 2041.96 | 2519 | 2452 | 588.8 |
| D | 1 | 20 | 655651 | 1109.43 | 2519 | 2452 | 588.8 |
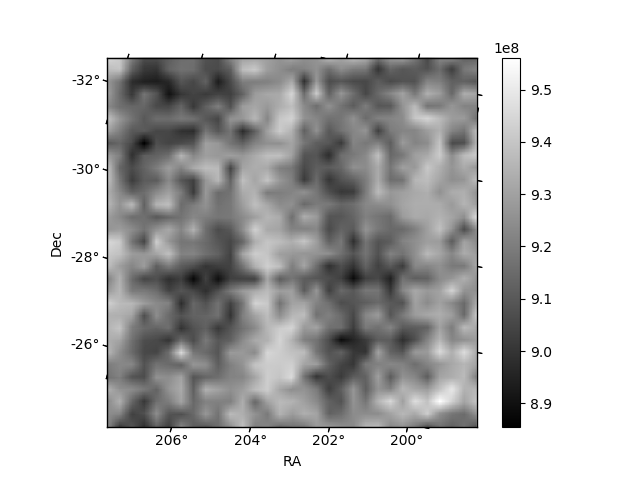
Histogram calculated using DETX and DETY for each event in the final _common_clean file
| Quadrant A |  |
 |
Quadrant B |
|---|---|---|---|
| Quadrant D |  |
 |
Quadrant C |
| Plot type | Count rate plots | Images |
|---|---|---|
| Comparison with Poisson distribution Blue bars denote a histogram of data divided into 1 sec bins. Red curve is a Poisson curve with rate = median count rate of data. |
 |
 |
| Quadrant-wise count rates Data is divided into 100 sec bins |
 |
|
| Module-wise count rates for Quadrant A Data is divided into 100 sec bins |
 |
 |
| Module-wise count rates for Quadrant B Data is divided into 100 sec bins |
 |
 |
| Module-wise count rates for Quadrant C Data is divided into 100 sec bins |
 |
 |
| Module-wise count rates for Quadrant D Data is divided into 100 sec bins |
 |
 |
| Parameter | Plot |
|---|---|
| CZT HV Monitor |  |
| D_VDD |  |
| Temperature 1 | 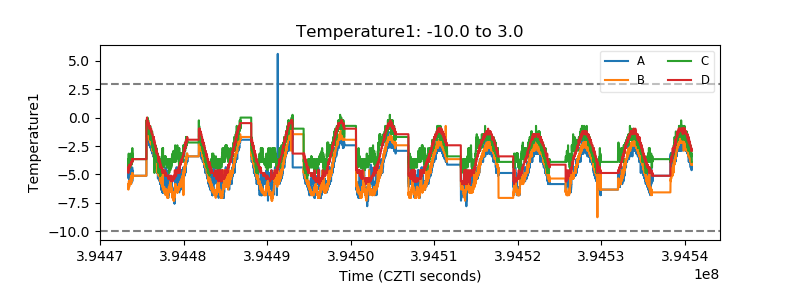 |
| Veto HV Monitor |  |
| Veto LLD | 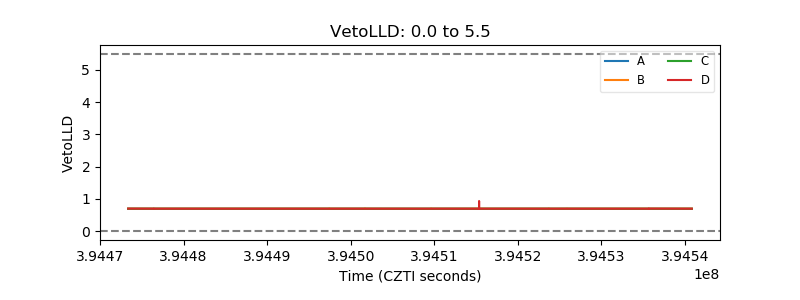 |
| Alpha Counter |  |
| _CPM_Rate | 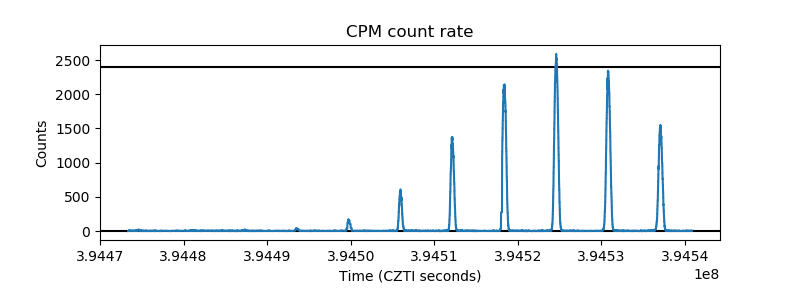 |
| CZT Counter |  |
| +2.5 Volts monitor | 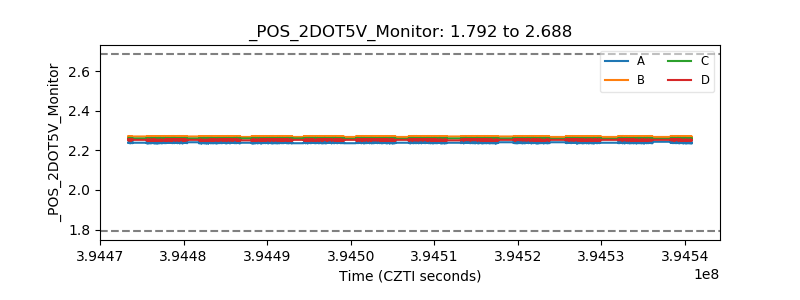 |
| +5 Volts monitor |  |
| _ROLL_ROT |  |
| _Roll_DEC |  |
| _Roll_RA |  |
| Veto Counter |  |