| Param | Original file | Final file |
|---|---|---|
| Filename | modeM0/AS1A11_089T02_9000005216cztM0_level2_bc.evt | modeM0/AS1A11_089T02_9000005216cztM0_level2_quad_clean.evt |
| Size (bytes) | 5,940,106,560 | 1,743,206,400 |
| Size | 5.5 GB | 1.6 GB |
| Events in quadrant A | 33,444,239 | 11,380,014 |
| Events in quadrant B | 37,577,597 | 11,273,142 |
| Events in quadrant C | 42,303,621 | 10,923,718 |
| Events in quadrant D | 57,722,706 | 10,300,756 |
| Mode M9 | |||
|---|---|---|---|
| Quadrant | BADHDUFLAG | Total packets | Discarded packets |
| A | 0 | 507 | 0 |
| B | 0 | 507 | 0 |
| C | 0 | 507 | 0 |
| D | 0 | 507 | 0 |
| Mode M0 | |||
|---|---|---|---|
| Quadrant | BADHDUFLAG | Total packets | Discarded packets |
| A | 0 | 281751 | 0 |
| B | 0 | 302797 | 0 |
| C | 0 | 310502 | 0 |
| D | 0 | 373285 | 0 |
| Mode SS | |||
|---|---|---|---|
| Quadrant | BADHDUFLAG | Total packets | Discarded packets |
| A | 0 | 2664 | 0 |
| B | 0 | 2664 | 0 |
| C | 0 | 2664 | 0 |
| D | 0 | 2664 | 0 |
| Quadrant | Total seconds | Saturated seconds | Saturation percentage |
|---|---|---|---|
| A | 130223 | 856 | 0.657334% |
| B | 130223 | 1917 | 1.472090% |
| C | 130223 | 3592 | 2.758345% |
| D | 130223 | 6210 | 4.768743% |
Noise dominated data is calculated using 1-second bins in cleaned event files. If a bin has >2000 counts, and if more than 50% of those come from <1% of pixels, then it is considered to be noise-dominated and hence unusable.
| Quadrant | # 1 sec bins | Bins with >0 counts | Bins with >2000 counts | High rate bins dominated by noise | Noise dominated (total time) | Noise dominated (detector-on time) | Marked lightcurve |
|---|---|---|---|---|---|---|---|
| A | 180931 | 130252 | 90 | 90 | 0.05% | 0.07% | 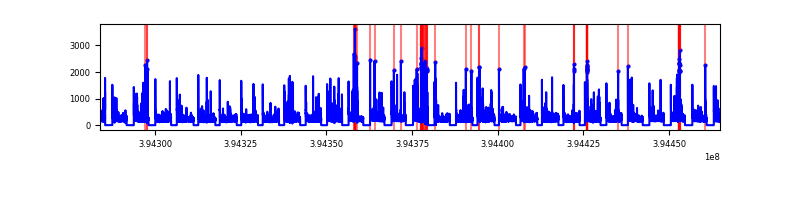 |
| B | 180930 | 130225 | 195 | 195 | 0.11% | 0.15% |  |
| C | 180931 | 130228 | 548 | 548 | 0.30% | 0.42% | 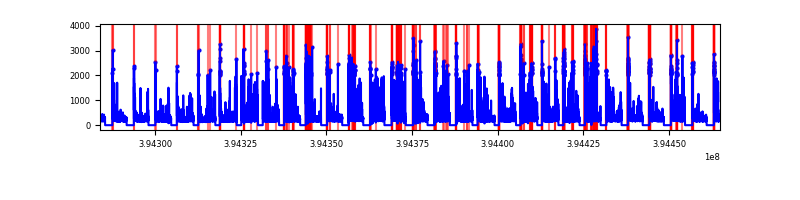 |
| D | 180931 | 130224 | 2118 | 2118 | 1.17% | 1.63% |  |
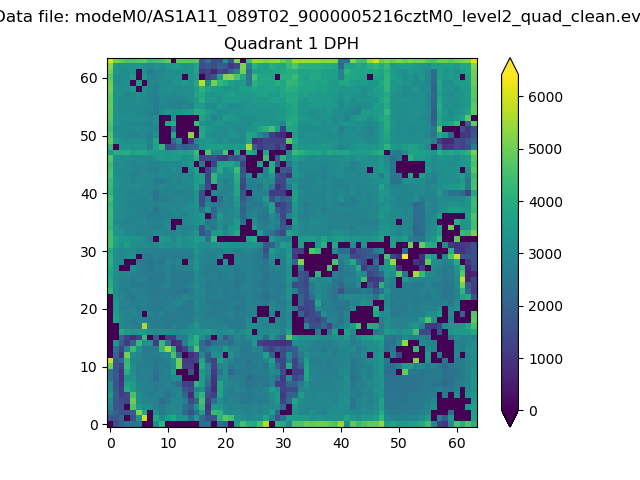
Top three noisy pixels from each quadrant. If the there are fewer than three noisy pixels in the level2.evt file, extra rows are filled as -1
| Pixel properties | Quadrant properties | ||||||
|---|---|---|---|---|---|---|---|
| Quadrant | DetID | PixID | Counts | Sigma | Mean | Median | Sigma |
| A | 10 | 83 | 3818789 | 2521.06 | 6895 | 6796 | 1512.1 |
| A | 15 | 223 | 2174229 | 1433.43 | 6895 | 6796 | 1512.1 |
| A | 9 | 143 | 440201 | 286.63 | 6895 | 6796 | 1512.1 |
| B | 5 | 172 | 3294296 | 2438.8 | 6857 | 6711 | 1348.0 |
| B | 5 | 255 | 3072016 | 2273.91 | 6857 | 6711 | 1348.0 |
| B | 0 | 189 | 1187793 | 876.15 | 6857 | 6711 | 1348.0 |
| C | 0 | 10 | 6059823 | 4087.72 | 6536 | 6501 | 1480.9 |
| C | 15 | 214 | 5228344 | 3526.23 | 6536 | 6501 | 1480.9 |
| C | 14 | 254 | 3263626 | 2199.49 | 6536 | 6501 | 1480.9 |
| D | 12 | 235 | 10145605 | 6553.55 | 6605 | 6423 | 1547.1 |
| D | 13 | 249 | 3529776 | 2277.35 | 6605 | 6423 | 1547.1 |
| D | 12 | 227 | 2978037 | 1920.73 | 6605 | 6423 | 1547.1 |
Histogram calculated using DETX and DETY for each event in the final _common_clean file
| Quadrant A | 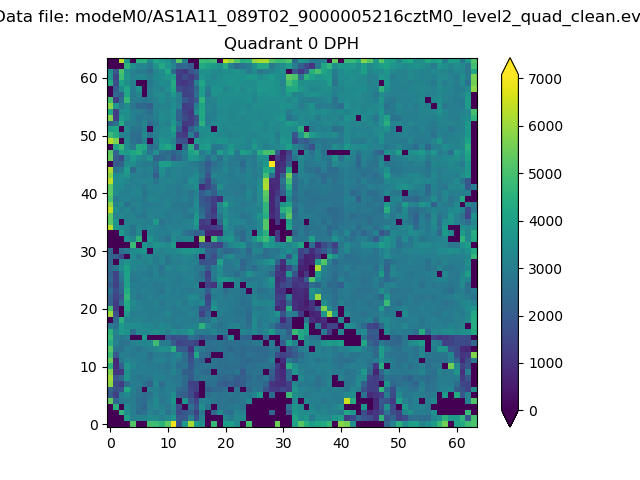 |
 |
Quadrant B |
|---|---|---|---|
| Quadrant D |  |
 |
Quadrant C |
| Plot type | Count rate plots | Images |
|---|---|---|
| Comparison with Poisson distribution Blue bars denote a histogram of data divided into 1 sec bins. Red curve is a Poisson curve with rate = median count rate of data. |
 |
 |
| Quadrant-wise count rates Data is divided into 100 sec bins |
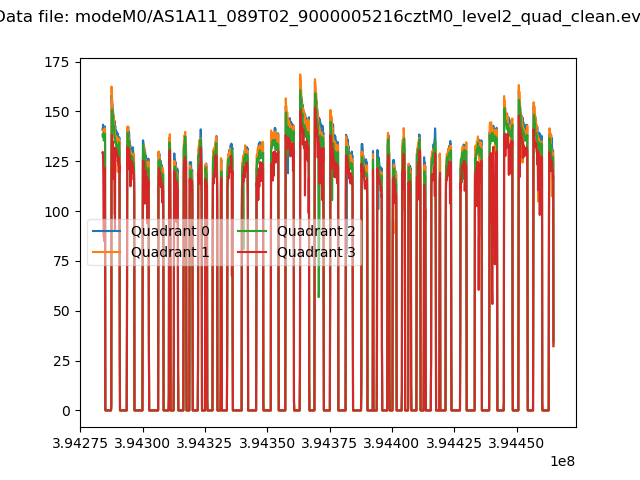 |
|
| Module-wise count rates for Quadrant A Data is divided into 100 sec bins |
 |
 |
| Module-wise count rates for Quadrant B Data is divided into 100 sec bins |
 |
 |
| Module-wise count rates for Quadrant C Data is divided into 100 sec bins |
 |
 |
| Module-wise count rates for Quadrant D Data is divided into 100 sec bins |
 |
 |
| Parameter | Plot |
|---|---|
| CZT HV Monitor |  |
| D_VDD |  |
| Temperature 1 |  |
| Veto HV Monitor |  |
| Veto LLD |  |
| Alpha Counter |  |
| _CPM_Rate |  |
| CZT Counter | 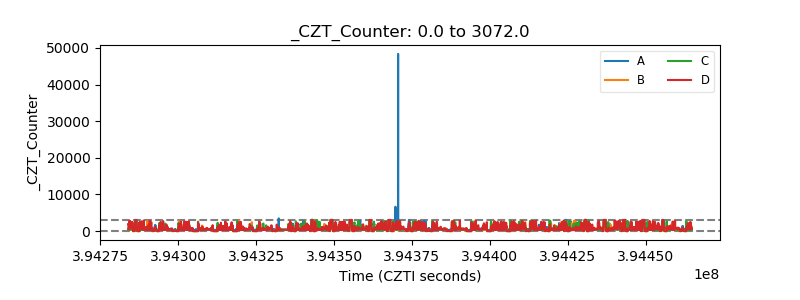 |
| +2.5 Volts monitor |  |
| +5 Volts monitor |  |
| _ROLL_ROT |  |
| _Roll_DEC |  |
| _Roll_RA |  |
| Veto Counter |  |