| Param | Original file | Final file |
|---|---|---|
| Filename | modeM0/AS1T05_035T01_9000005214_36516cztM0_level2.evt | modeM0/AS1T05_035T01_9000005214_36516cztM0_level2_quad_clean.evt |
| Size (bytes) | 428,100,480 | 59,169,600 |
| Size | 408.3 MB | 56.4 MB |
| Events in quadrant A | 2,817,210 | 357,782 |
| Events in quadrant B | 3,188,051 | 358,198 |
| Events in quadrant C | 2,916,051 | 350,634 |
| Events in quadrant D | 3,662,562 | 332,335 |
| Mode M0 | |||
|---|---|---|---|
| Quadrant | BADHDUFLAG | Total packets | Discarded packets |
| A | 0 | 11880 | 3 |
| B | 0 | 13126 | 2 |
| C | 0 | 11984 | 2 |
| D | 0 | 14757 | 2 |
| Mode SS | |||
|---|---|---|---|
| Quadrant | BADHDUFLAG | Total packets | Discarded packets |
| A | 0 | 114 | 0 |
| B | 0 | 114 | 0 |
| C | 0 | 114 | 0 |
| D | 0 | 114 | 0 |
| Mode M9 | |||
|---|---|---|---|
| Quadrant | BADHDUFLAG | Total packets | Discarded packets |
| A | 0 | 24 | 0 |
| B | 0 | 24 | 0 |
| C | 0 | 24 | 0 |
| D | 0 | 25 | 0 |
| Quadrant | Total seconds | Saturated seconds | Saturation percentage |
|---|---|---|---|
| A | 5609 | 25 | 0.445712% |
| B | 5609 | 103 | 1.836334% |
| C | 5609 | 52 | 0.927081% |
| D | 5609 | 262 | 4.671064% |
Noise dominated data is calculated using 1-second bins in cleaned event files. If a bin has >2000 counts, and if more than 50% of those come from <1% of pixels, then it is considered to be noise-dominated and hence unusable.
| Quadrant | # 1 sec bins | Bins with >0 counts | Bins with >2000 counts | High rate bins dominated by noise | Noise dominated (total time) | Noise dominated (detector-on time) | Marked lightcurve |
|---|---|---|---|---|---|---|---|
| A | 7162 | 5610 | 16 | 16 | 0.22% | 0.29% | 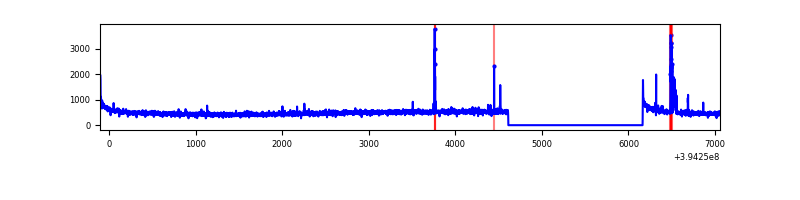 |
| B | 7162 | 5610 | 62 | 62 | 0.87% | 1.11% | 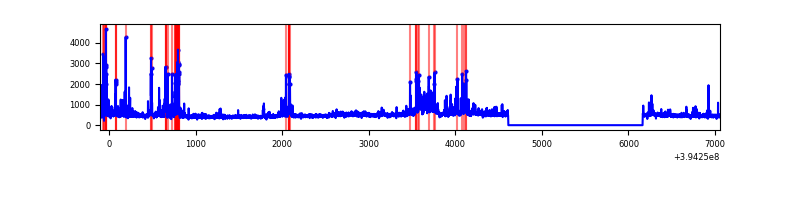 |
| C | 7162 | 5610 | 42 | 42 | 0.59% | 0.75% | 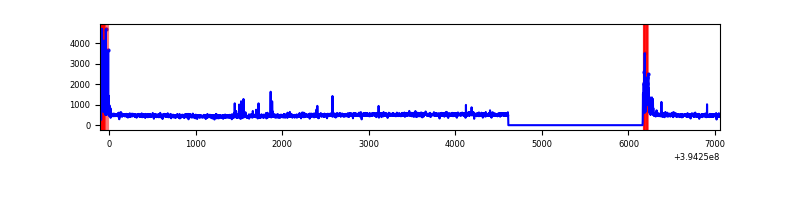 |
| D | 7162 | 5610 | 216 | 216 | 3.02% | 3.85% | 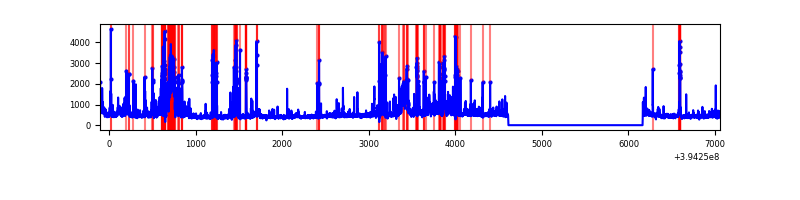 |
Top three noisy pixels from each quadrant. If the there are fewer than three noisy pixels in the level2.evt file, extra rows are filled as -1
| Pixel properties | Quadrant properties | ||||||
|---|---|---|---|---|---|---|---|
| Quadrant | DetID | PixID | Counts | Sigma | Mean | Median | Sigma |
| A | 10 | 83 | 200537 | 1513.72 | 650 | 637 | 132.1 |
| A | 9 | 143 | 71195 | 534.29 | 650 | 637 | 132.1 |
| A | 15 | 223 | 21061 | 154.66 | 650 | 637 | 132.1 |
| B | 5 | 172 | 211776 | 1707.73 | 642 | 625 | 123.6 |
| B | 5 | 255 | 199310 | 1606.91 | 642 | 625 | 123.6 |
| B | 0 | 189 | 71338 | 571.91 | 642 | 625 | 123.6 |
| C | 15 | 214 | 236482 | 1623.65 | 624 | 631 | 145.3 |
| C | 0 | 10 | 218089 | 1497.02 | 624 | 631 | 145.3 |
| C | 12 | 249 | 23899 | 160.18 | 624 | 631 | 145.3 |
| D | 13 | 249 | 691154 | 4516.4 | 616 | 598 | 152.9 |
| D | 13 | 171 | 164488 | 1071.88 | 616 | 598 | 152.9 |
| D | 2 | 250 | 71973 | 466.81 | 616 | 598 | 152.9 |
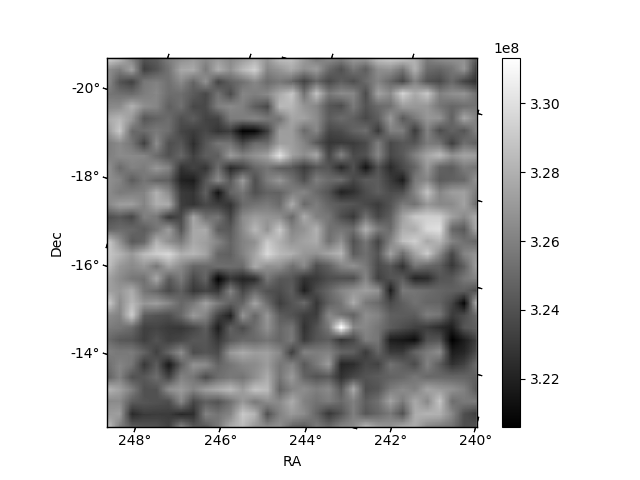
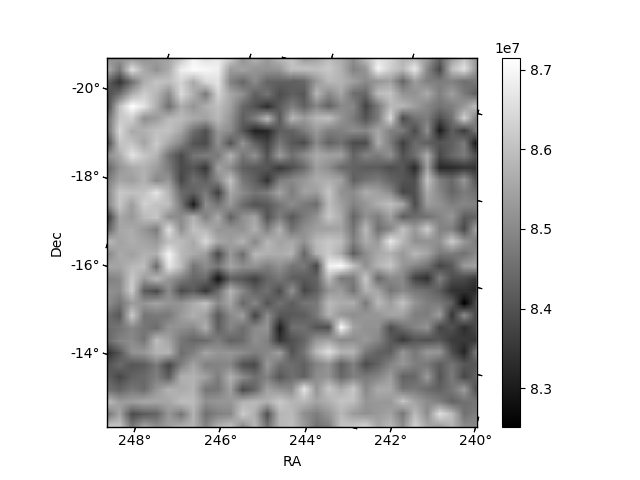
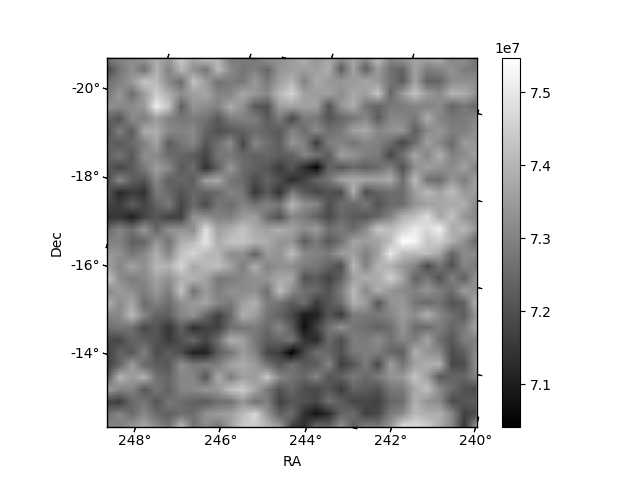
Histogram calculated using DETX and DETY for each event in the final _common_clean file
| Quadrant A | 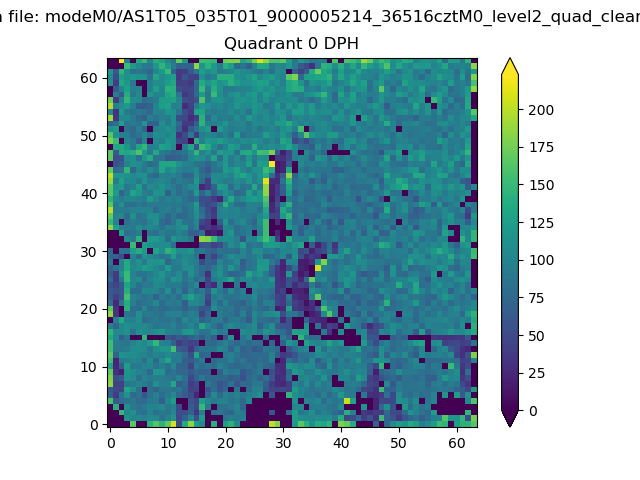 |
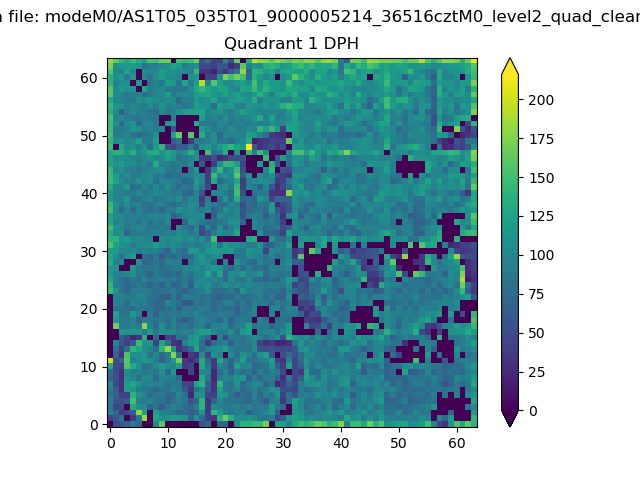 |
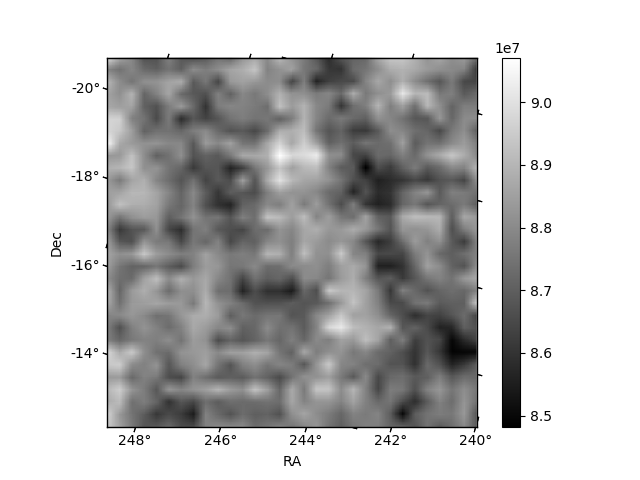
Quadrant B |
|---|---|---|---|
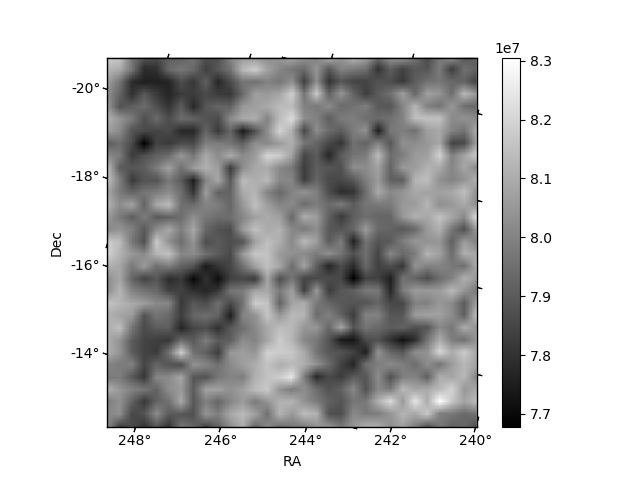
| Quadrant D | 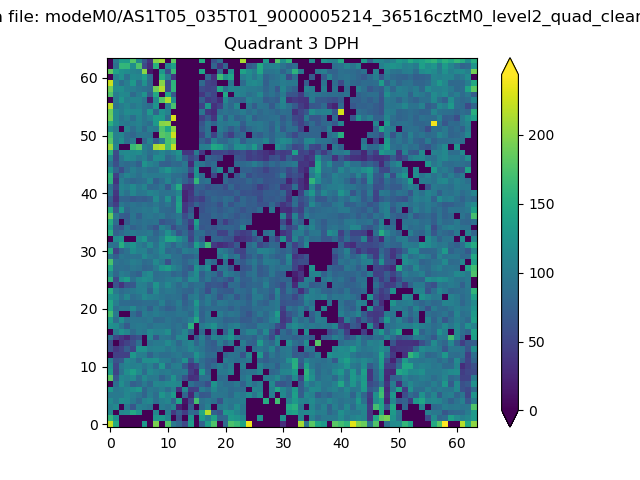 |
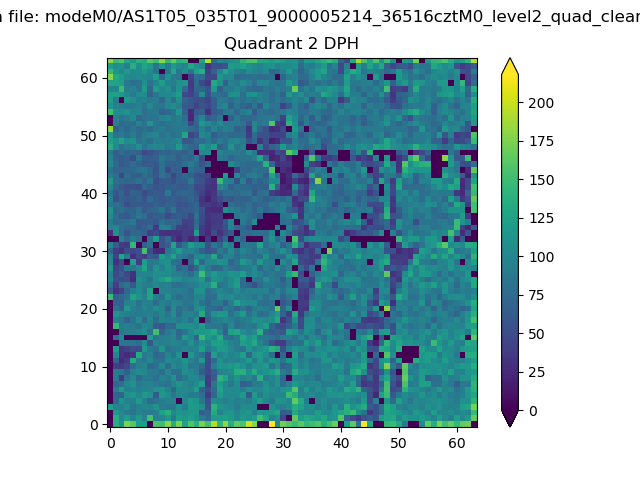 |
Quadrant C |
| Plot type | Count rate plots | Images |
|---|---|---|
| Comparison with Poisson distribution Blue bars denote a histogram of data divided into 1 sec bins. Red curve is a Poisson curve with rate = median count rate of data. |
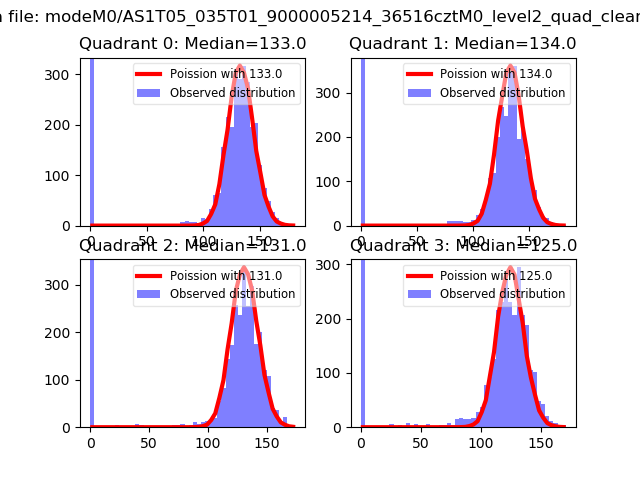 |
 |
| Quadrant-wise count rates Data is divided into 100 sec bins |
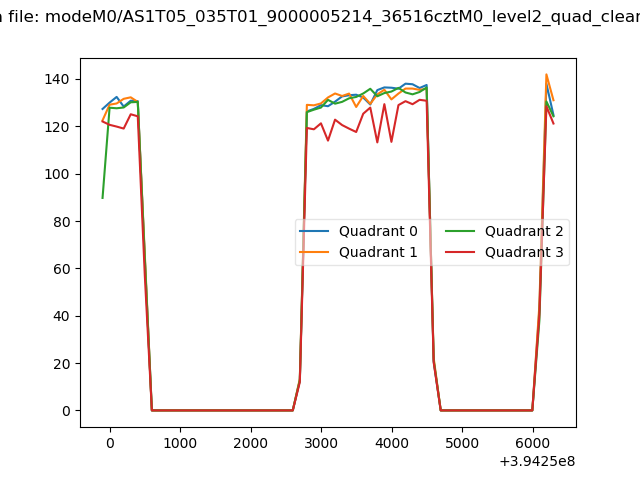 |
|
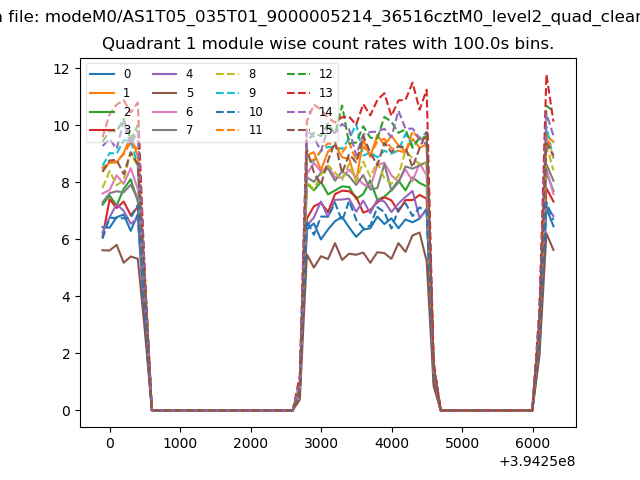
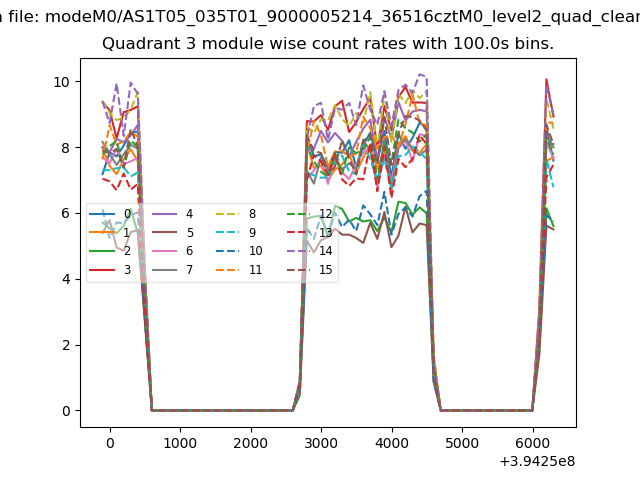
| Module-wise count rates for Quadrant A Data is divided into 100 sec bins |
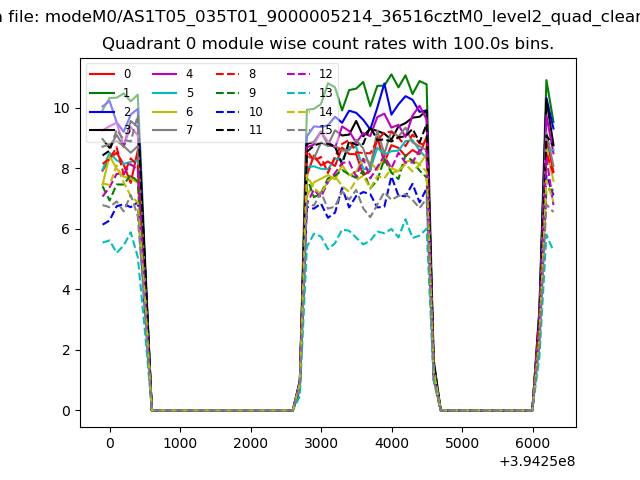 |
 |
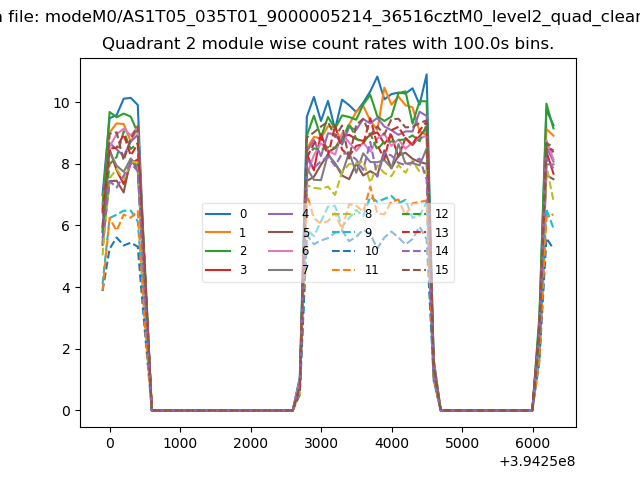
| Module-wise count rates for Quadrant B Data is divided into 100 sec bins |
 |
 |
| Module-wise count rates for Quadrant C Data is divided into 100 sec bins |
 |
 |
| Module-wise count rates for Quadrant D Data is divided into 100 sec bins |
 |
 |
| Parameter | Plot |
|---|---|
| CZT HV Monitor | 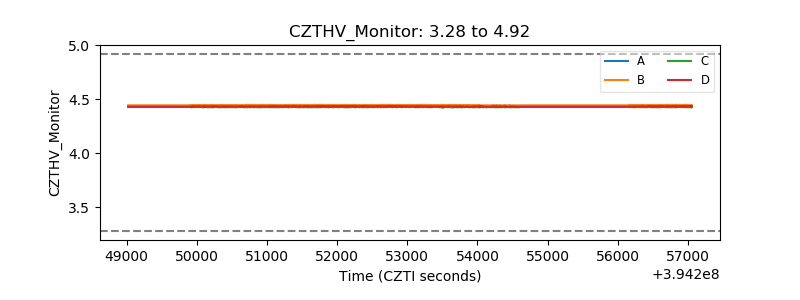 |
| D_VDD | 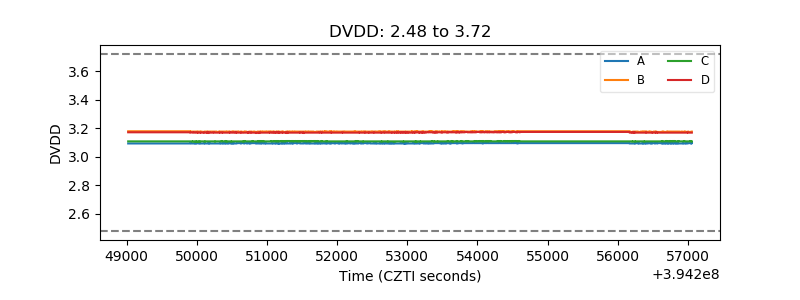 |
| Temperature 1 | 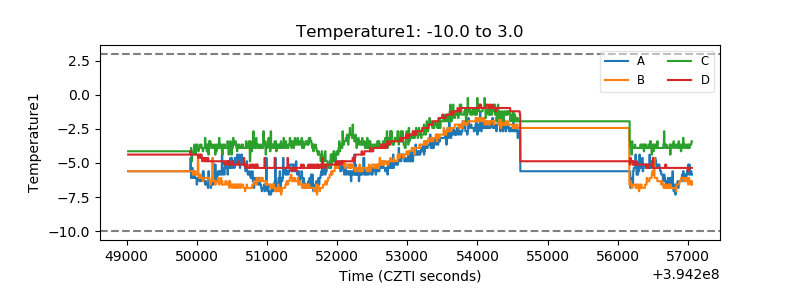 |
| Veto HV Monitor | 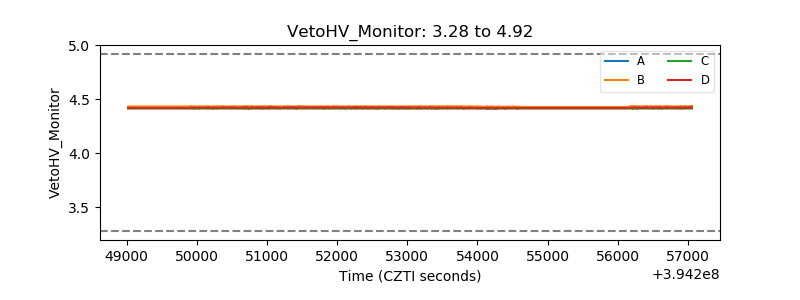 |
| Veto LLD | 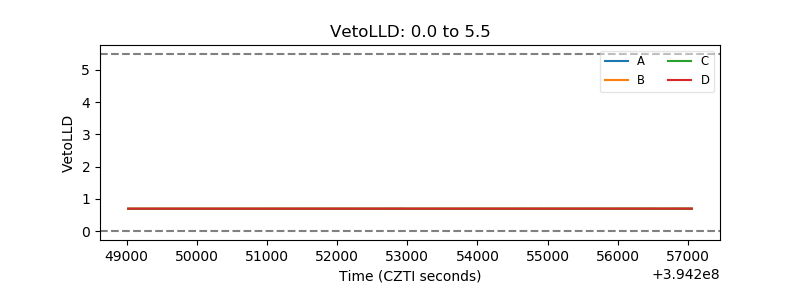 |
| Alpha Counter | 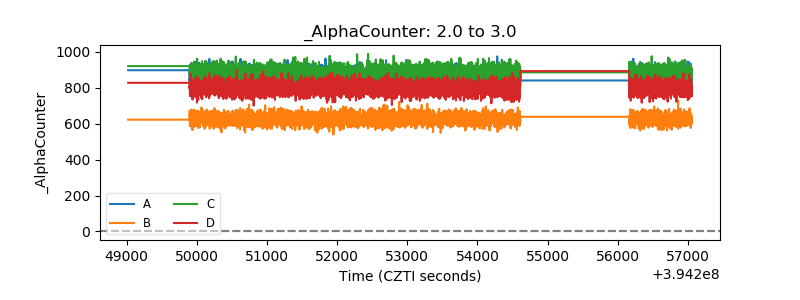 |
| _CPM_Rate | 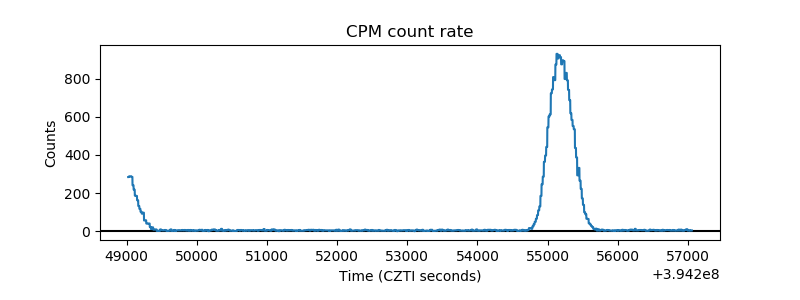 |
| CZT Counter | 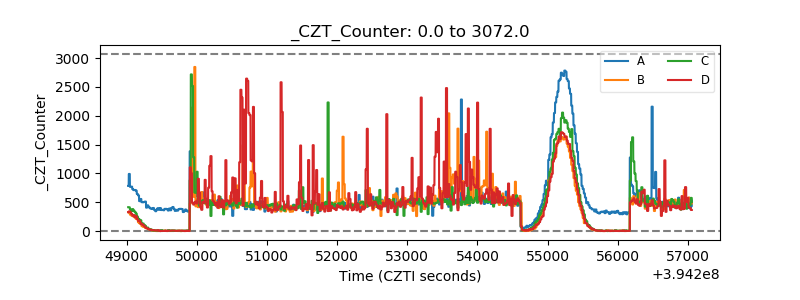 |
| +2.5 Volts monitor | 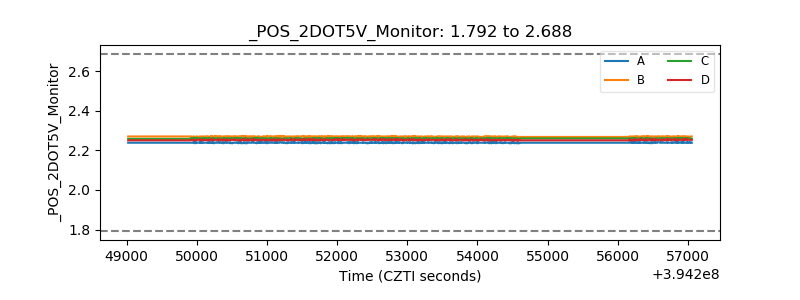 |
| +5 Volts monitor | 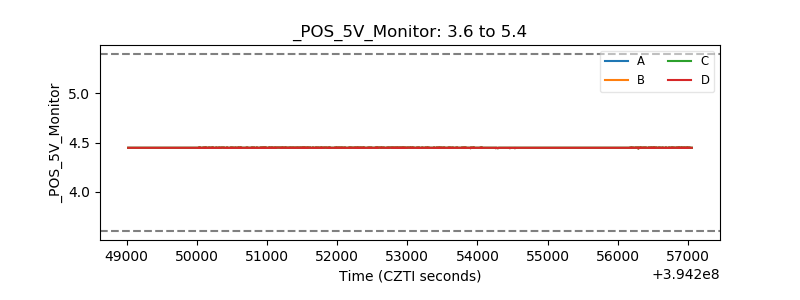 |
| _ROLL_ROT | 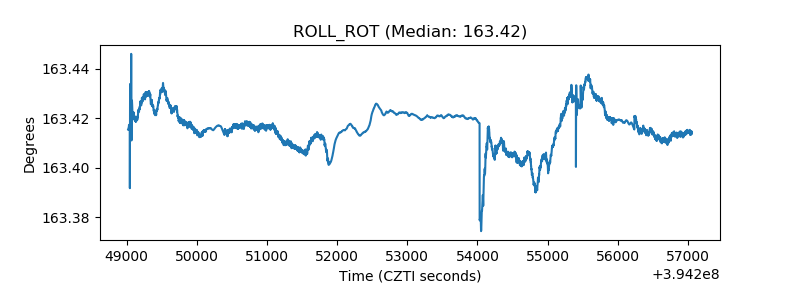 |
| _Roll_DEC | 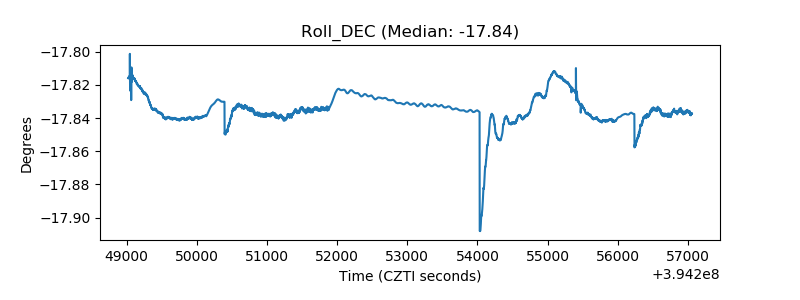 |
| _Roll_RA | 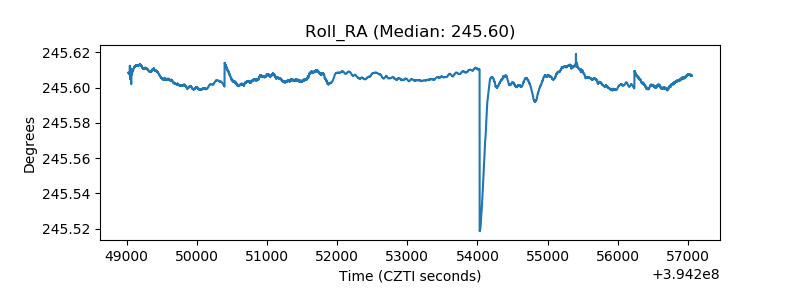 |
| Veto Counter | 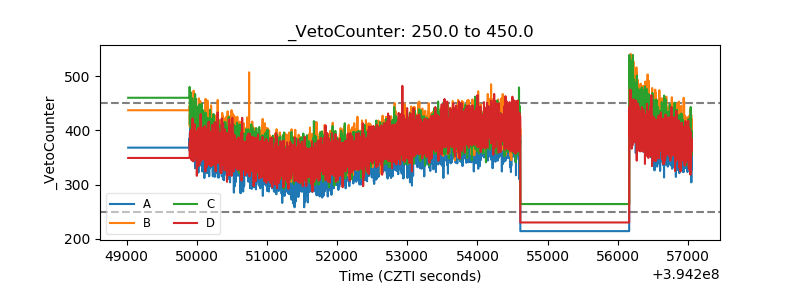 |