| Param | Original file | Final file |
|---|---|---|
| Filename | modeM0/AS1T05_035T01_9000005214_36511cztM0_level2.evt | modeM0/AS1T05_035T01_9000005214_36511cztM0_level2_quad_clean.evt |
| Size (bytes) | 490,942,080 | 73,111,680 |
| Size | 468.2 MB | 69.7 MB |
| Events in quadrant A | 2,808,827 | 473,034 |
| Events in quadrant B | 3,889,509 | 459,572 |
| Events in quadrant C | 2,951,656 | 465,864 |
| Events in quadrant D | 4,834,444 | 419,469 |
| Mode M0 | |||
|---|---|---|---|
| Quadrant | BADHDUFLAG | Total packets | Discarded packets |
| A | 0 | 11925 | 3 |
| B | 0 | 15293 | 2 |
| C | 0 | 12150 | 2 |
| D | 0 | 18118 | 2 |
| Mode SS | |||
|---|---|---|---|
| Quadrant | BADHDUFLAG | Total packets | Discarded packets |
| A | 0 | 116 | 0 |
| B | 0 | 116 | 0 |
| C | 0 | 116 | 0 |
| D | 0 | 116 | 0 |
| Mode M9 | |||
|---|---|---|---|
| Quadrant | BADHDUFLAG | Total packets | Discarded packets |
| A | 0 | 20 | 0 |
| B | 0 | 20 | 0 |
| C | 0 | 20 | 0 |
| D | 0 | 21 | 0 |
| Quadrant | Total seconds | Saturated seconds | Saturation percentage |
|---|---|---|---|
| A | 5653 | 20 | 0.353794% |
| B | 5653 | 217 | 3.838670% |
| C | 5653 | 54 | 0.955245% |
| D | 5653 | 493 | 8.721033% |
Noise dominated data is calculated using 1-second bins in cleaned event files. If a bin has >2000 counts, and if more than 50% of those come from <1% of pixels, then it is considered to be noise-dominated and hence unusable.
| Quadrant | # 1 sec bins | Bins with >0 counts | Bins with >2000 counts | High rate bins dominated by noise | Noise dominated (total time) | Noise dominated (detector-on time) | Marked lightcurve |
|---|---|---|---|---|---|---|---|
| A | 7145 | 5654 | 5 | 5 | 0.07% | 0.09% | 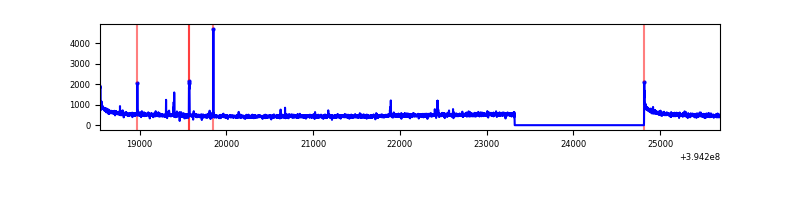 |
| B | 7145 | 5654 | 146 | 146 | 2.04% | 2.58% | 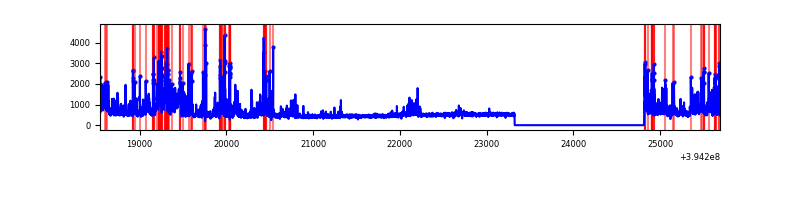 |
| C | 7145 | 5654 | 30 | 30 | 0.42% | 0.53% | 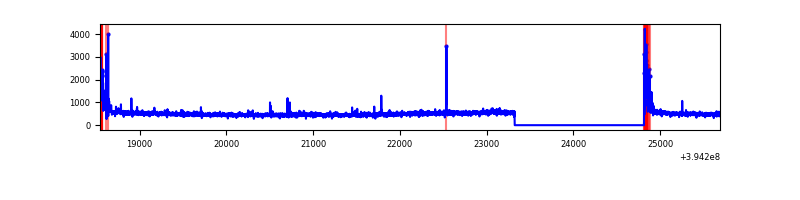 |
| D | 7145 | 5654 | 435 | 435 | 6.09% | 7.69% | 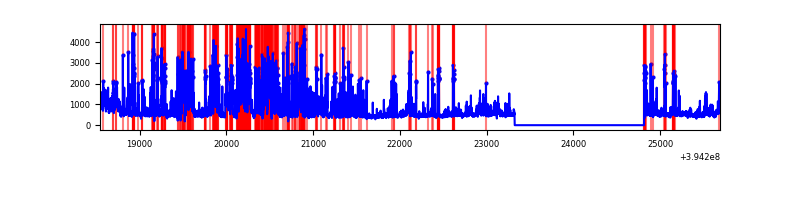 |
Top three noisy pixels from each quadrant. If the there are fewer than three noisy pixels in the level2.evt file, extra rows are filled as -1
| Pixel properties | Quadrant properties | ||||||
|---|---|---|---|---|---|---|---|
| Quadrant | DetID | PixID | Counts | Sigma | Mean | Median | Sigma |
| A | 10 | 83 | 211822 | 1588.31 | 655 | 642 | 133.0 |
| A | 15 | 223 | 23249 | 170.03 | 655 | 642 | 133.0 |
| A | 9 | 143 | 17857 | 129.48 | 655 | 642 | 133.0 |
| B | 4 | 171 | 538115 | 4356.06 | 640 | 626 | 123.4 |
| B | 5 | 172 | 360743 | 2918.55 | 640 | 626 | 123.4 |
| B | 5 | 255 | 327656 | 2650.4 | 640 | 626 | 123.4 |
| C | 15 | 214 | 243424 | 1642.37 | 630 | 634 | 147.8 |
| C | 0 | 10 | 235614 | 1589.53 | 630 | 634 | 147.8 |
| C | 14 | 67 | 12501 | 80.27 | 630 | 634 | 147.8 |
| D | 2 | 137 | 607082 | 3974.84 | 614 | 598 | 152.6 |
| D | 2 | 153 | 453695 | 2969.56 | 614 | 598 | 152.6 |
| D | 2 | 250 | 364234 | 2383.24 | 614 | 598 | 152.6 |
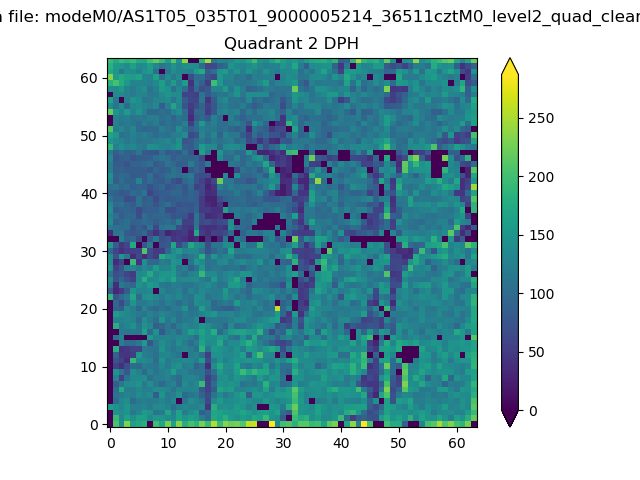
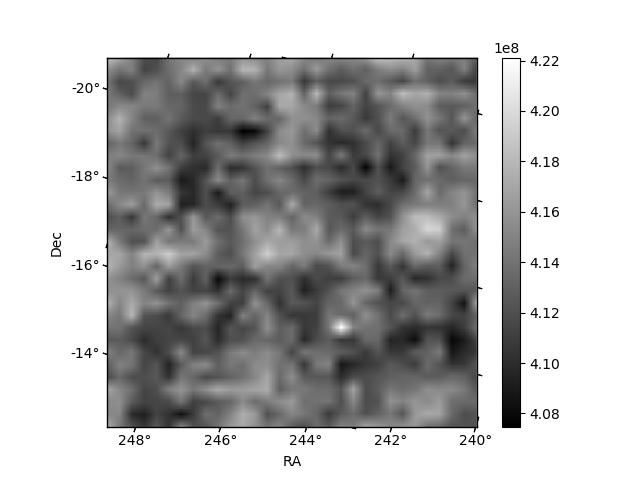
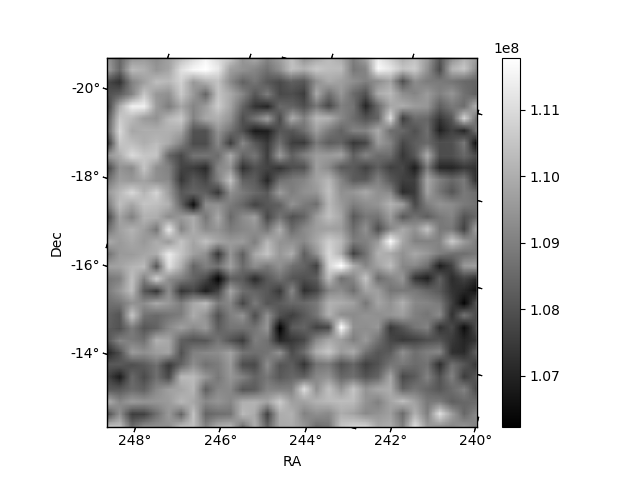
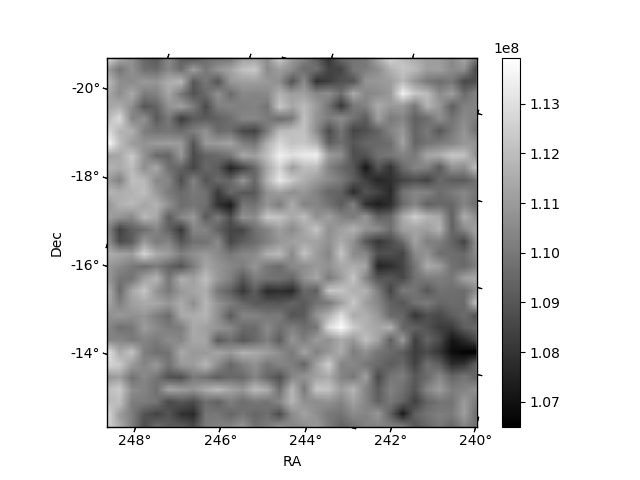
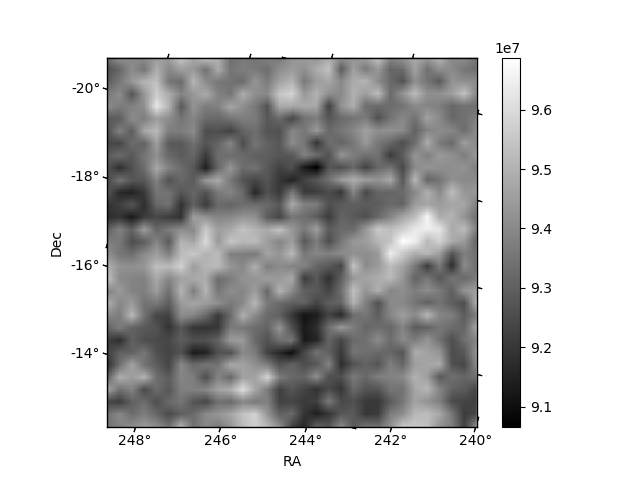
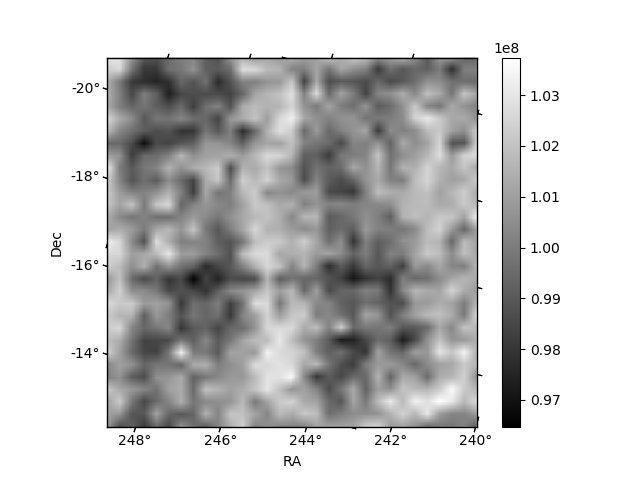
Histogram calculated using DETX and DETY for each event in the final _common_clean file
| Quadrant A | 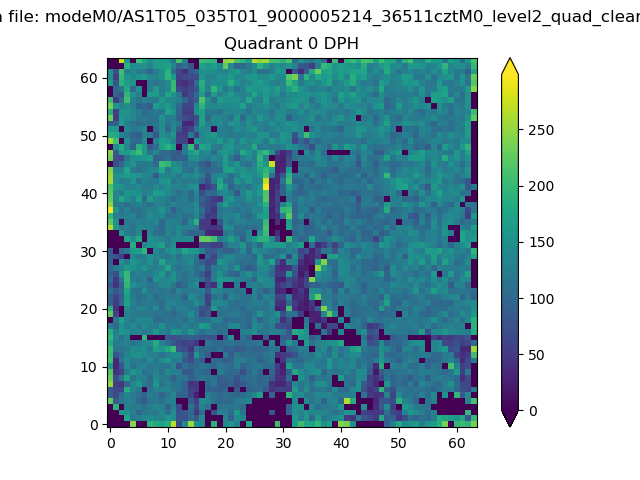 |
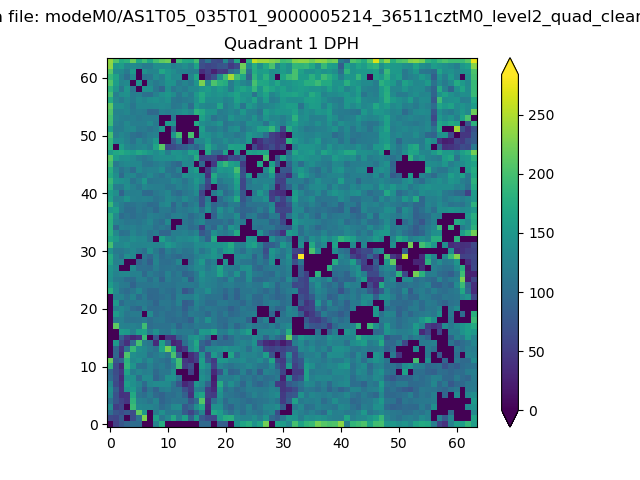 |
Quadrant B |
|---|---|---|---|
| Quadrant D | 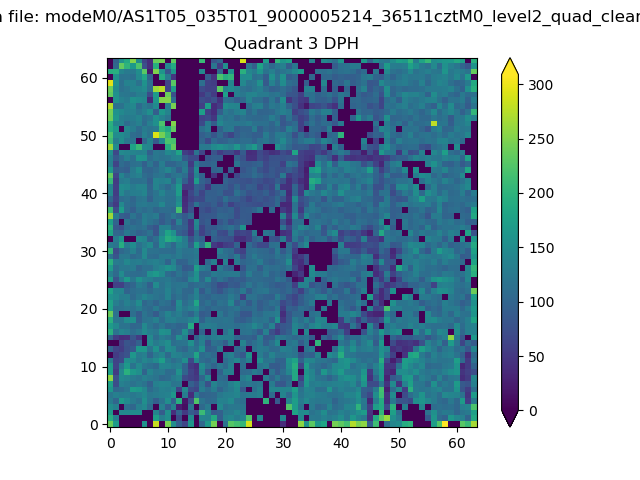 |
 |
Quadrant C |
| Plot type | Count rate plots | Images |
|---|---|---|
| Comparison with Poisson distribution Blue bars denote a histogram of data divided into 1 sec bins. Red curve is a Poisson curve with rate = median count rate of data. |
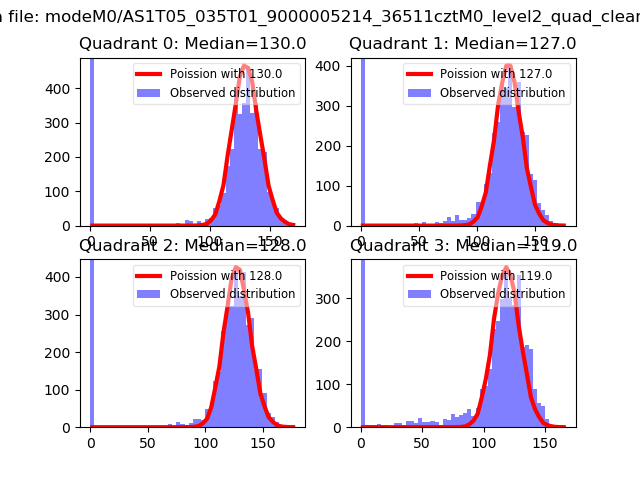 |
 |
| Quadrant-wise count rates Data is divided into 100 sec bins |
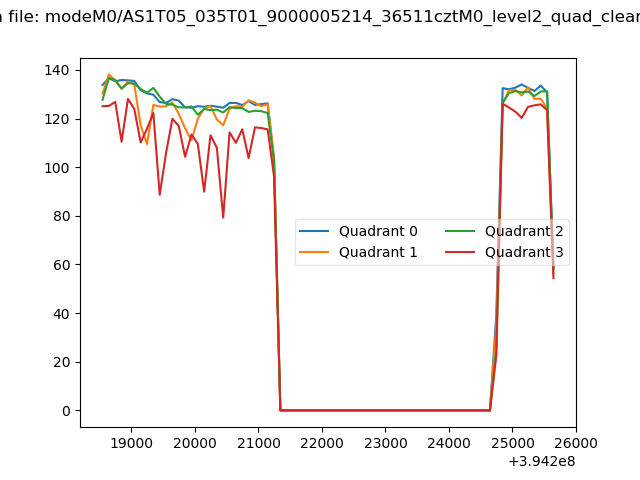 |
|
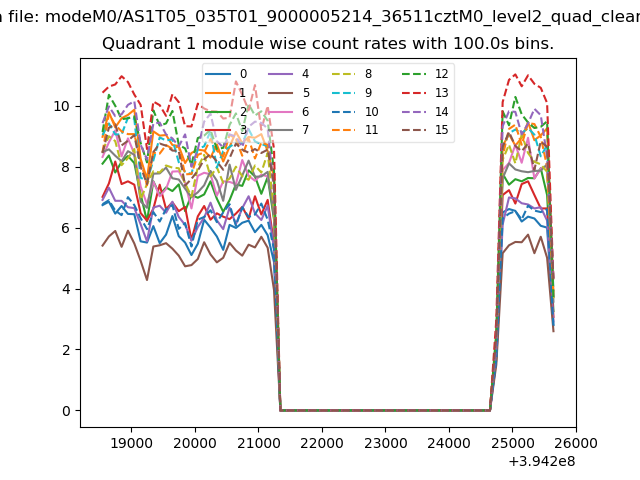
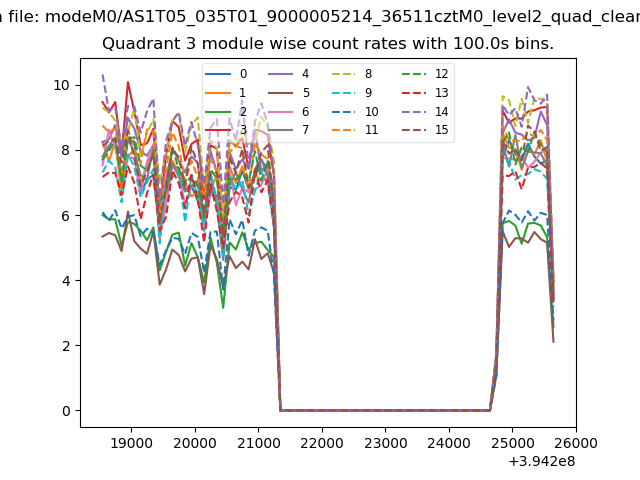
| Module-wise count rates for Quadrant A Data is divided into 100 sec bins |
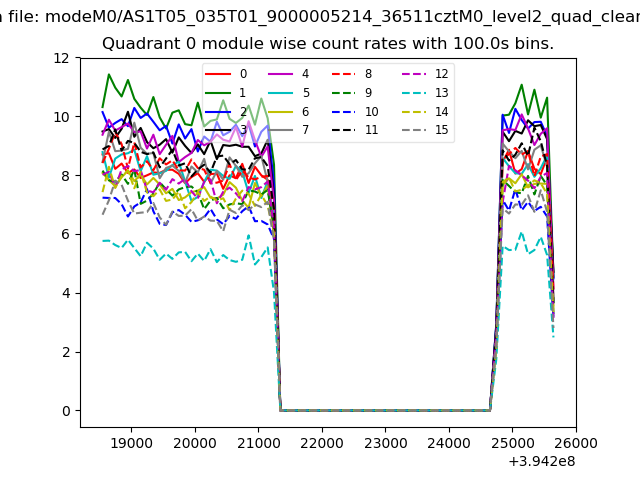 |
 |
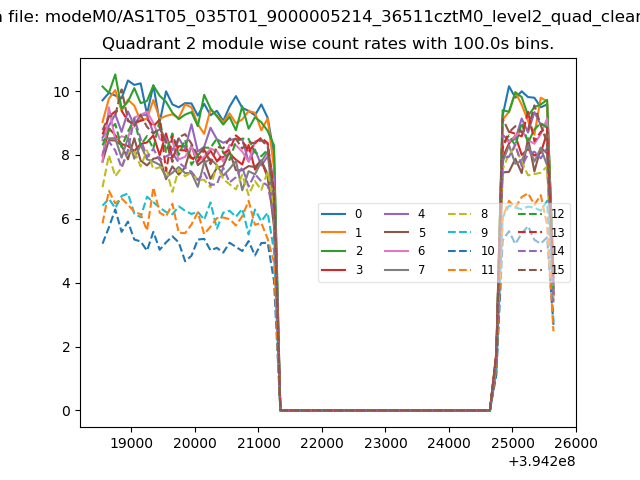
| Module-wise count rates for Quadrant B Data is divided into 100 sec bins |
 |
 |
| Module-wise count rates for Quadrant C Data is divided into 100 sec bins |
 |
 |
| Module-wise count rates for Quadrant D Data is divided into 100 sec bins |
 |
 |
| Parameter | Plot |
|---|---|
| CZT HV Monitor | 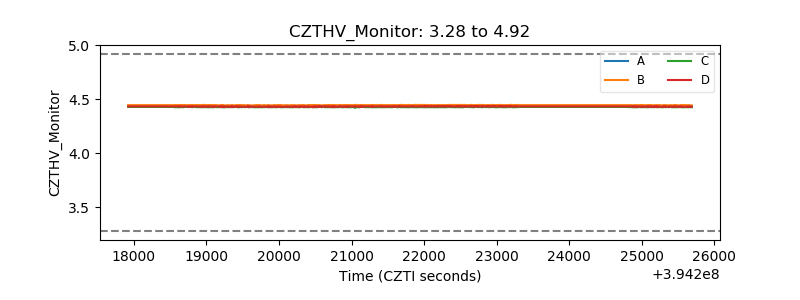 |
| D_VDD | 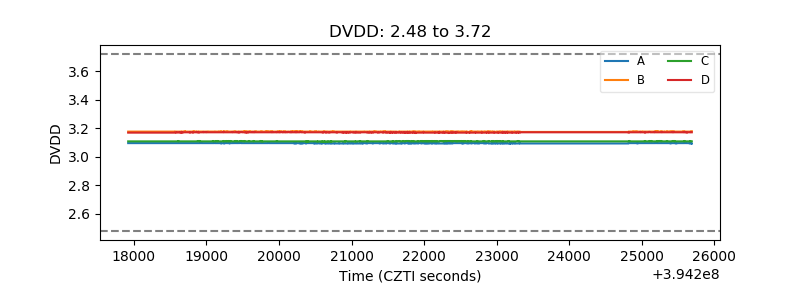 |
| Temperature 1 | 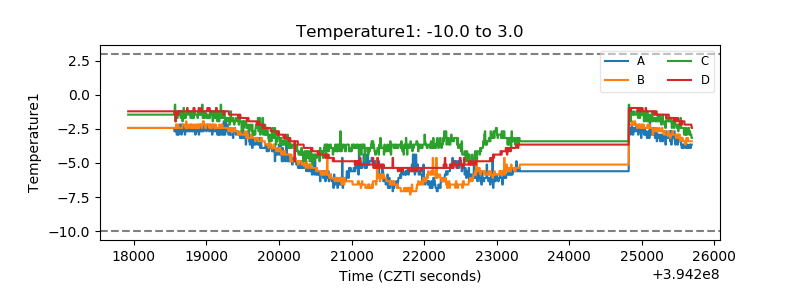 |
| Veto HV Monitor | 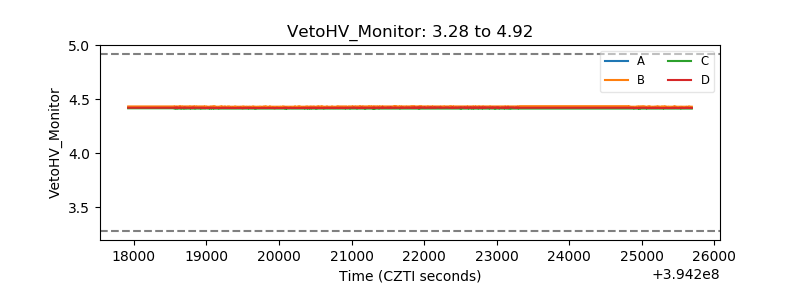 |
| Veto LLD | 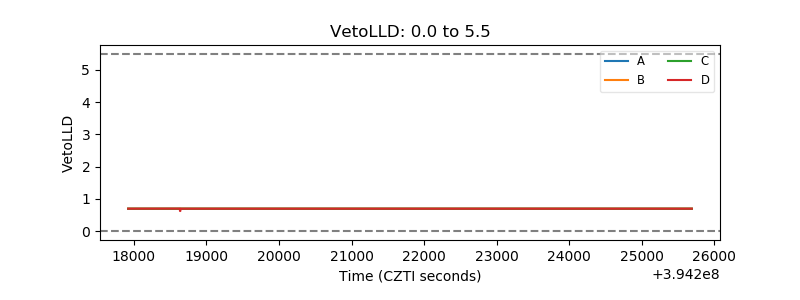 |
| Alpha Counter | 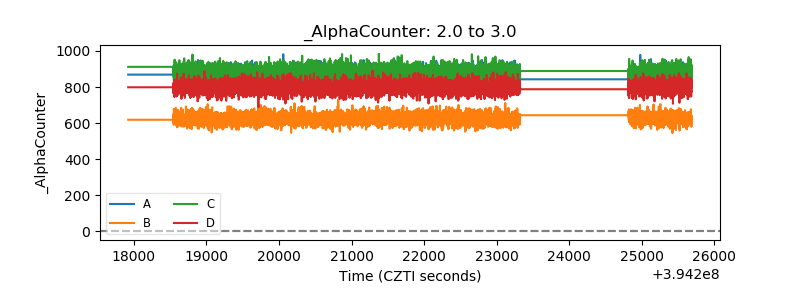 |
| _CPM_Rate | 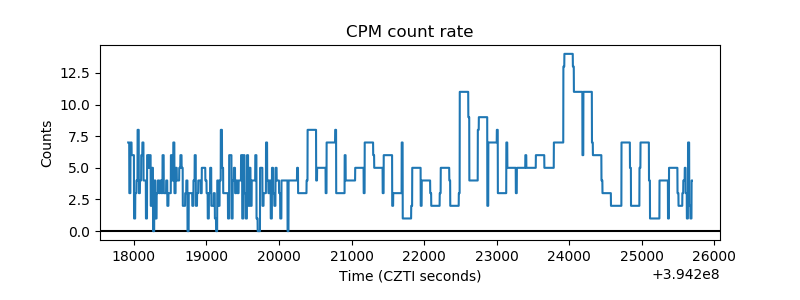 |
| CZT Counter | 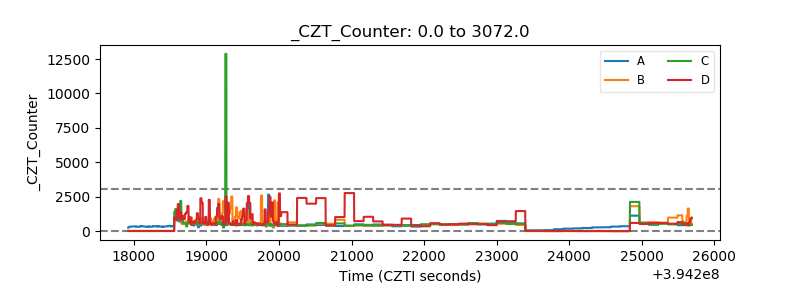 |
| +2.5 Volts monitor | 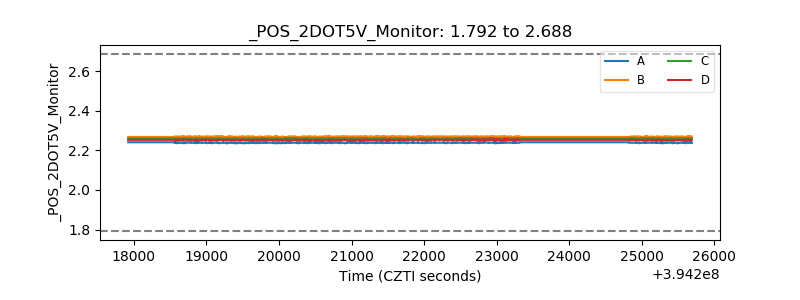 |
| +5 Volts monitor | 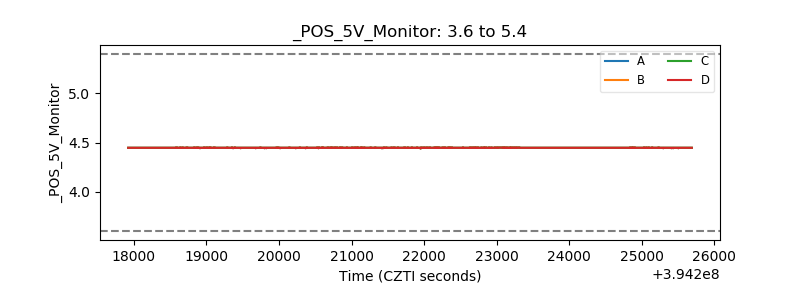 |
| _ROLL_ROT | 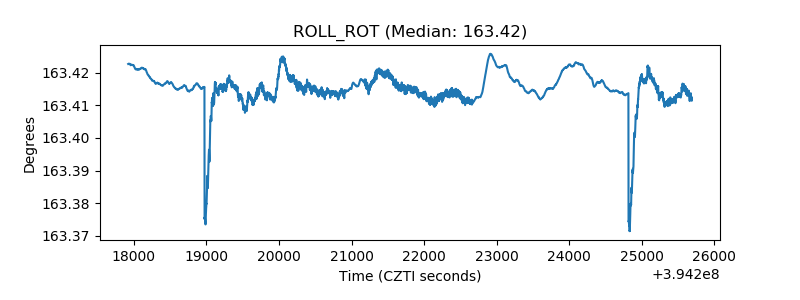 |
| _Roll_DEC | 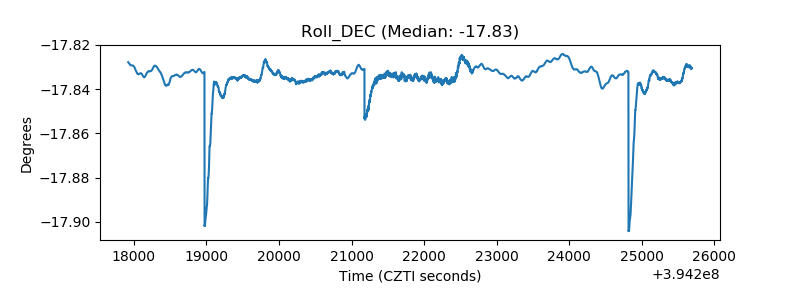 |
| _Roll_RA | 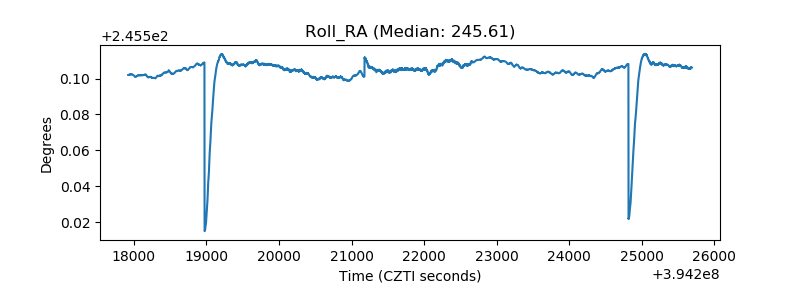 |
| Veto Counter | 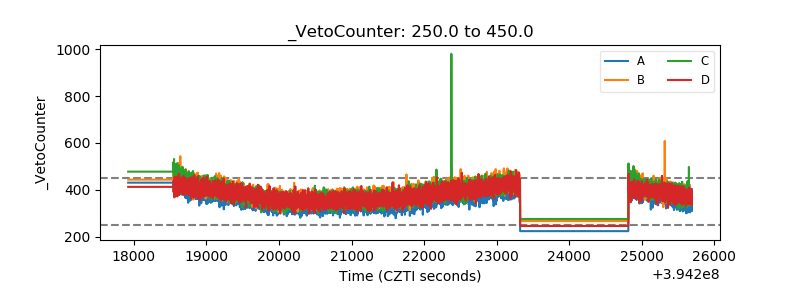 |