| Param | Original file | Final file |
|---|---|---|
| Filename | modeM0/AS1T05_035T01_9000005214_36506cztM0_level2.evt | modeM0/AS1T05_035T01_9000005214_36506cztM0_level2_quad_clean.evt |
| Size (bytes) | 513,737,280 | 67,040,640 |
| Size | 489.9 MB | 63.9 MB |
| Events in quadrant A | 2,932,342 | 432,505 |
| Events in quadrant B | 3,183,480 | 434,213 |
| Events in quadrant C | 2,978,549 | 429,325 |
| Events in quadrant D | 6,116,094 | 373,242 |
| Mode M0 | |||
|---|---|---|---|
| Quadrant | BADHDUFLAG | Total packets | Discarded packets |
| A | 0 | 11683 | 3 |
| B | 0 | 12483 | 2 |
| C | 0 | 11684 | 2 |
| D | 0 | 21850 | 2 |
| Mode SS | |||
|---|---|---|---|
| Quadrant | BADHDUFLAG | Total packets | Discarded packets |
| A | 0 | 104 | 0 |
| B | 0 | 104 | 0 |
| C | 0 | 104 | 0 |
| D | 0 | 104 | 0 |
| Mode M9 | |||
|---|---|---|---|
| Quadrant | BADHDUFLAG | Total packets | Discarded packets |
| A | 0 | 35 | 0 |
| B | 0 | 35 | 0 |
| C | 0 | 35 | 0 |
| D | 0 | 36 | 0 |
| Quadrant | Total seconds | Saturated seconds | Saturation percentage |
|---|---|---|---|
| A | 5147 | 28 | 0.544006% |
| B | 5147 | 93 | 1.806878% |
| C | 5147 | 50 | 0.971440% |
| D | 5147 | 616 | 11.968137% |
Noise dominated data is calculated using 1-second bins in cleaned event files. If a bin has >2000 counts, and if more than 50% of those come from <1% of pixels, then it is considered to be noise-dominated and hence unusable.
| Quadrant | # 1 sec bins | Bins with >0 counts | Bins with >2000 counts | High rate bins dominated by noise | Noise dominated (total time) | Noise dominated (detector-on time) | Marked lightcurve |
|---|---|---|---|---|---|---|---|
| A | 7150 | 5148 | 13 | 13 | 0.18% | 0.25% | 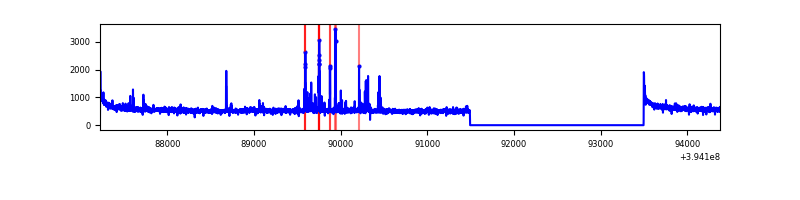 |
| B | 7150 | 5148 | 51 | 51 | 0.71% | 0.99% | 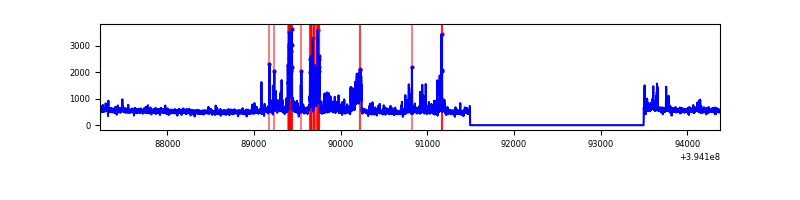 |
| C | 7150 | 5148 | 29 | 29 | 0.41% | 0.56% | 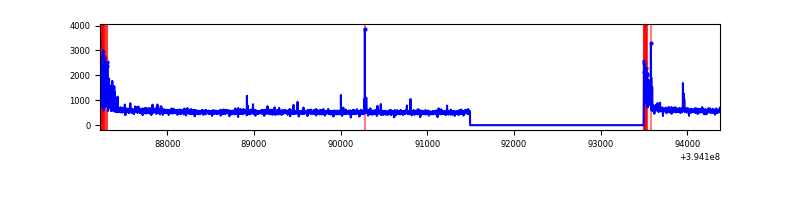 |
| D | 7150 | 5148 | 652 | 652 | 9.12% | 12.67% | 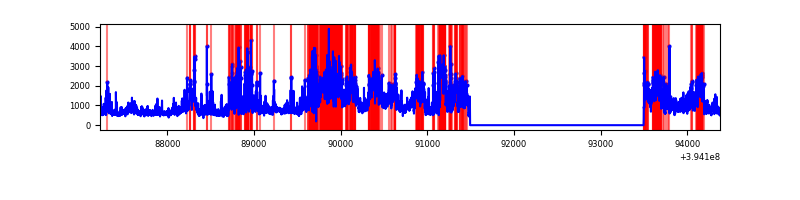 |
Top three noisy pixels from each quadrant. If the there are fewer than three noisy pixels in the level2.evt file, extra rows are filled as -1
| Pixel properties | Quadrant properties | ||||||
|---|---|---|---|---|---|---|---|
| Quadrant | DetID | PixID | Counts | Sigma | Mean | Median | Sigma |
| A | 10 | 83 | 197126 | 1464.88 | 674 | 667 | 134.1 |
| A | 7 | 3 | 108573 | 804.59 | 674 | 667 | 134.1 |
| A | 15 | 223 | 10825 | 75.74 | 674 | 667 | 134.1 |
| B | 5 | 172 | 382043 | 3094.57 | 661 | 646 | 123.2 |
| B | 4 | 171 | 97598 | 786.65 | 661 | 646 | 123.2 |
| B | 5 | 255 | 29740 | 236.06 | 661 | 646 | 123.2 |
| C | 15 | 214 | 224804 | 1492.17 | 648 | 653 | 150.2 |
| C | 0 | 10 | 191515 | 1270.56 | 648 | 653 | 150.2 |
| C | 15 | 159 | 29564 | 192.46 | 648 | 653 | 150.2 |
| D | 12 | 227 | 2150524 | 14287.57 | 625 | 609 | 150.5 |
| D | 1 | 20 | 416928 | 2766.71 | 625 | 609 | 150.5 |
| D | 12 | 235 | 202126 | 1339.21 | 625 | 609 | 150.5 |
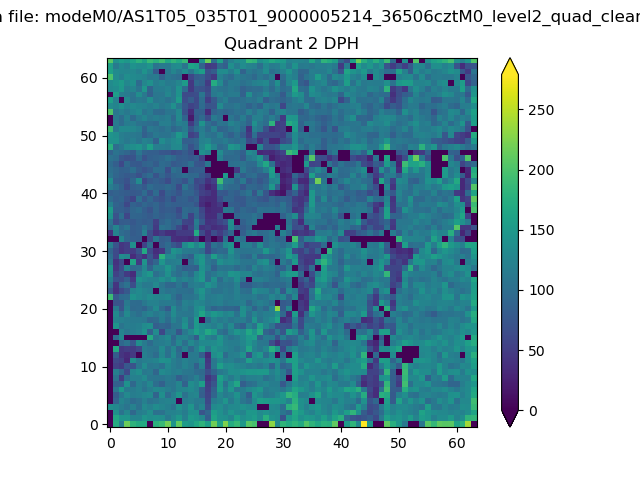
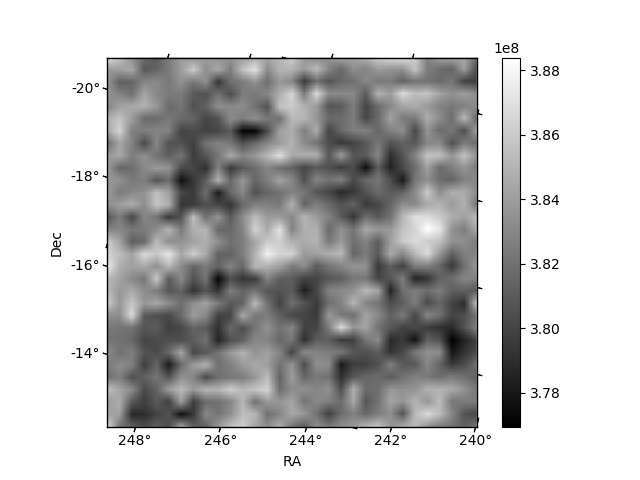
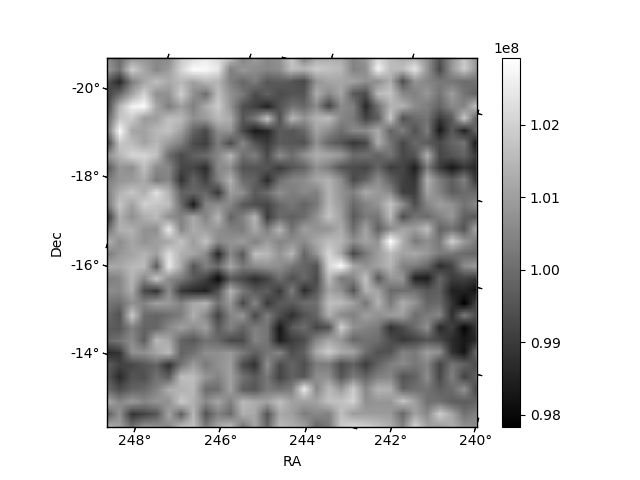
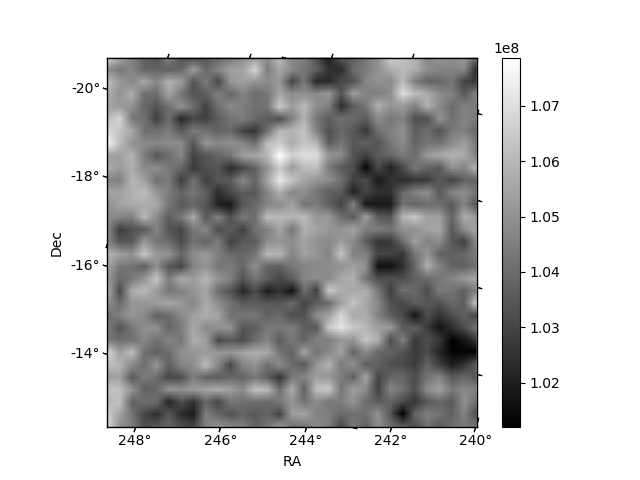
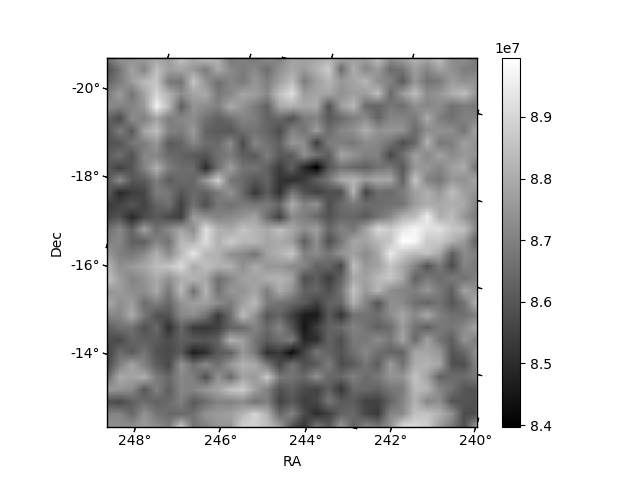
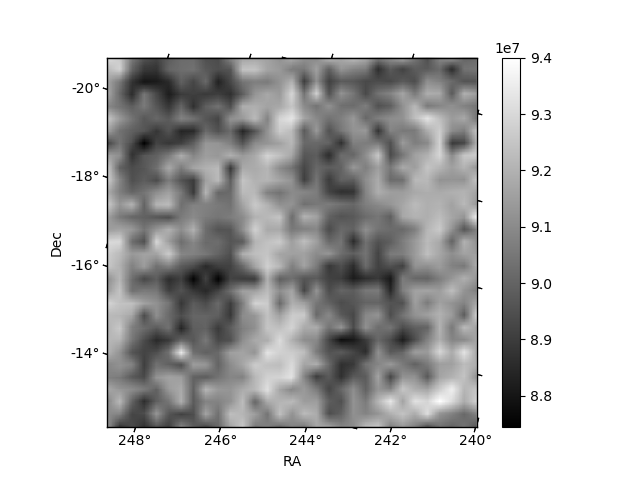
Histogram calculated using DETX and DETY for each event in the final _common_clean file
| Quadrant A | 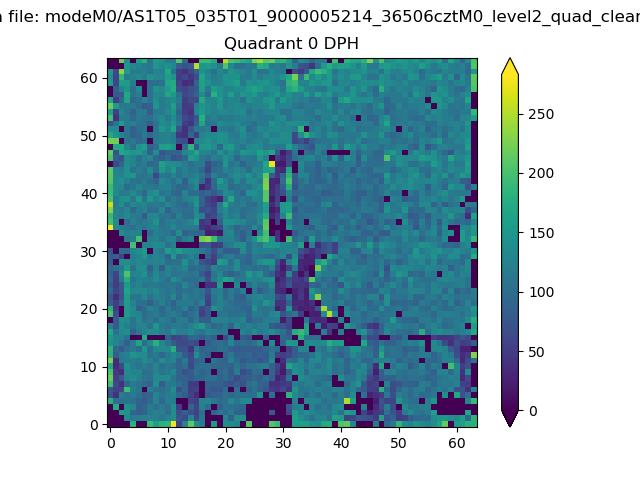 |
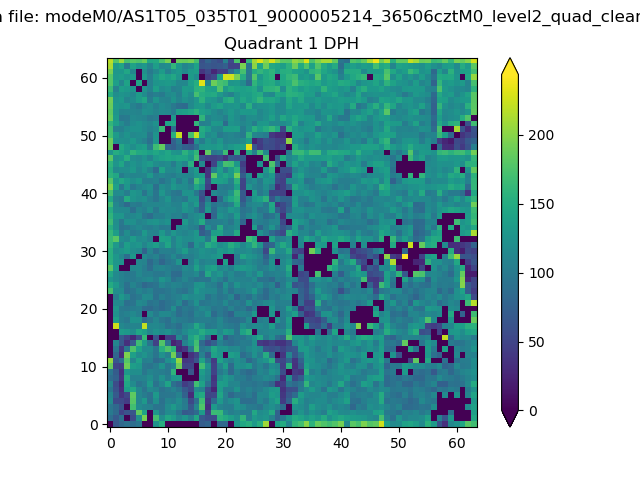 |
Quadrant B |
|---|---|---|---|
| Quadrant D | 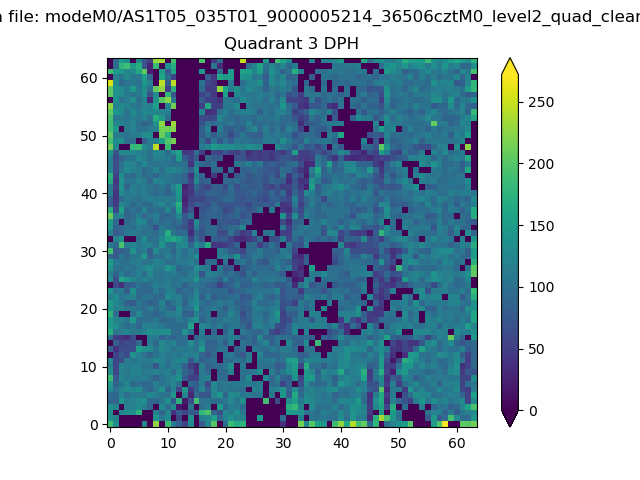 |
 |
Quadrant C |
| Plot type | Count rate plots | Images |
|---|---|---|
| Comparison with Poisson distribution Blue bars denote a histogram of data divided into 1 sec bins. Red curve is a Poisson curve with rate = median count rate of data. |
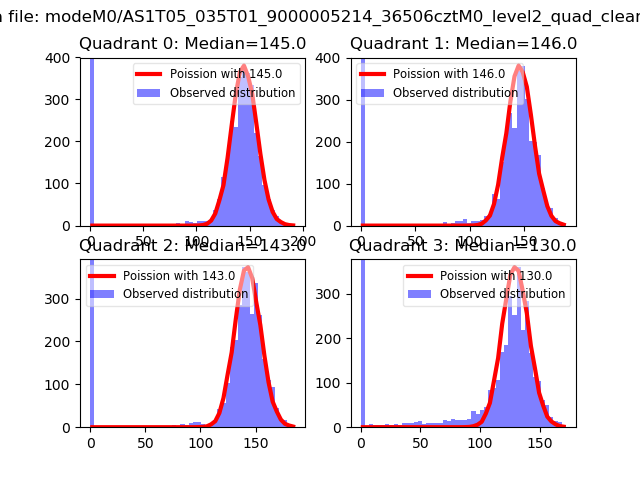 |
 |
| Quadrant-wise count rates Data is divided into 100 sec bins |
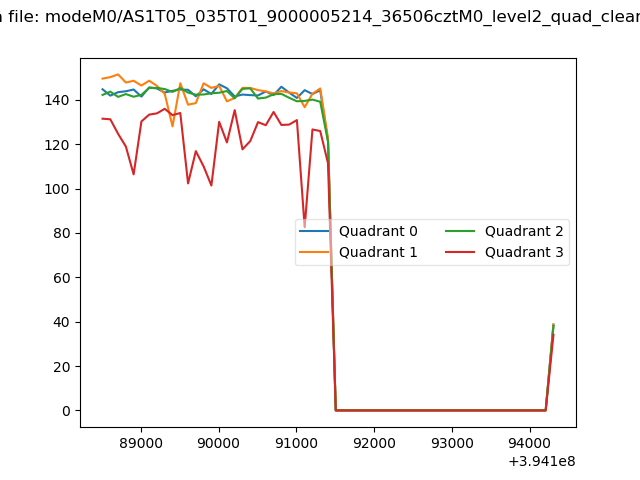 |
|
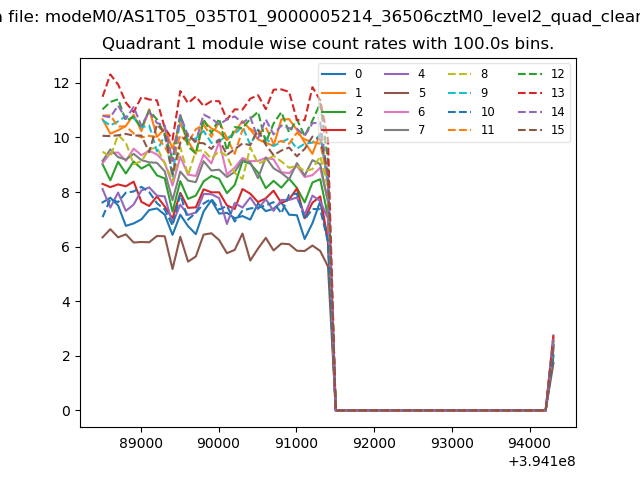
| Module-wise count rates for Quadrant A Data is divided into 100 sec bins |
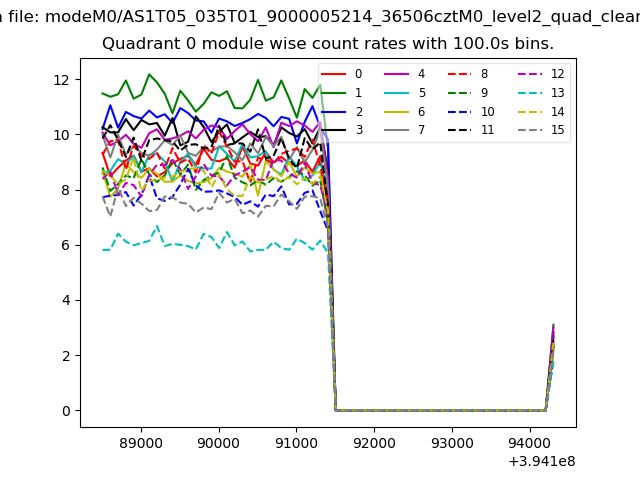 |
 |
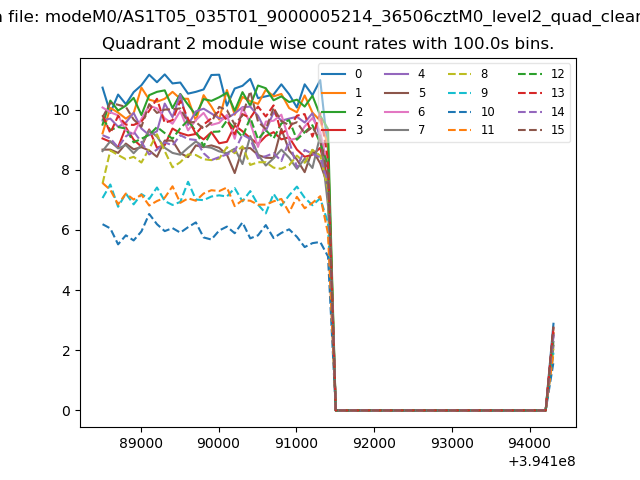
| Module-wise count rates for Quadrant B Data is divided into 100 sec bins |
 |
 |
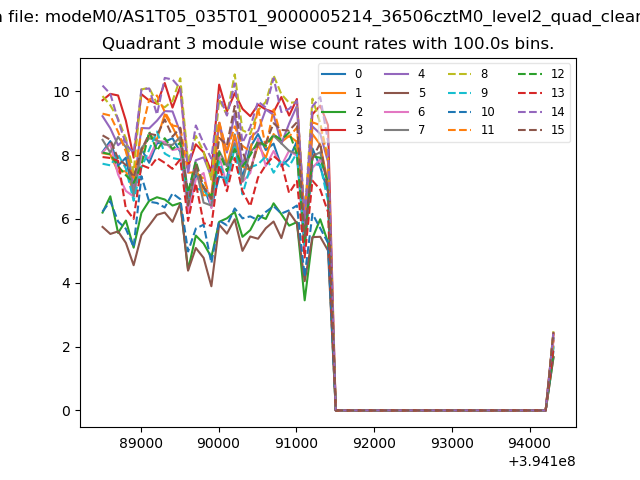
| Module-wise count rates for Quadrant C Data is divided into 100 sec bins |
 |
 |
| Module-wise count rates for Quadrant D Data is divided into 100 sec bins |
 |
 |
| Parameter | Plot |
|---|---|
| CZT HV Monitor | 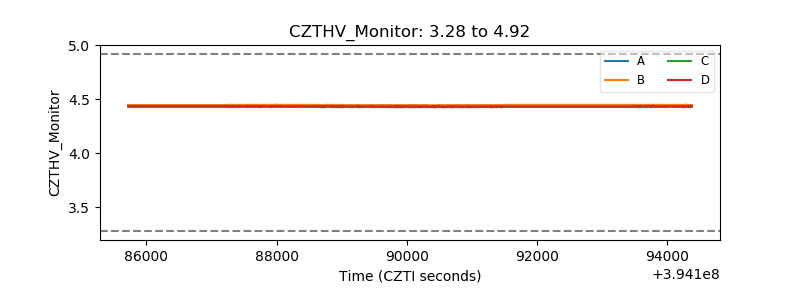 |
| D_VDD | 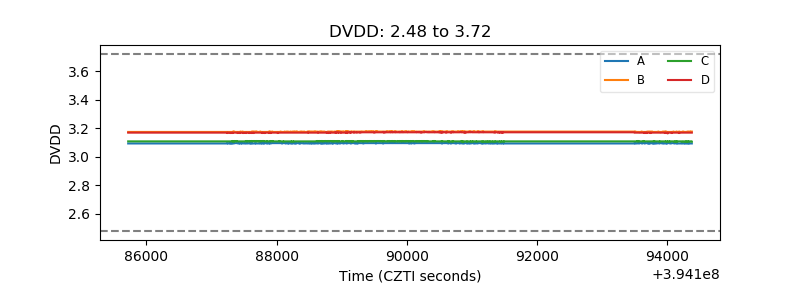 |
| Temperature 1 | 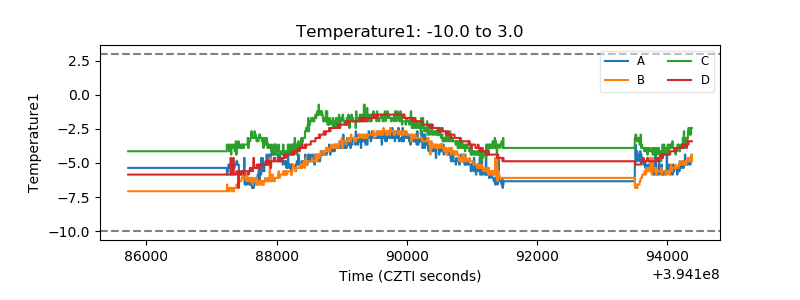 |
| Veto HV Monitor | 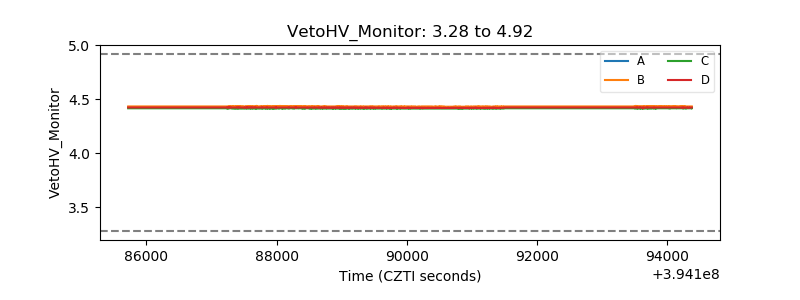 |
| Veto LLD | 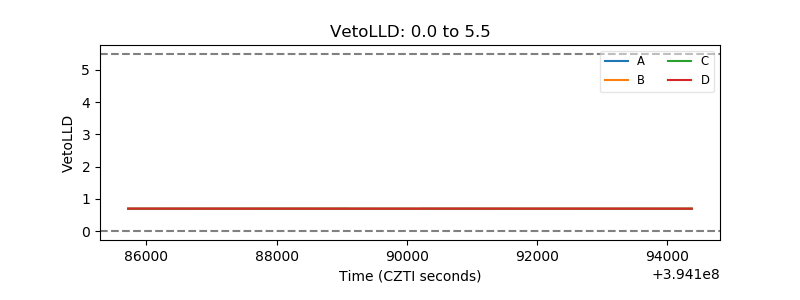 |
| Alpha Counter | 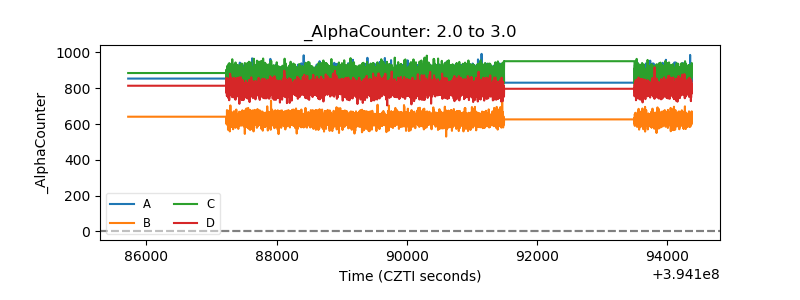 |
| _CPM_Rate | 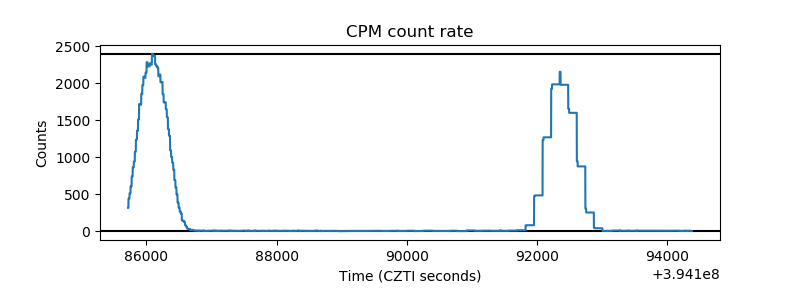 |
| CZT Counter | 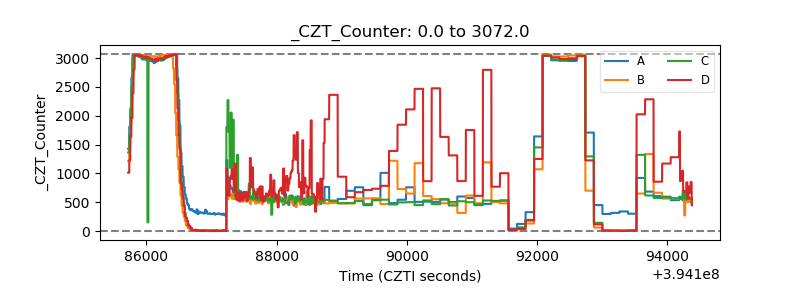 |
| +2.5 Volts monitor | 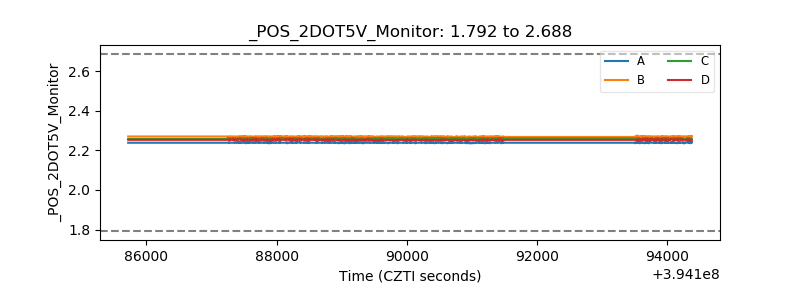 |
| +5 Volts monitor | 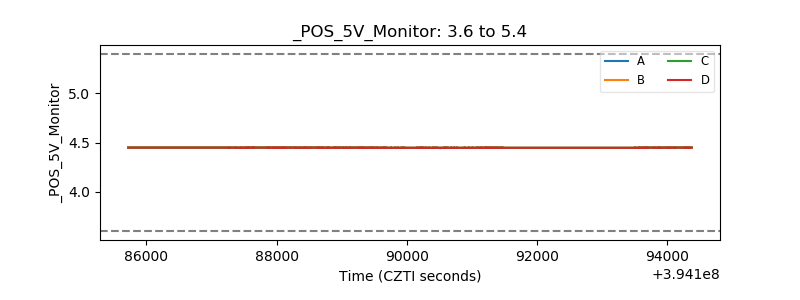 |
| _ROLL_ROT | 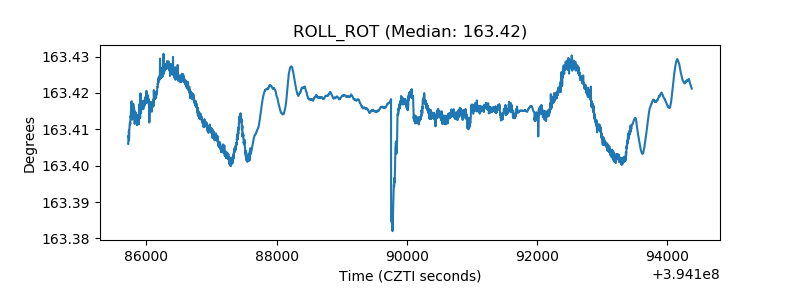 |
| _Roll_DEC | 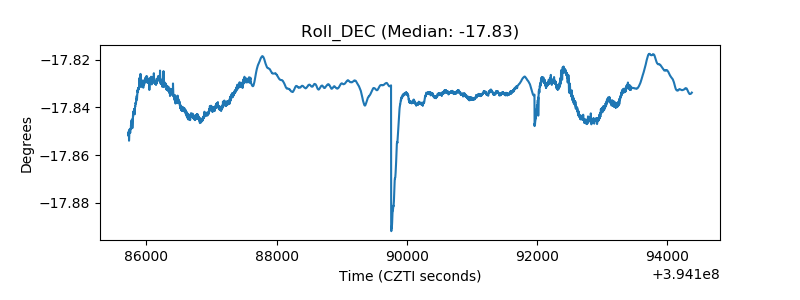 |
| _Roll_RA | 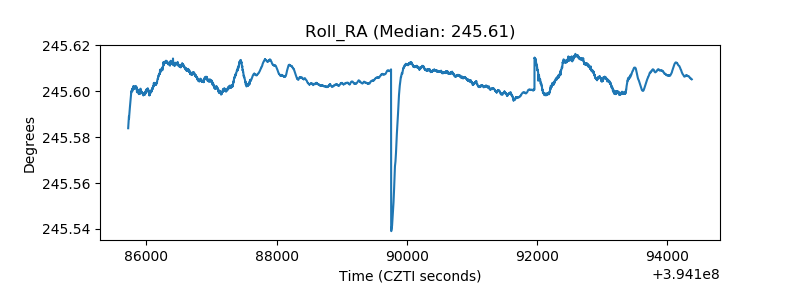 |
| Veto Counter | 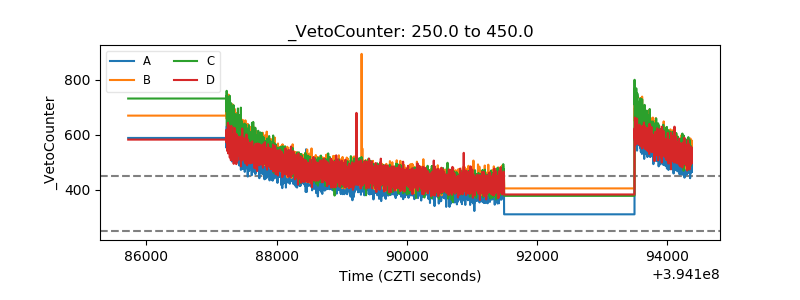 |