| Param | Original file | Final file |
|---|---|---|
| Filename | modeM0/AS1T05_035T01_9000005214cztM0_level2_bc.evt | modeM0/AS1T05_035T01_9000005214cztM0_level2_quad_clean.evt |
| Size (bytes) | 3,354,370,560 | 945,141,120 |
| Size | 3.1 GB | 901.4 MB |
| Events in quadrant A | 17,548,520 | 6,169,630 |
| Events in quadrant B | 21,594,876 | 6,133,551 |
| Events in quadrant C | 19,003,546 | 6,080,016 |
| Events in quadrant D | 38,671,728 | 5,433,342 |
| Mode M0 | |||
|---|---|---|---|
| Quadrant | BADHDUFLAG | Total packets | Discarded packets |
| A | 0 | 148936 | 0 |
| B | 0 | 168295 | 0 |
| C | 0 | 150968 | 0 |
| D | 0 | 228591 | 0 |
| Mode SS | |||
|---|---|---|---|
| Quadrant | BADHDUFLAG | Total packets | Discarded packets |
| A | 0 | 1434 | 0 |
| B | 0 | 1434 | 0 |
| C | 0 | 1434 | 0 |
| D | 0 | 1434 | 0 |
| Mode M9 | |||
|---|---|---|---|
| Quadrant | BADHDUFLAG | Total packets | Discarded packets |
| A | 0 | 281 | 0 |
| B | 0 | 281 | 0 |
| C | 0 | 281 | 0 |
| D | 0 | 281 | 0 |
| Quadrant | Total seconds | Saturated seconds | Saturation percentage |
|---|---|---|---|
| A | 70148 | 203 | 0.289388% |
| B | 70148 | 1335 | 1.903119% |
| C | 70148 | 528 | 0.752694% |
| D | 70148 | 6461 | 9.210526% |
Noise dominated data is calculated using 1-second bins in cleaned event files. If a bin has >2000 counts, and if more than 50% of those come from <1% of pixels, then it is considered to be noise-dominated and hence unusable.
| Quadrant | # 1 sec bins | Bins with >0 counts | Bins with >2000 counts | High rate bins dominated by noise | Noise dominated (total time) | Noise dominated (detector-on time) | Marked lightcurve |
|---|---|---|---|---|---|---|---|
| A | 98175 | 70164 | 30 | 30 | 0.03% | 0.04% |  |
| B | 98175 | 70149 | 107 | 107 | 0.11% | 0.15% |  |
| C | 98175 | 70148 | 80 | 80 | 0.08% | 0.11% | 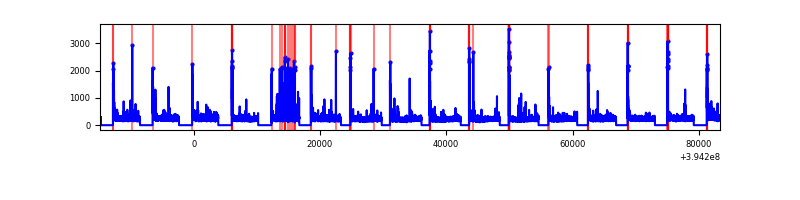 |
| D | 98175 | 70148 | 2270 | 2270 | 2.31% | 3.24% |  |
Top three noisy pixels from each quadrant. If the there are fewer than three noisy pixels in the level2.evt file, extra rows are filled as -1
| Pixel properties | Quadrant properties | ||||||
|---|---|---|---|---|---|---|---|
| Quadrant | DetID | PixID | Counts | Sigma | Mean | Median | Sigma |
| A | 10 | 83 | 2043672 | 2439.85 | 3798 | 3747 | 836.1 |
| A | 9 | 143 | 289182 | 341.39 | 3798 | 3747 | 836.1 |
| A | 7 | 3 | 215277 | 253.0 | 3798 | 3747 | 836.1 |
| B | 5 | 172 | 2830181 | 3775.41 | 3790 | 3720 | 748.7 |
| B | 5 | 255 | 1225343 | 1631.77 | 3790 | 3720 | 748.7 |
| B | 4 | 171 | 1156441 | 1539.73 | 3790 | 3720 | 748.7 |
| C | 15 | 214 | 2825507 | 3358.65 | 3672 | 3657 | 840.2 |
| C | 0 | 10 | 1682022 | 1997.64 | 3672 | 3657 | 840.2 |
| C | 12 | 249 | 64172 | 72.03 | 3672 | 3657 | 840.2 |
| D | 12 | 227 | 10350721 | 12380.07 | 3559 | 3473 | 835.8 |
| D | 13 | 249 | 2355957 | 2814.65 | 3559 | 3473 | 835.8 |
| D | 2 | 250 | 2293748 | 2740.22 | 3559 | 3473 | 835.8 |
Histogram calculated using DETX and DETY for each event in the final _common_clean file
| Quadrant A |  |
 |
Quadrant B |
|---|---|---|---|
| Quadrant D |  |
 |
Quadrant C |
| Plot type | Count rate plots | Images |
|---|---|---|
| Comparison with Poisson distribution Blue bars denote a histogram of data divided into 1 sec bins. Red curve is a Poisson curve with rate = median count rate of data. |
 |
 |
| Quadrant-wise count rates Data is divided into 100 sec bins |
 |
|
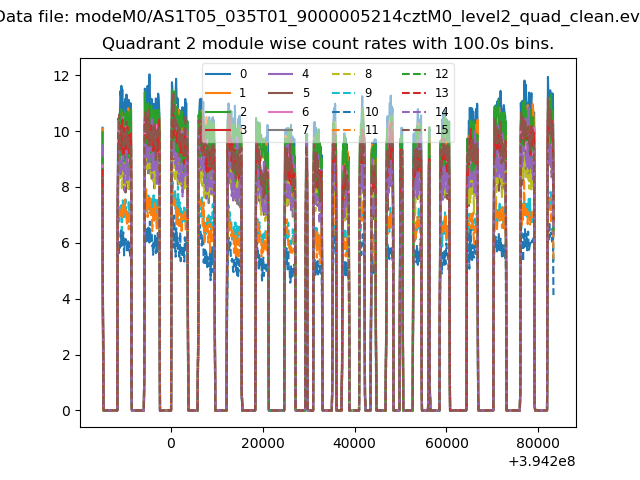
| Module-wise count rates for Quadrant A Data is divided into 100 sec bins |
 |
 |
| Module-wise count rates for Quadrant B Data is divided into 100 sec bins |
 |
 |
| Module-wise count rates for Quadrant C Data is divided into 100 sec bins |
 |
 |
| Module-wise count rates for Quadrant D Data is divided into 100 sec bins |
 |
 |
| Parameter | Plot |
|---|---|
| CZT HV Monitor |  |
| D_VDD |  |
| Temperature 1 |  |
| Veto HV Monitor |  |
| Veto LLD |  |
| Alpha Counter |  |
| _CPM_Rate |  |
| CZT Counter |  |
| +2.5 Volts monitor |  |
| +5 Volts monitor |  |
| _ROLL_ROT |  |
| _Roll_DEC |  |
| _Roll_RA |  |
| Veto Counter |  |