| Param | Original file | Final file |
|---|---|---|
| Filename | modeM0/AS1A11_049T04_9000005210_36490cztM0_level2.evt | modeM0/AS1A11_049T04_9000005210_36490cztM0_level2_quad_clean.evt |
| Size (bytes) | 425,278,080 | 72,901,440 |
| Size | 405.6 MB | 69.5 MB |
| Events in quadrant A | 2,840,331 | 473,115 |
| Events in quadrant B | 3,831,102 | 445,785 |
| Events in quadrant C | 2,853,303 | 465,874 |
| Events in quadrant D | 2,991,937 | 448,598 |
| Mode M9 | |||
|---|---|---|---|
| Quadrant | BADHDUFLAG | Total packets | Discarded packets |
| A | 0 | 30 | 0 |
| B | 0 | 30 | 0 |
| C | 0 | 30 | 0 |
| D | 0 | 31 | 0 |
| Mode SS | |||
|---|---|---|---|
| Quadrant | BADHDUFLAG | Total packets | Discarded packets |
| A | 0 | 110 | 0 |
| B | 0 | 110 | 0 |
| C | 0 | 110 | 0 |
| D | 0 | 110 | 0 |
| Mode M0 | |||
|---|---|---|---|
| Quadrant | BADHDUFLAG | Total packets | Discarded packets |
| A | 0 | 11631 | 3 |
| B | 0 | 14747 | 2 |
| C | 0 | 11614 | 2 |
| D | 0 | 12312 | 2 |
| Quadrant | Total seconds | Saturated seconds | Saturation percentage |
|---|---|---|---|
| A | 5335 | 26 | 0.487348% |
| B | 5335 | 379 | 7.104030% |
| C | 5335 | 57 | 1.068416% |
| D | 5335 | 31 | 0.581068% |
Noise dominated data is calculated using 1-second bins in cleaned event files. If a bin has >2000 counts, and if more than 50% of those come from <1% of pixels, then it is considered to be noise-dominated and hence unusable.
| Quadrant | # 1 sec bins | Bins with >0 counts | Bins with >2000 counts | High rate bins dominated by noise | Noise dominated (total time) | Noise dominated (detector-on time) | Marked lightcurve |
|---|---|---|---|---|---|---|---|
| A | 7157 | 5336 | 18 | 18 | 0.25% | 0.34% | 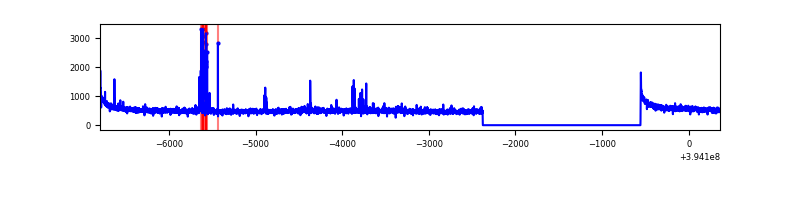 |
| B | 7157 | 5336 | 292 | 292 | 4.08% | 5.47% | 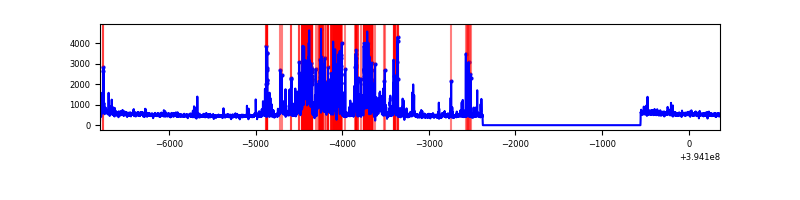 |
| C | 7157 | 5336 | 24 | 24 | 0.34% | 0.45% | 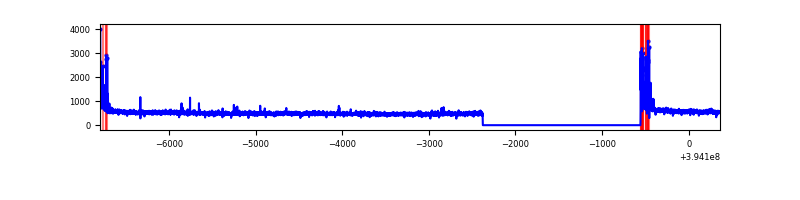 |
| D | 7157 | 5336 | 28 | 28 | 0.39% | 0.52% | 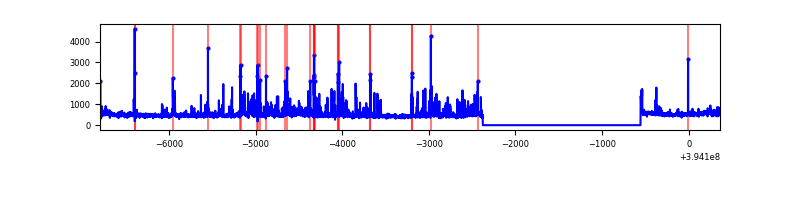 |
Top three noisy pixels from each quadrant. If the there are fewer than three noisy pixels in the level2.evt file, extra rows are filled as -1
| Pixel properties | Quadrant properties | ||||||
|---|---|---|---|---|---|---|---|
| Quadrant | DetID | PixID | Counts | Sigma | Mean | Median | Sigma |
| A | 10 | 83 | 195161 | 1505.09 | 649 | 638 | 129.2 |
| A | 15 | 223 | 84966 | 652.48 | 649 | 638 | 129.2 |
| A | 15 | 233 | 31387 | 237.92 | 649 | 638 | 129.2 |
| B | 5 | 172 | 784013 | 6620.95 | 620 | 605 | 118.3 |
| B | 5 | 255 | 494047 | 4170.31 | 620 | 605 | 118.3 |
| B | 5 | 63 | 51435 | 429.59 | 620 | 605 | 118.3 |
| C | 15 | 214 | 231234 | 1606.99 | 624 | 630 | 143.5 |
| C | 0 | 10 | 181859 | 1262.91 | 624 | 630 | 143.5 |
| C | 13 | 61 | 4138 | 24.45 | 624 | 630 | 143.5 |
| D | 13 | 249 | 139794 | 910.8 | 629 | 611 | 152.8 |
| D | 12 | 227 | 130988 | 853.18 | 629 | 611 | 152.8 |
| D | 2 | 249 | 95608 | 621.65 | 629 | 611 | 152.8 |
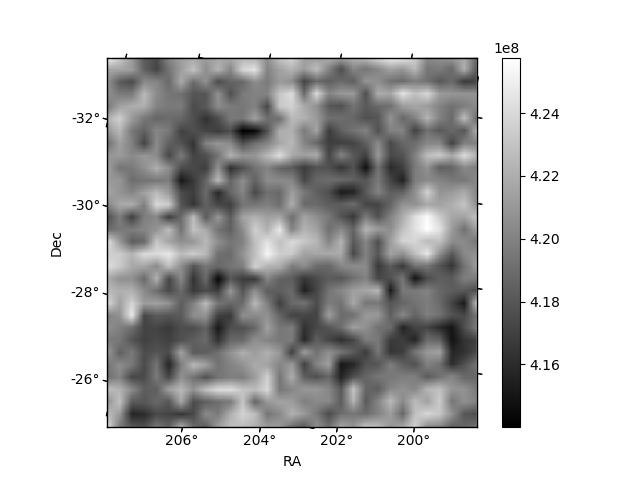
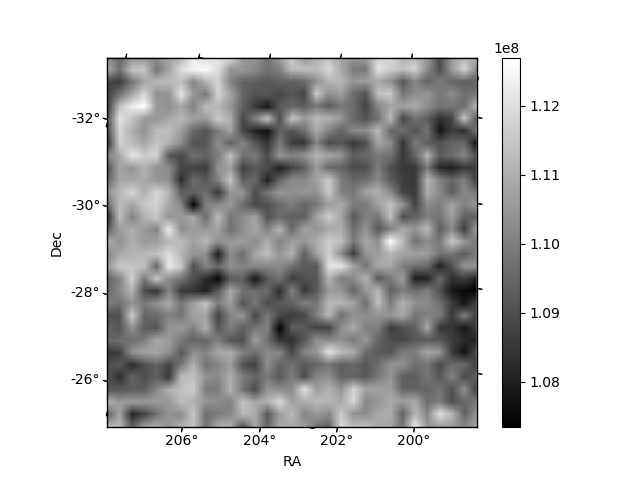
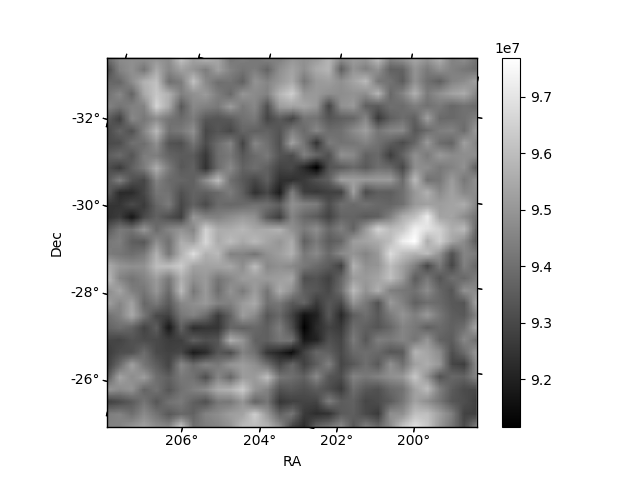
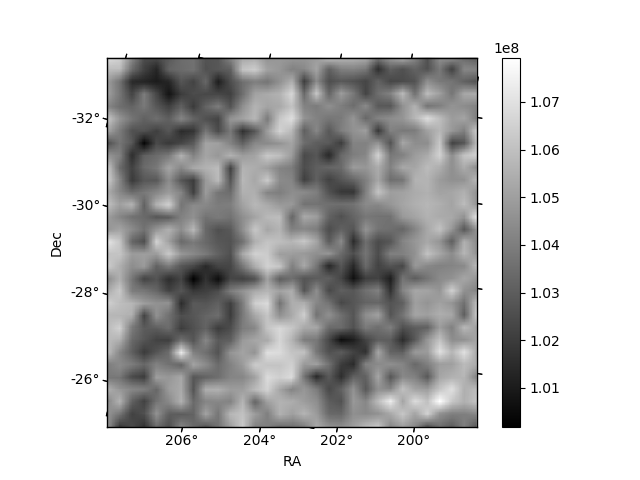
Histogram calculated using DETX and DETY for each event in the final _common_clean file
| Quadrant A | 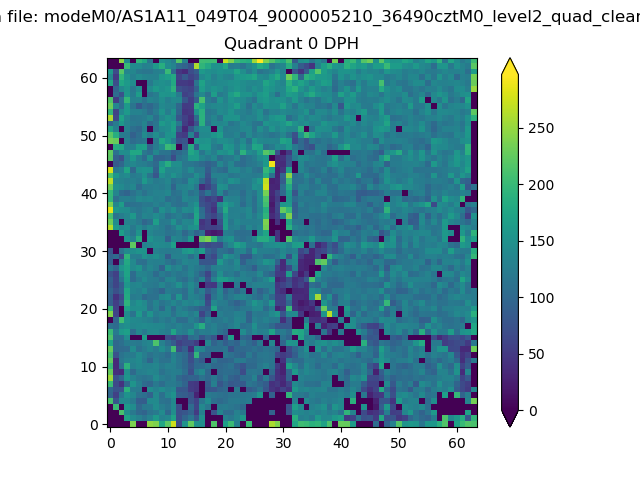 |
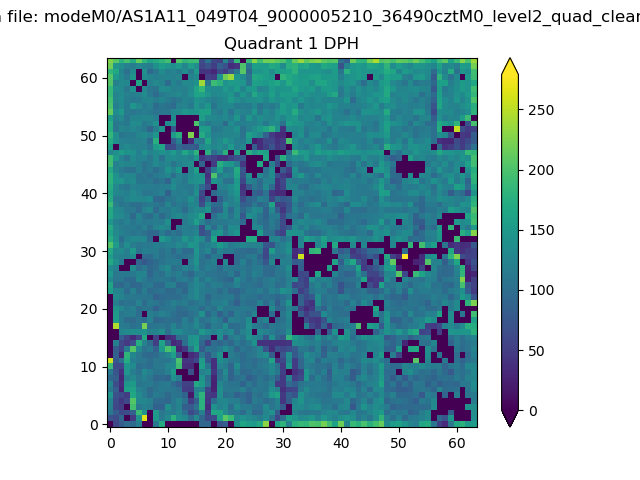 |
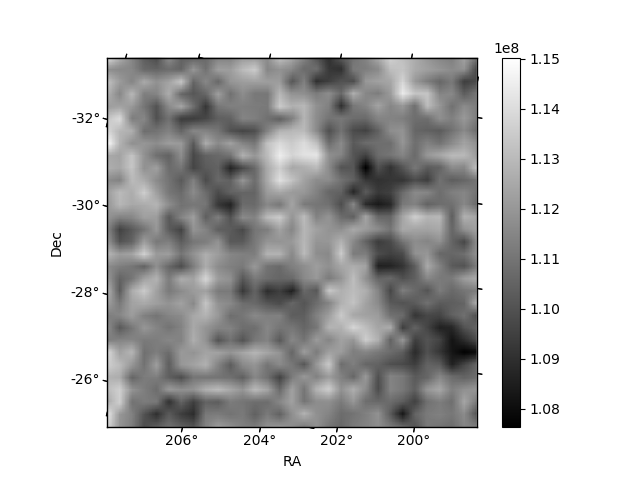
Quadrant B |
|---|---|---|---|
| Quadrant D | 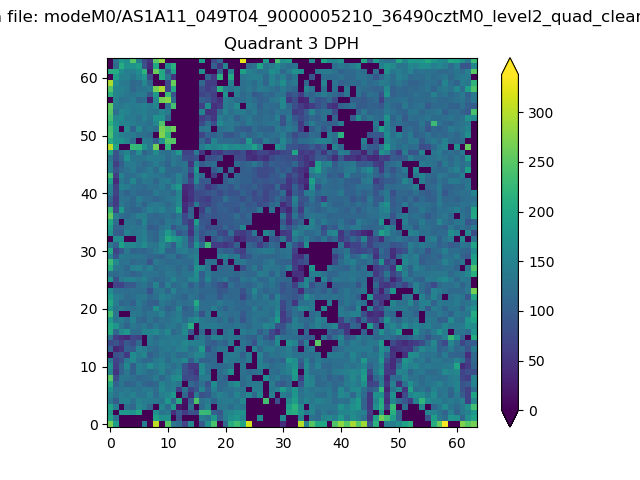 |
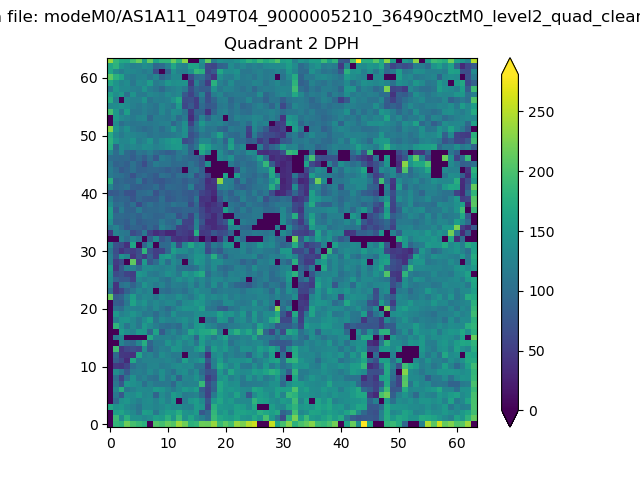 |
Quadrant C |
| Plot type | Count rate plots | Images |
|---|---|---|
| Comparison with Poisson distribution Blue bars denote a histogram of data divided into 1 sec bins. Red curve is a Poisson curve with rate = median count rate of data. |
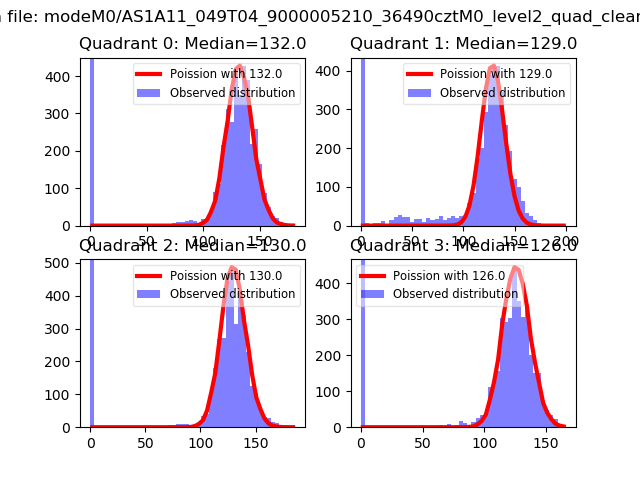 |
 |
| Quadrant-wise count rates Data is divided into 100 sec bins |
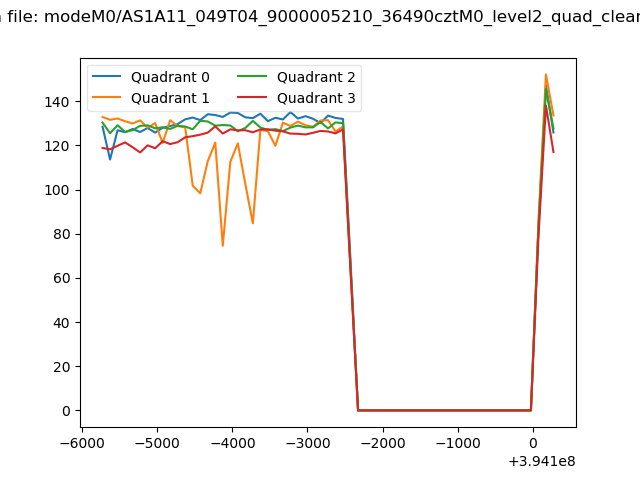 |
|
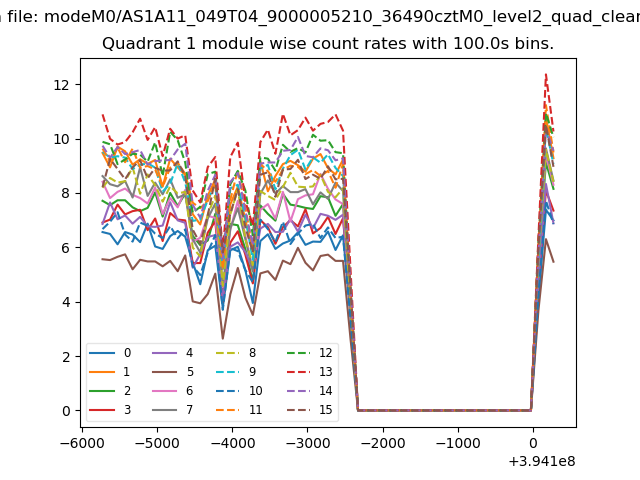
| Module-wise count rates for Quadrant A Data is divided into 100 sec bins |
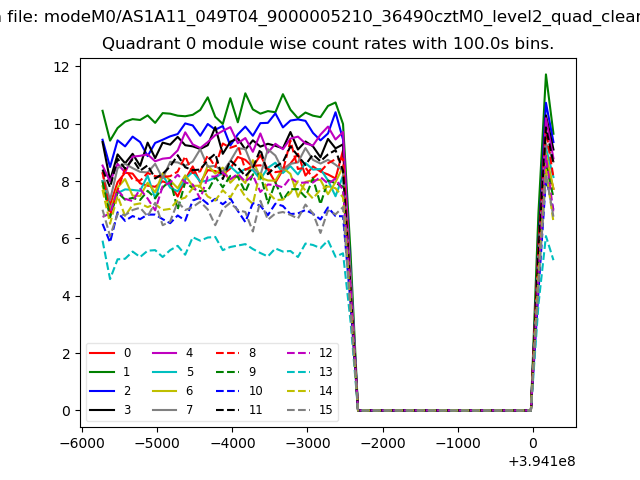 |
 |
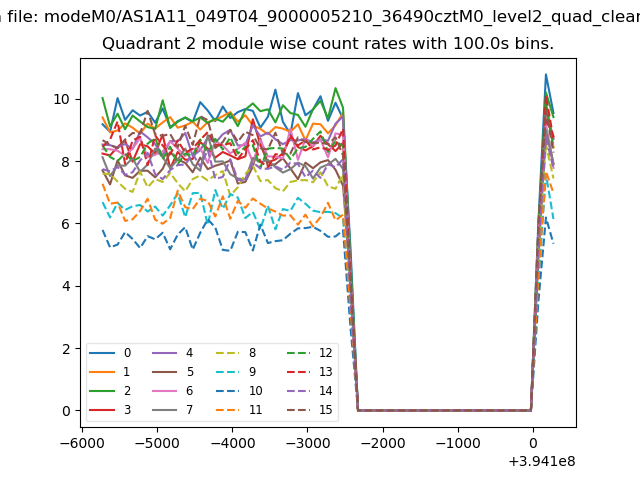
| Module-wise count rates for Quadrant B Data is divided into 100 sec bins |
 |
 |
| Module-wise count rates for Quadrant C Data is divided into 100 sec bins |
 |
 |
| Module-wise count rates for Quadrant D Data is divided into 100 sec bins |
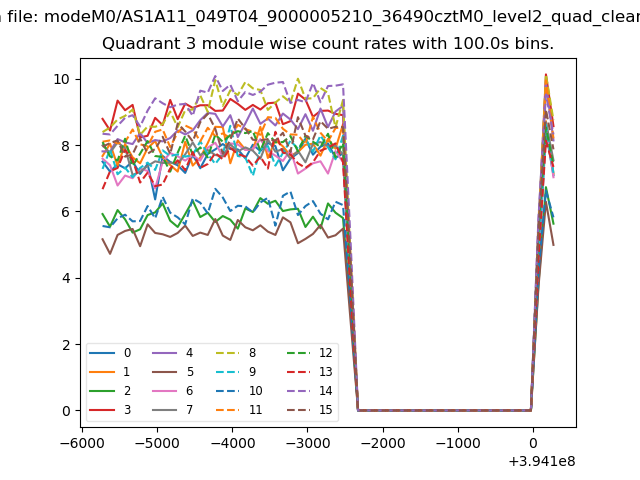 |
 |
| Parameter | Plot |
|---|---|
| CZT HV Monitor | 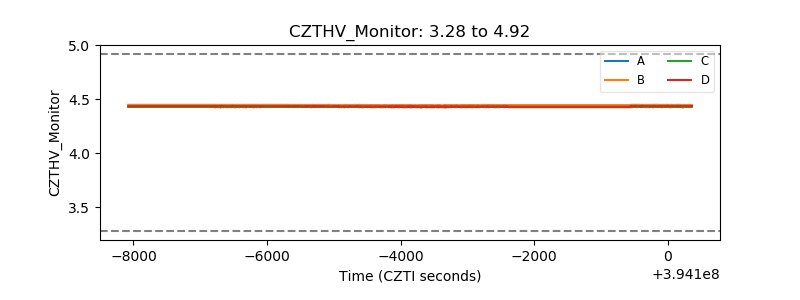 |
| D_VDD | 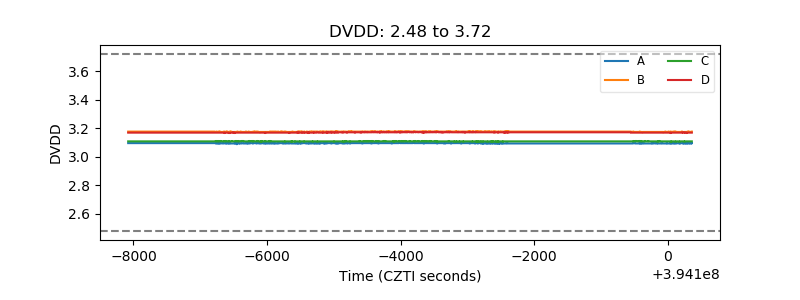 |
| Temperature 1 | 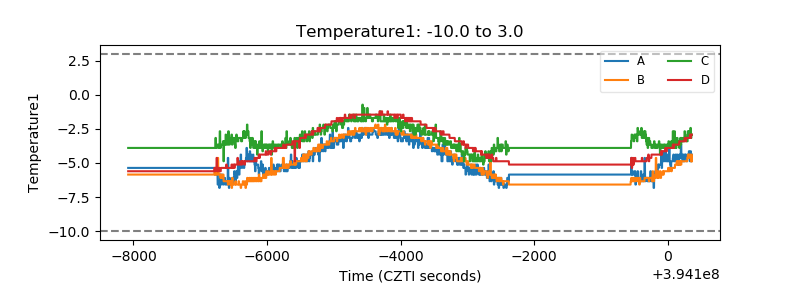 |
| Veto HV Monitor | 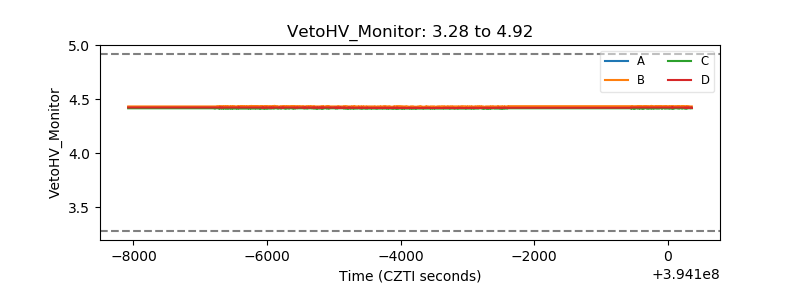 |
| Veto LLD | 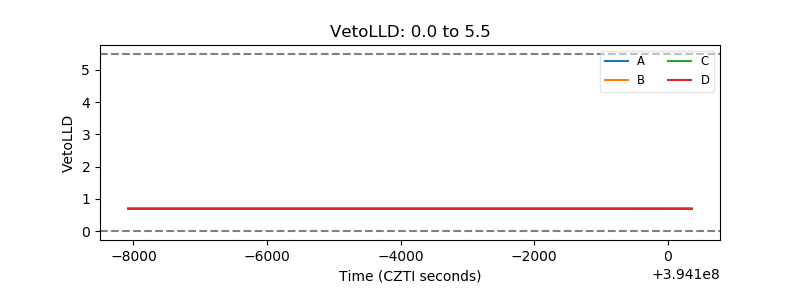 |
| Alpha Counter | 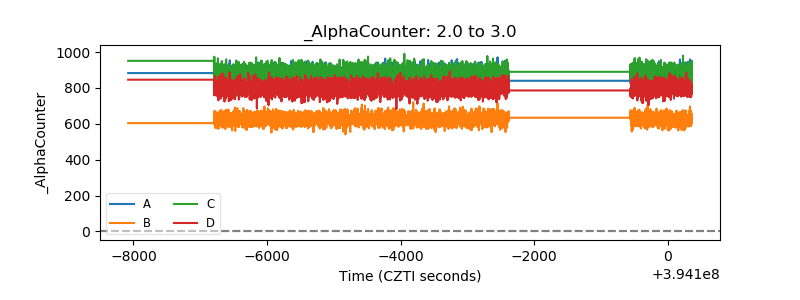 |
| _CPM_Rate | 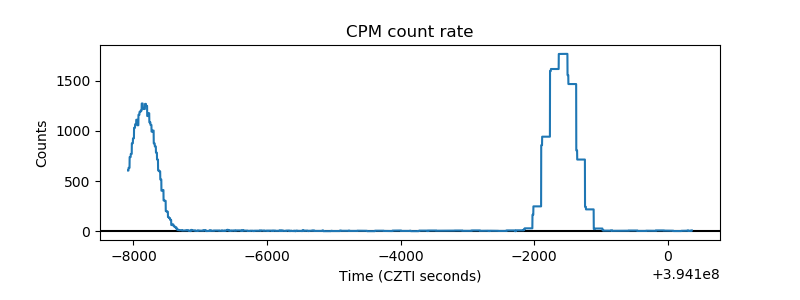 |
| CZT Counter | 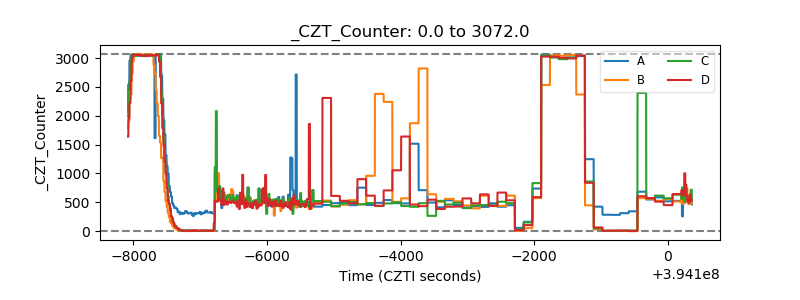 |
| +2.5 Volts monitor | 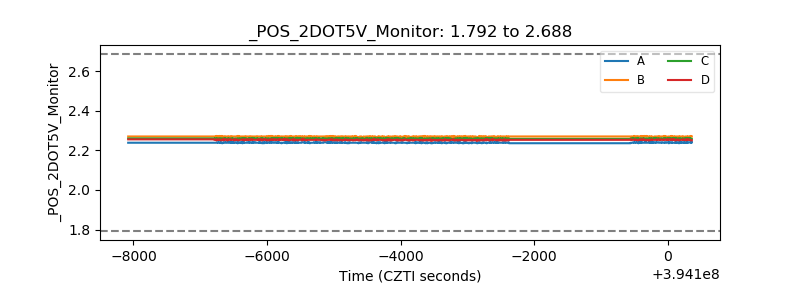 |
| +5 Volts monitor | 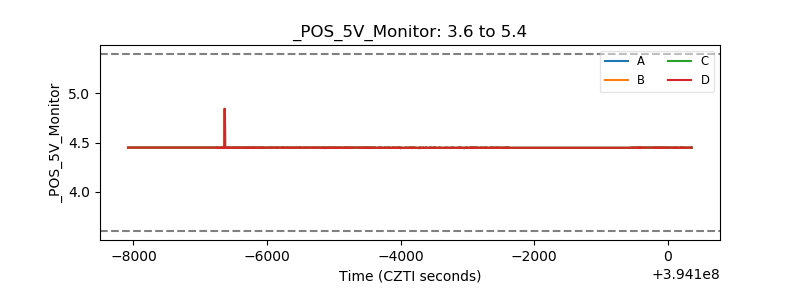 |
| _ROLL_ROT | 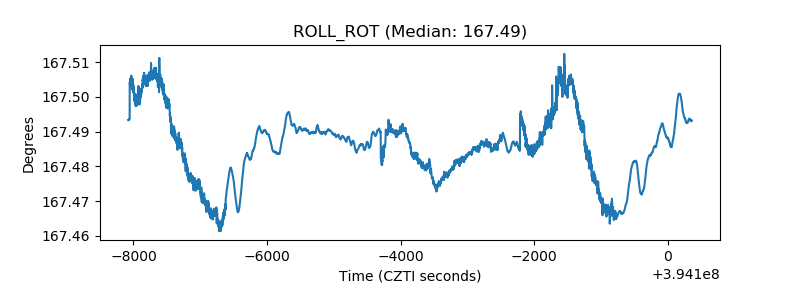 |
| _Roll_DEC | 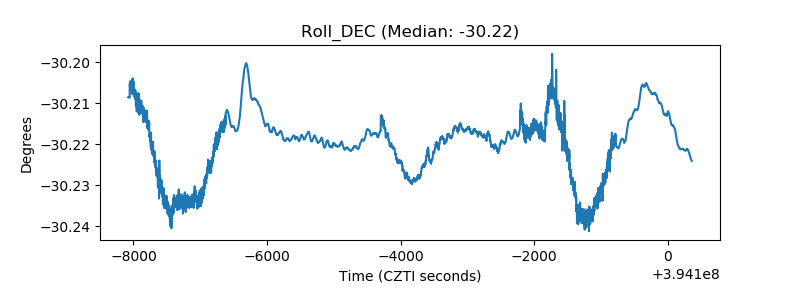 |
| _Roll_RA | 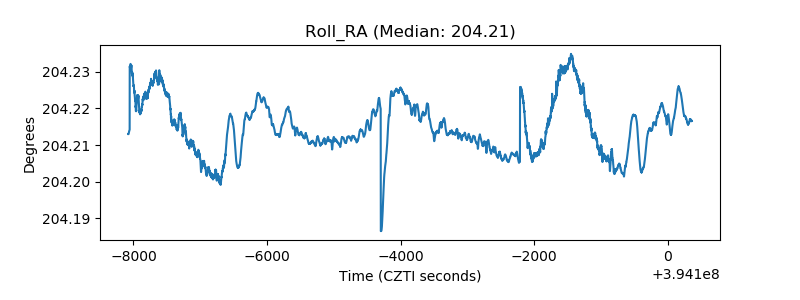 |
| Veto Counter | 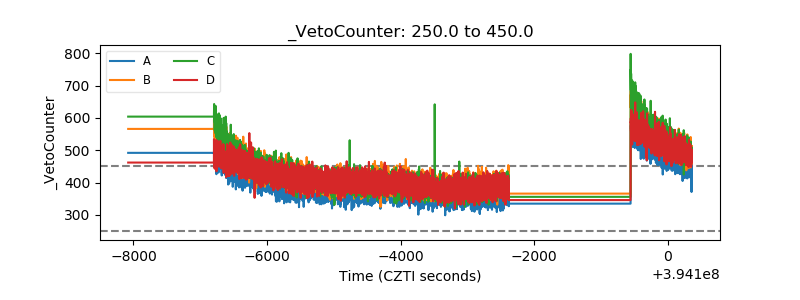 |