| Param | Original file | Final file |
|---|---|---|
| Filename | modeM0/AS1A11_049T03_9000005208_36481cztM0_level2.evt | modeM0/AS1A11_049T03_9000005208_36481cztM0_level2_quad_clean.evt |
| Size (bytes) | 441,924,480 | 64,635,840 |
| Size | 421.5 MB | 61.6 MB |
| Events in quadrant A | 2,554,538 | 415,463 |
| Events in quadrant B | 2,842,075 | 406,342 |
| Events in quadrant C | 4,707,336 | 378,021 |
| Events in quadrant D | 2,922,075 | 388,123 |
| Mode M9 | |||
|---|---|---|---|
| Quadrant | BADHDUFLAG | Total packets | Discarded packets |
| A | 0 | 24 | 0 |
| B | 0 | 24 | 0 |
| C | 0 | 24 | 0 |
| D | 0 | 25 | 0 |
| Mode M0 | |||
|---|---|---|---|
| Quadrant | BADHDUFLAG | Total packets | Discarded packets |
| A | 0 | 11035 | 3 |
| B | 0 | 11924 | 2 |
| C | 0 | 17536 | 2 |
| D | 0 | 12398 | 2 |
| Mode SS | |||
|---|---|---|---|
| Quadrant | BADHDUFLAG | Total packets | Discarded packets |
| A | 0 | 108 | 0 |
| B | 0 | 108 | 0 |
| C | 0 | 108 | 0 |
| D | 0 | 108 | 0 |
| Quadrant | Total seconds | Saturated seconds | Saturation percentage |
|---|---|---|---|
| A | 5265 | 13 | 0.246914% |
| B | 5265 | 29 | 0.550807% |
| C | 5265 | 407 | 7.730294% |
| D | 5265 | 112 | 2.127255% |
Noise dominated data is calculated using 1-second bins in cleaned event files. If a bin has >2000 counts, and if more than 50% of those come from <1% of pixels, then it is considered to be noise-dominated and hence unusable.
| Quadrant | # 1 sec bins | Bins with >0 counts | Bins with >2000 counts | High rate bins dominated by noise | Noise dominated (total time) | Noise dominated (detector-on time) | Marked lightcurve |
|---|---|---|---|---|---|---|---|
| A | 7147 | 5266 | 3 | 3 | 0.04% | 0.06% | 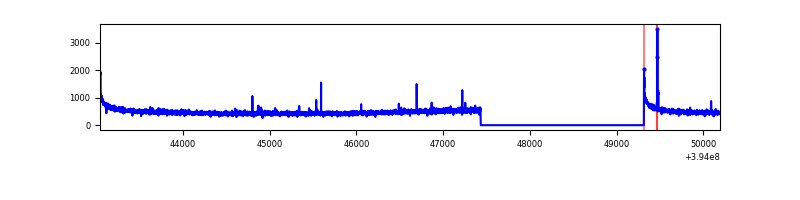 |
| B | 7147 | 5266 | 22 | 22 | 0.31% | 0.42% | 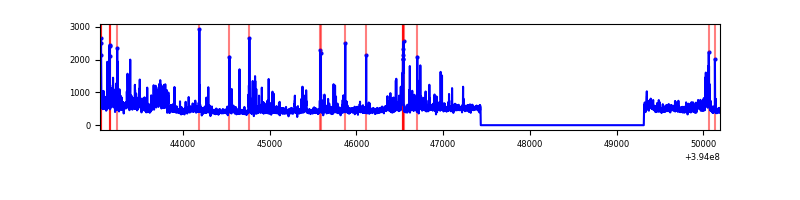 |
| C | 7147 | 5266 | 367 | 367 | 5.14% | 6.97% | 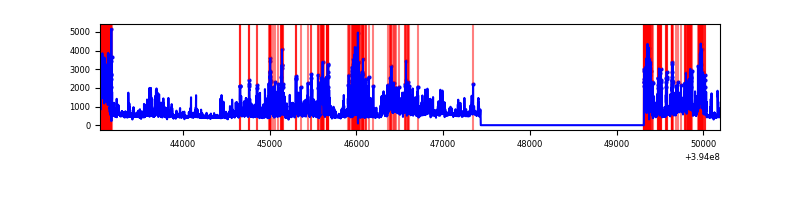 |
| D | 7147 | 5266 | 104 | 104 | 1.46% | 1.97% | 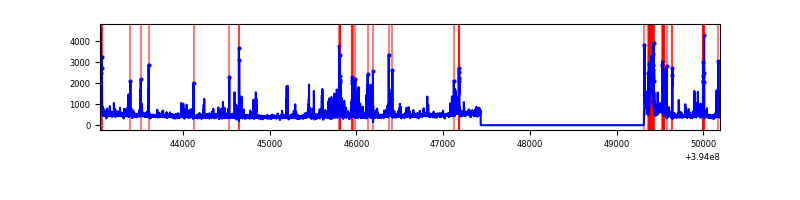 |
Top three noisy pixels from each quadrant. If the there are fewer than three noisy pixels in the level2.evt file, extra rows are filled as -1
| Pixel properties | Quadrant properties | ||||||
|---|---|---|---|---|---|---|---|
| Quadrant | DetID | PixID | Counts | Sigma | Mean | Median | Sigma |
| A | 10 | 83 | 198048 | 1616.41 | 599 | 589 | 122.2 |
| A | 9 | 143 | 14669 | 115.26 | 599 | 589 | 122.2 |
| A | 13 | 254 | 9980 | 76.88 | 599 | 589 | 122.2 |
| B | 5 | 172 | 228976 | 2012.64 | 590 | 575 | 113.5 |
| B | 5 | 255 | 128827 | 1130.14 | 590 | 575 | 113.5 |
| B | 0 | 213 | 44800 | 389.71 | 590 | 575 | 113.5 |
| C | 4 | 254 | 1421896 | 11107.65 | 552 | 556 | 128.0 |
| C | 0 | 10 | 483815 | 3776.62 | 552 | 556 | 128.0 |
| C | 0 | 207 | 419711 | 3275.66 | 552 | 556 | 128.0 |
| D | 13 | 249 | 434932 | 3116.29 | 570 | 554 | 139.4 |
| D | 2 | 250 | 142782 | 1020.37 | 570 | 554 | 139.4 |
| D | 2 | 153 | 46310 | 328.26 | 570 | 554 | 139.4 |
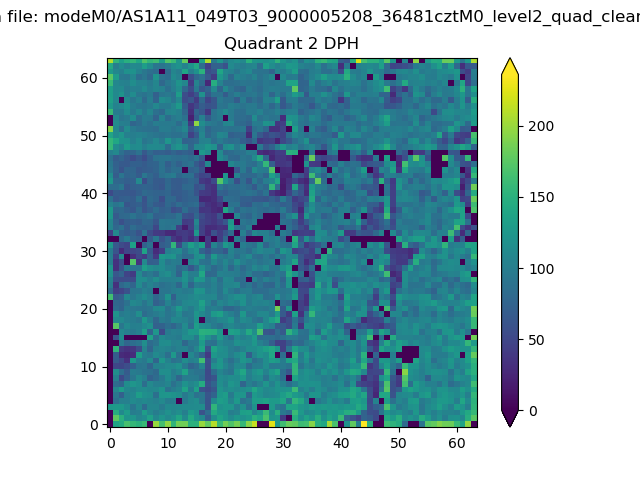
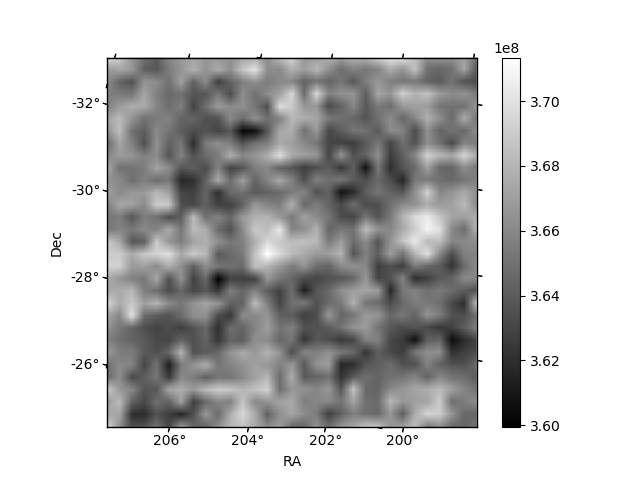
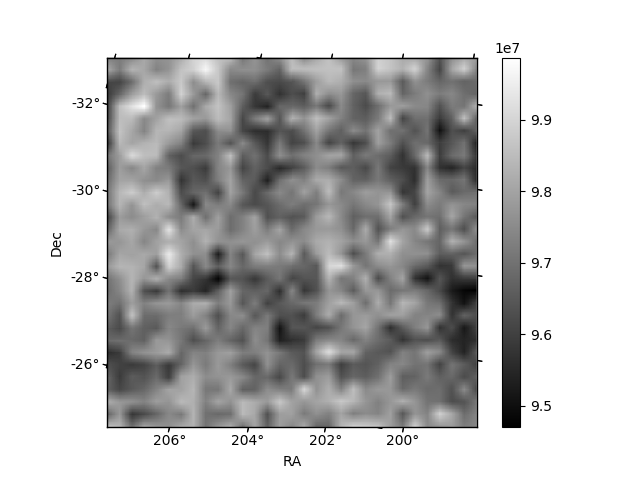
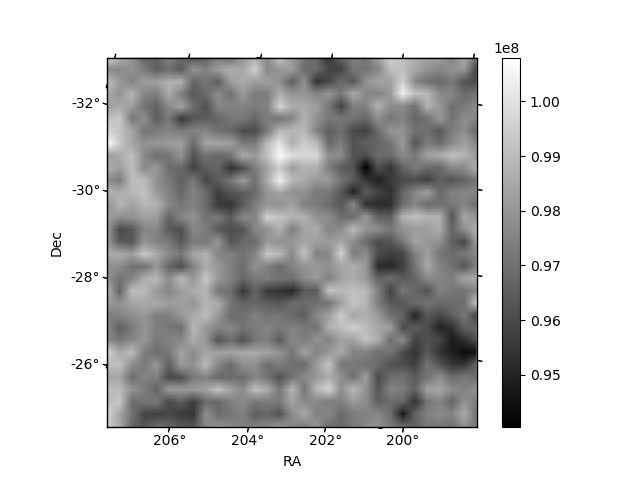
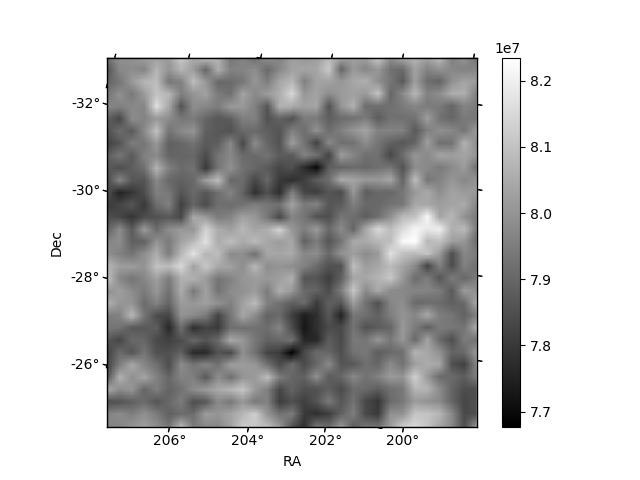
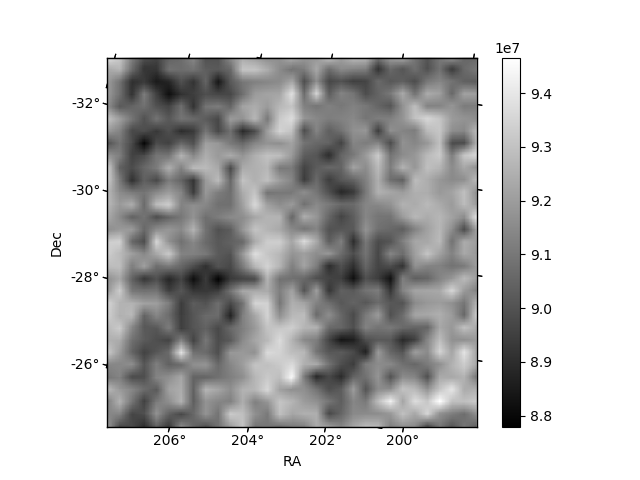
Histogram calculated using DETX and DETY for each event in the final _common_clean file
| Quadrant A | 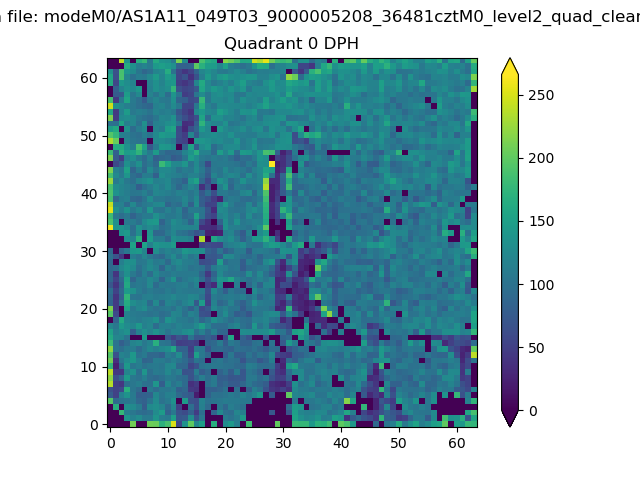 |
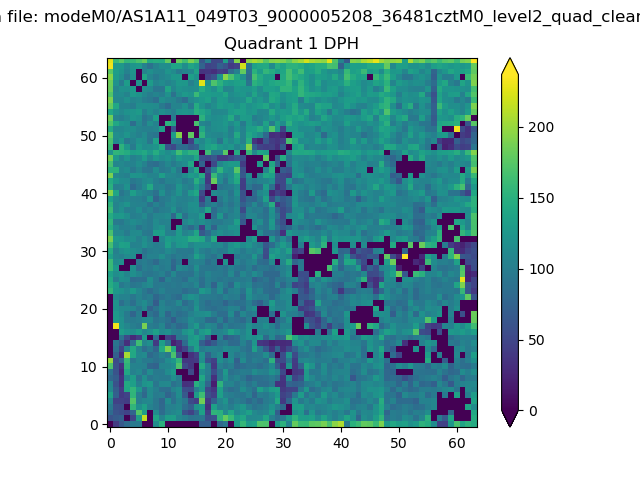 |
Quadrant B |
|---|---|---|---|
| Quadrant D | 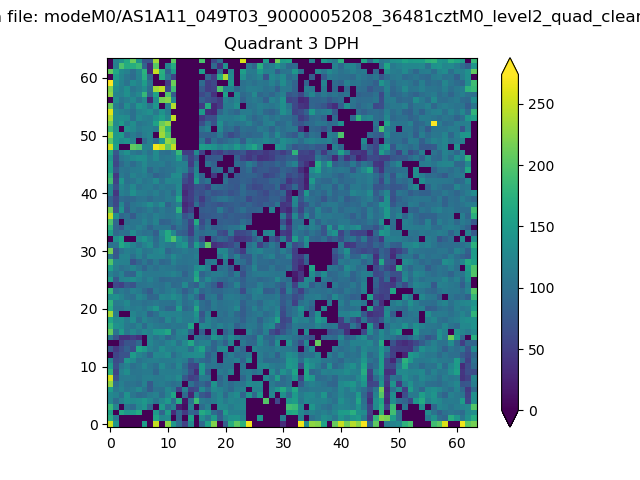 |
 |
Quadrant C |
| Plot type | Count rate plots | Images |
|---|---|---|
| Comparison with Poisson distribution Blue bars denote a histogram of data divided into 1 sec bins. Red curve is a Poisson curve with rate = median count rate of data. |
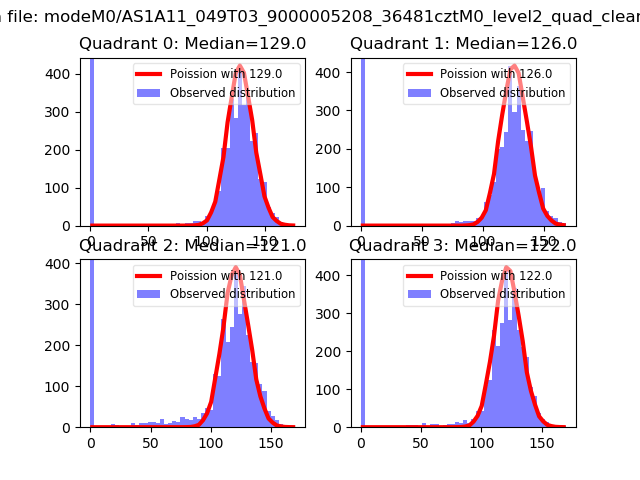 |
 |
| Quadrant-wise count rates Data is divided into 100 sec bins |
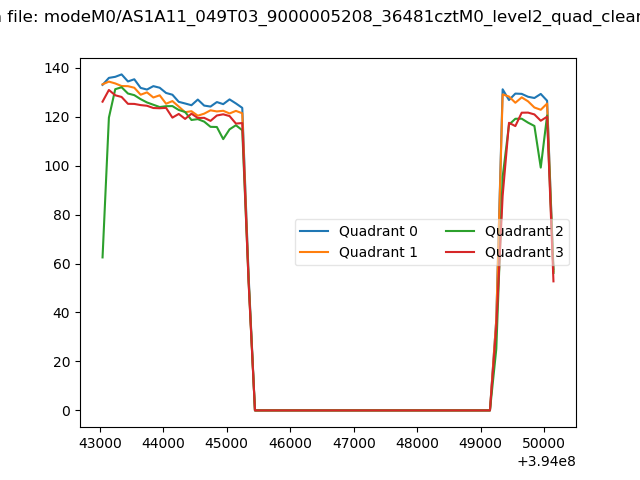 |
|
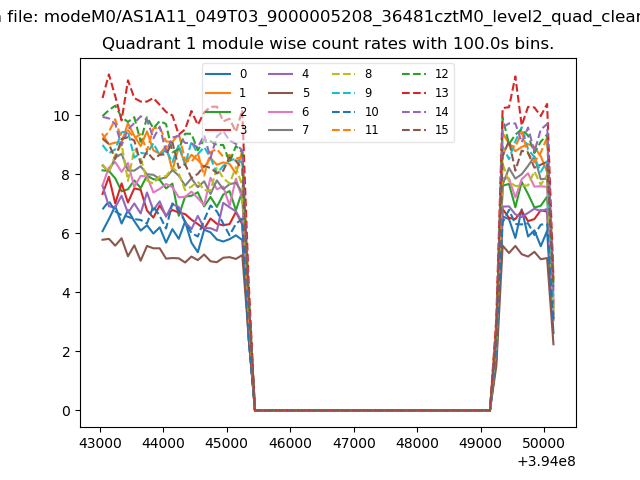
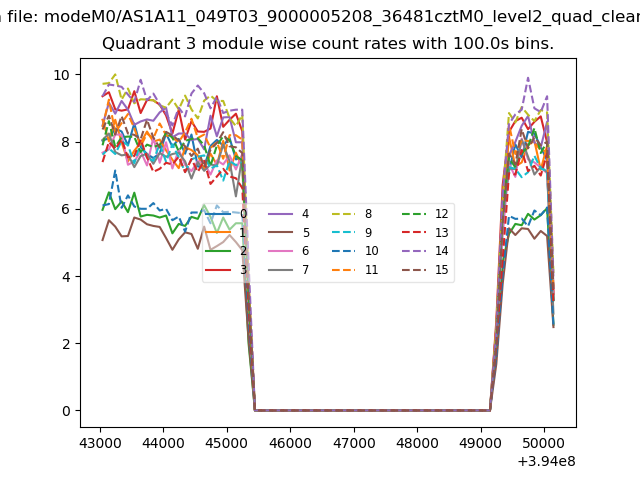
| Module-wise count rates for Quadrant A Data is divided into 100 sec bins |
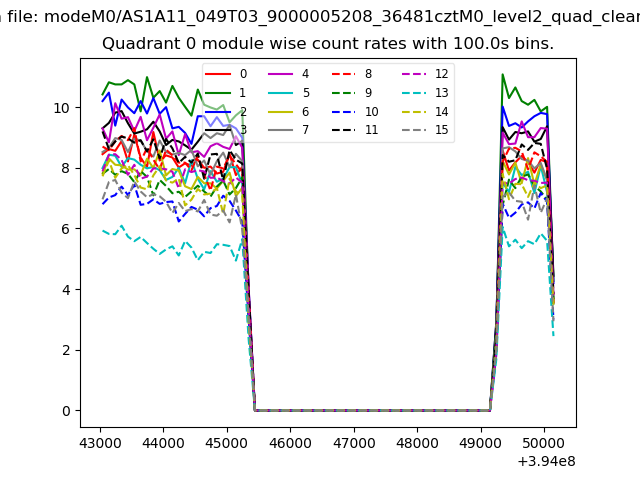 |
 |
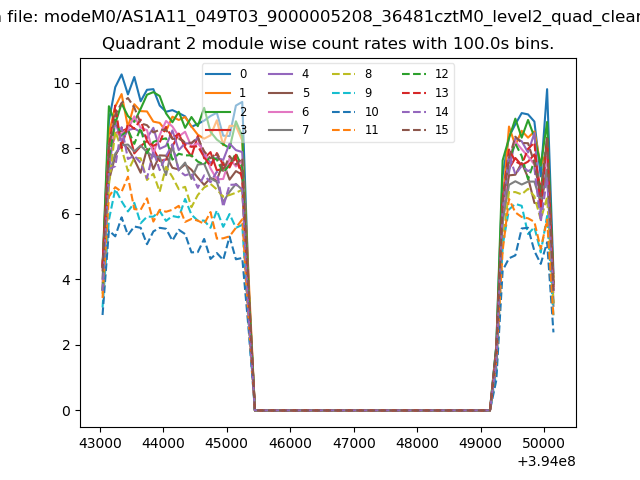
| Module-wise count rates for Quadrant B Data is divided into 100 sec bins |
 |
 |
| Module-wise count rates for Quadrant C Data is divided into 100 sec bins |
 |
 |
| Module-wise count rates for Quadrant D Data is divided into 100 sec bins |
 |
 |
| Parameter | Plot |
|---|---|
| CZT HV Monitor | 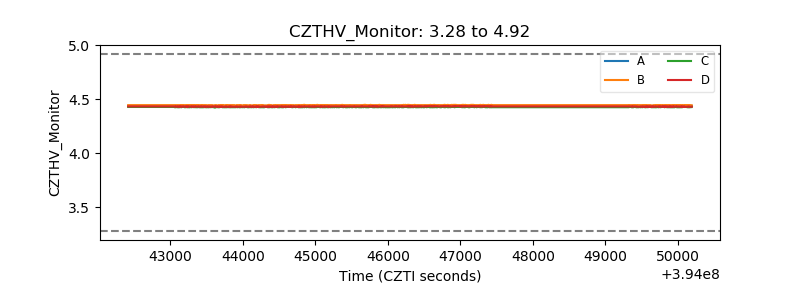 |
| D_VDD | 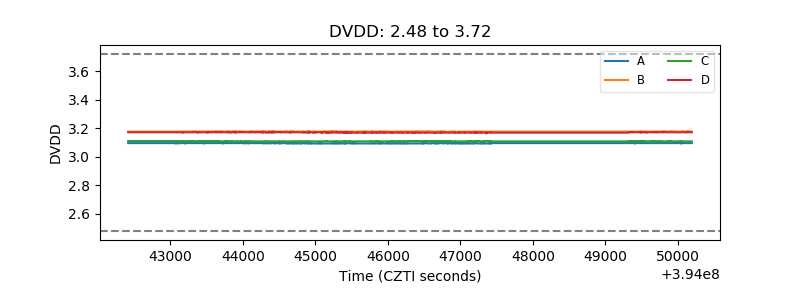 |
| Temperature 1 | 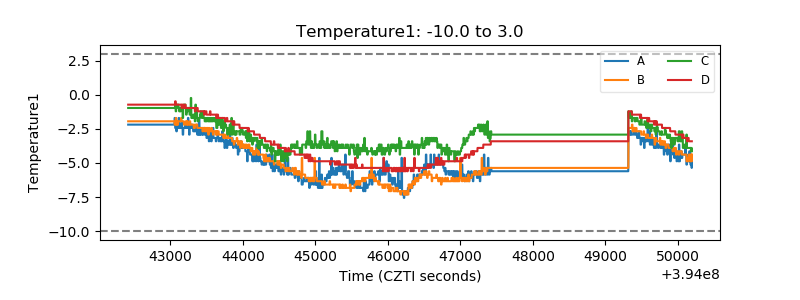 |
| Veto HV Monitor | 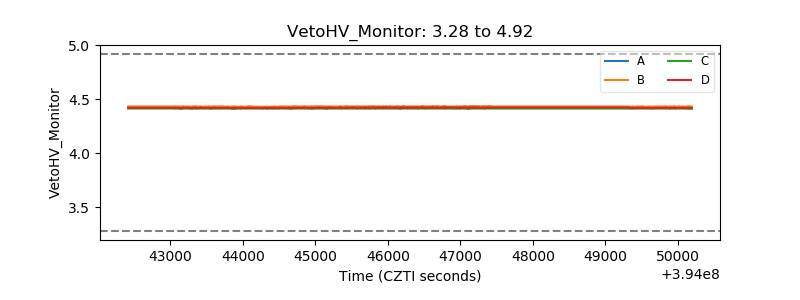 |
| Veto LLD | 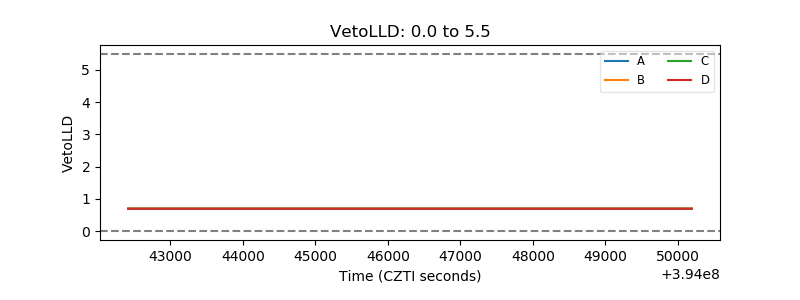 |
| Alpha Counter | 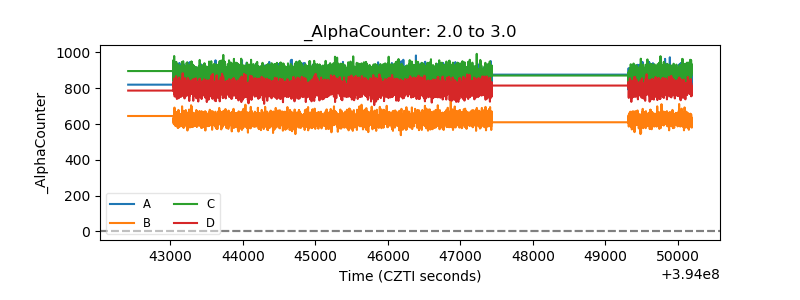 |
| _CPM_Rate | 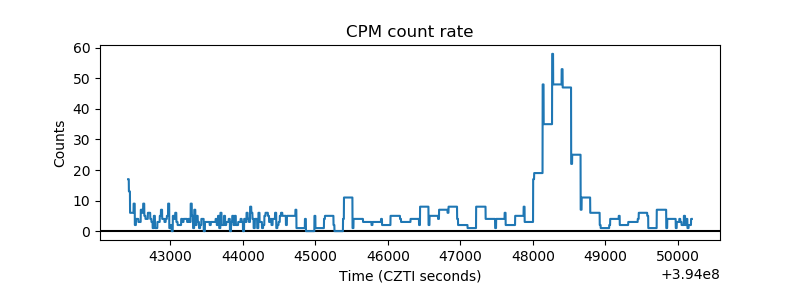 |
| CZT Counter | 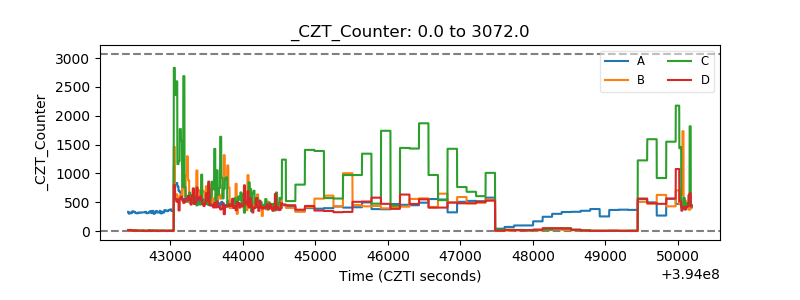 |
| +2.5 Volts monitor | 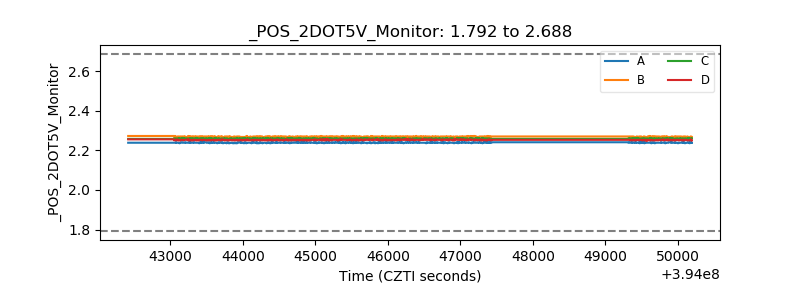 |
| +5 Volts monitor | 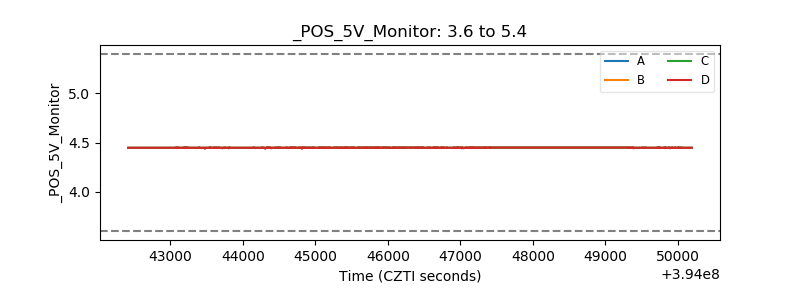 |
| _ROLL_ROT | 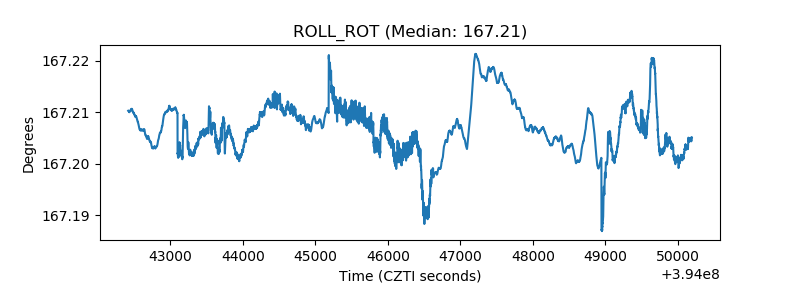 |
| _Roll_DEC | 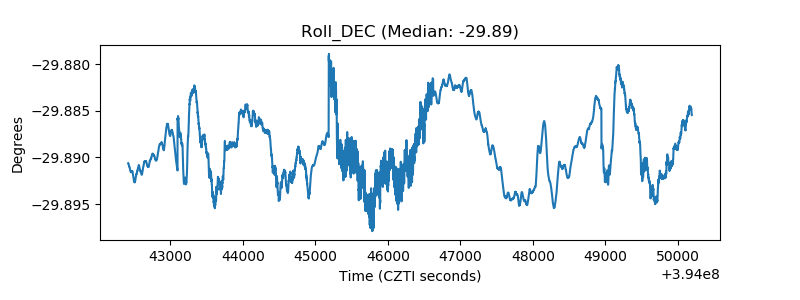 |
| _Roll_RA | 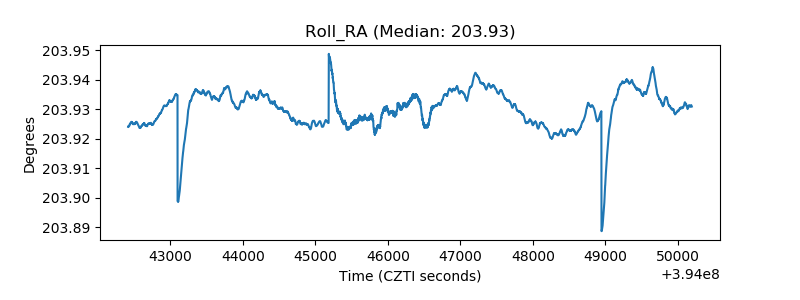 |
| Veto Counter | 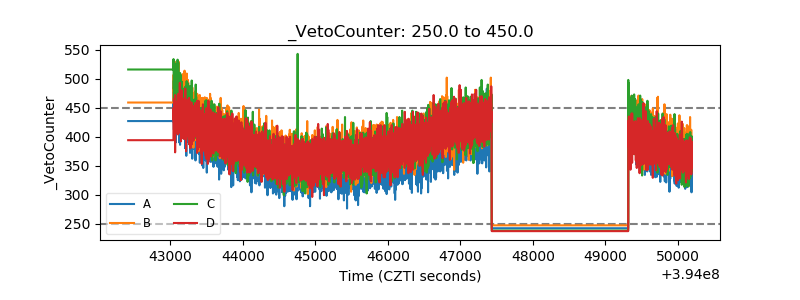 |