| Param | Original file | Final file |
|---|---|---|
| Filename | modeM0/AS1A11_049T03_9000005208_36476cztM0_level2.evt | modeM0/AS1A11_049T03_9000005208_36476cztM0_level2_quad_clean.evt |
| Size (bytes) | 137,577,600 | 29,701,440 |
| Size | 131.2 MB | 28.3 MB |
| Events in quadrant A | 980,117 | 196,273 |
| Events in quadrant B | 981,891 | 197,604 |
| Events in quadrant C | 1,098,119 | 193,030 |
| Events in quadrant D | 986,991 | 185,842 |
| Mode M9 | |||
|---|---|---|---|
| Quadrant | BADHDUFLAG | Total packets | Discarded packets |
| A | 0 | 19 | 0 |
| B | 0 | 19 | 0 |
| C | 0 | 19 | 0 |
| D | 0 | 19 | 0 |
| Mode M0 | |||
|---|---|---|---|
| Quadrant | BADHDUFLAG | Total packets | Discarded packets |
| A | 0 | 4046 | 2 |
| B | 0 | 3952 | 1 |
| C | 0 | 4387 | 1 |
| D | 0 | 4026 | 1 |
| Mode SS | |||
|---|---|---|---|
| Quadrant | BADHDUFLAG | Total packets | Discarded packets |
| A | 0 | 36 | 0 |
| B | 0 | 36 | 0 |
| C | 0 | 36 | 0 |
| D | 0 | 36 | 0 |
| Quadrant | Total seconds | Saturated seconds | Saturation percentage |
|---|---|---|---|
| A | 1723 | 5 | 0.290192% |
| B | 1723 | 13 | 0.754498% |
| C | 1723 | 59 | 3.424260% |
| D | 1723 | 19 | 1.102728% |
Noise dominated data is calculated using 1-second bins in cleaned event files. If a bin has >2000 counts, and if more than 50% of those come from <1% of pixels, then it is considered to be noise-dominated and hence unusable.
| Quadrant | # 1 sec bins | Bins with >0 counts | Bins with >2000 counts | High rate bins dominated by noise | Noise dominated (total time) | Noise dominated (detector-on time) | Marked lightcurve |
|---|---|---|---|---|---|---|---|
| A | 3605 | 1724 | 1 | 1 | 0.03% | 0.06% | 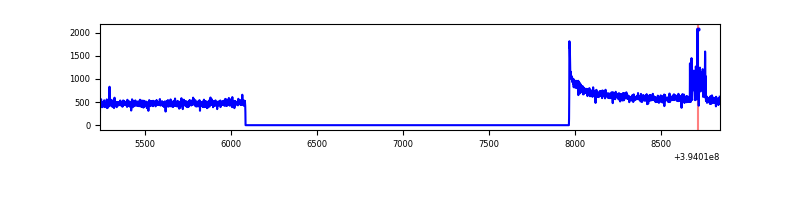 |
| B | 3605 | 1724 | 7 | 7 | 0.19% | 0.41% | 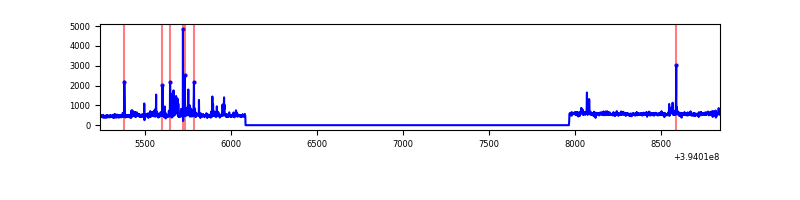 |
| C | 3605 | 1724 | 31 | 31 | 0.86% | 1.80% | 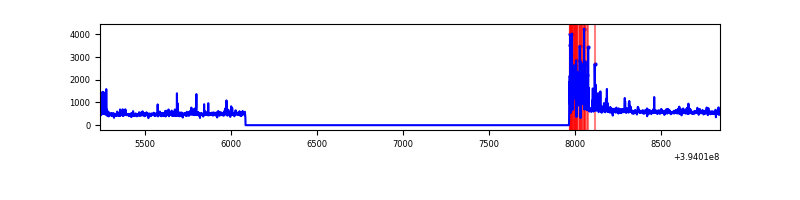 |
| D | 3605 | 1724 | 14 | 14 | 0.39% | 0.81% | 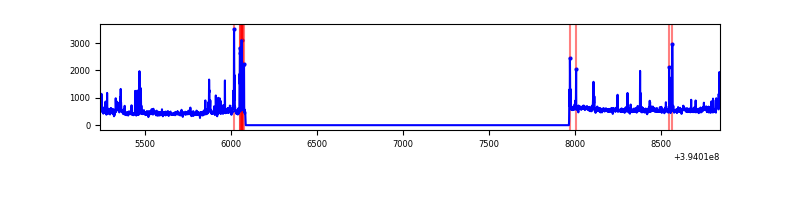 |
Top three noisy pixels from each quadrant. If the there are fewer than three noisy pixels in the level2.evt file, extra rows are filled as -1
| Pixel properties | Quadrant properties | ||||||
|---|---|---|---|---|---|---|---|
| Quadrant | DetID | PixID | Counts | Sigma | Mean | Median | Sigma |
| A | 10 | 83 | 79100 | 1718.87 | 223 | 219 | 45.9 |
| A | 10 | 248 | 35379 | 766.15 | 223 | 219 | 45.9 |
| A | 13 | 254 | 3026 | 61.16 | 223 | 219 | 45.9 |
| B | 5 | 255 | 61367 | 1396.29 | 220 | 214 | 43.8 |
| B | 0 | 189 | 16602 | 374.18 | 220 | 214 | 43.8 |
| B | 4 | 171 | 10991 | 246.07 | 220 | 214 | 43.8 |
| C | 0 | 10 | 199878 | 3965.78 | 210 | 212 | 50.3 |
| C | 15 | 214 | 75749 | 1500.32 | 210 | 212 | 50.3 |
| C | 1 | 16 | 1545 | 26.48 | 210 | 212 | 50.3 |
| D | 12 | 235 | 47440 | 892.96 | 214 | 208 | 52.9 |
| D | 13 | 249 | 40470 | 761.18 | 214 | 208 | 52.9 |
| D | 2 | 250 | 18506 | 345.94 | 214 | 208 | 52.9 |
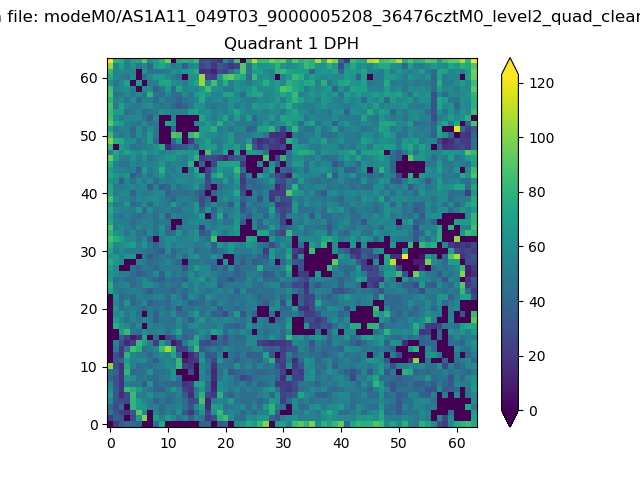
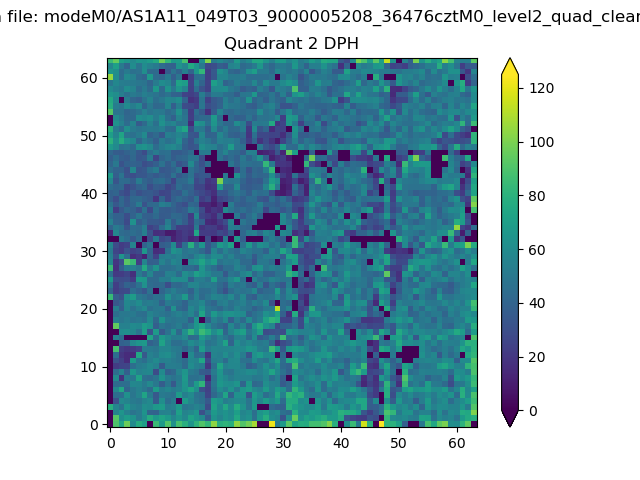
Histogram calculated using DETX and DETY for each event in the final _common_clean file
| Quadrant A | 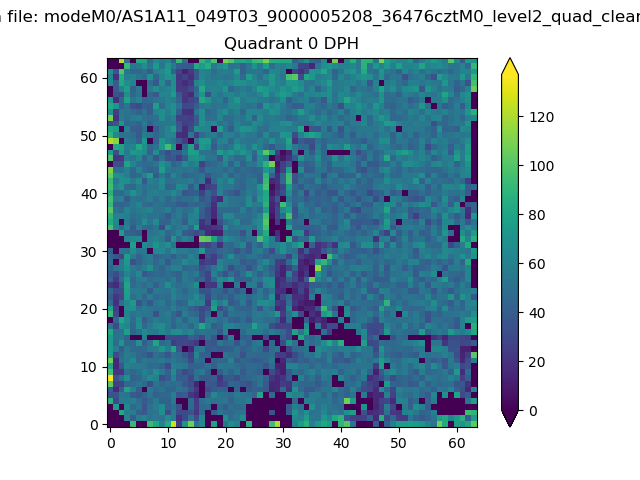 |
 |
Quadrant B |
|---|---|---|---|
| Quadrant D | 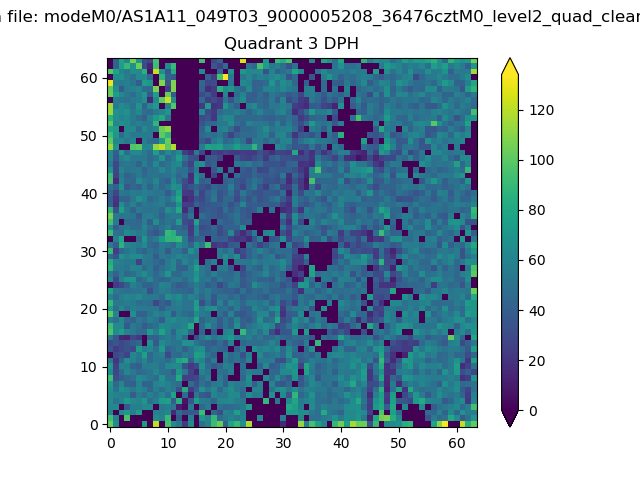 |
 |
Quadrant C |
| Plot type | Count rate plots | Images |
|---|---|---|
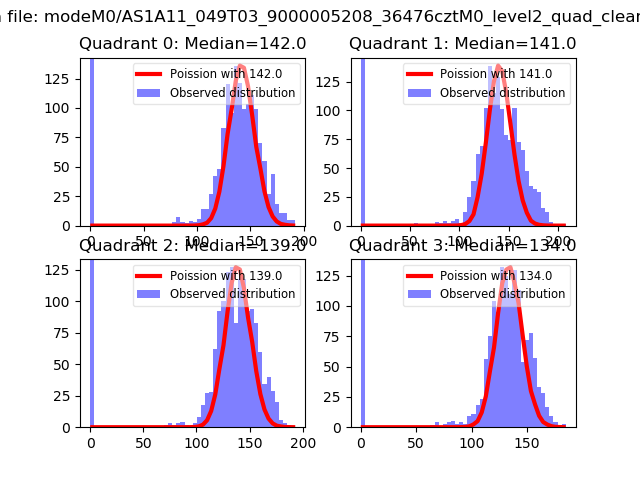
| Comparison with Poisson distribution Blue bars denote a histogram of data divided into 1 sec bins. Red curve is a Poisson curve with rate = median count rate of data. |
 |
 |
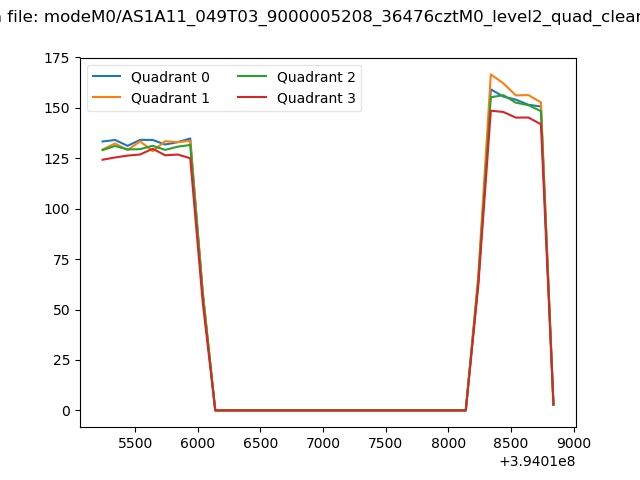
| Quadrant-wise count rates Data is divided into 100 sec bins |
 |
|
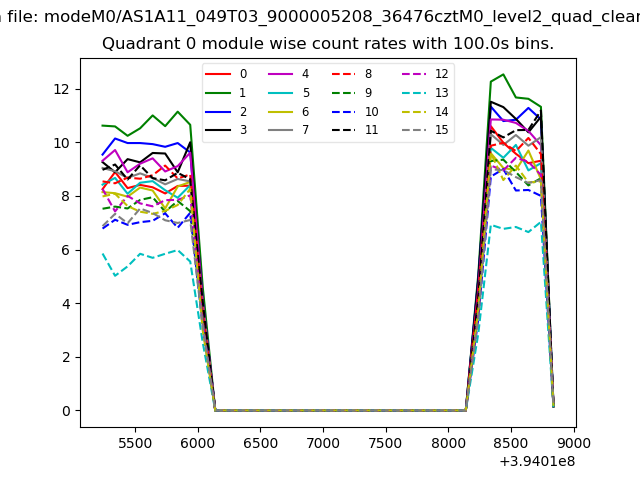
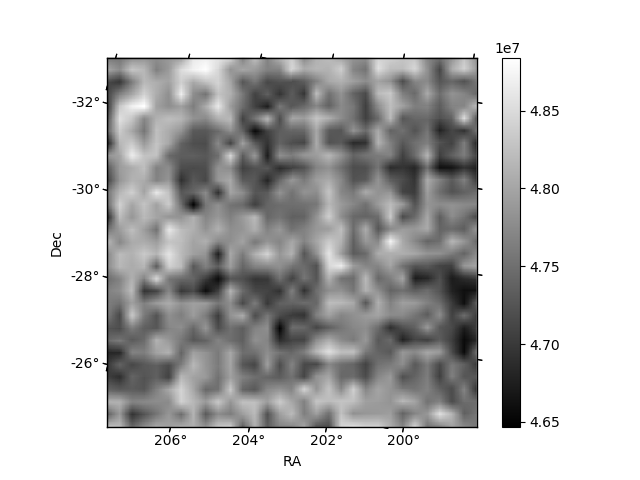
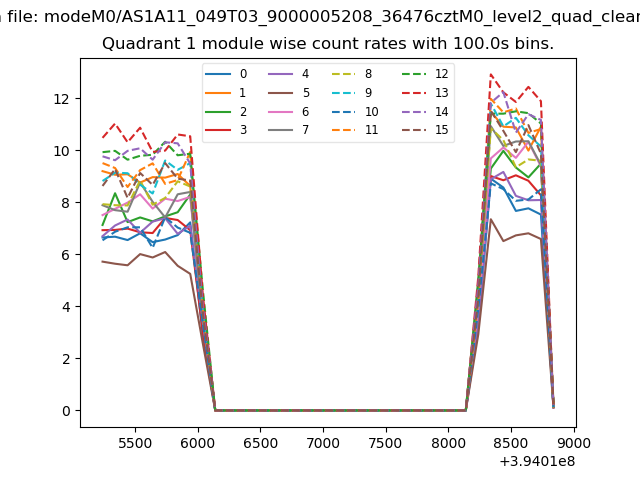
| Module-wise count rates for Quadrant A Data is divided into 100 sec bins |
 |
 |
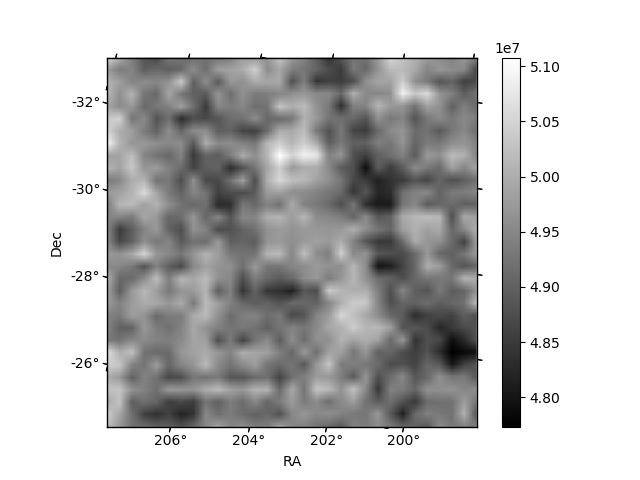
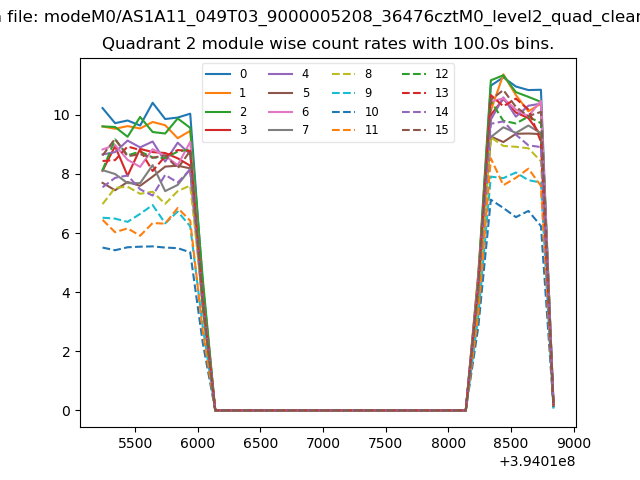
| Module-wise count rates for Quadrant B Data is divided into 100 sec bins |
 |
 |
| Module-wise count rates for Quadrant C Data is divided into 100 sec bins |
 |
 |
| Module-wise count rates for Quadrant D Data is divided into 100 sec bins |
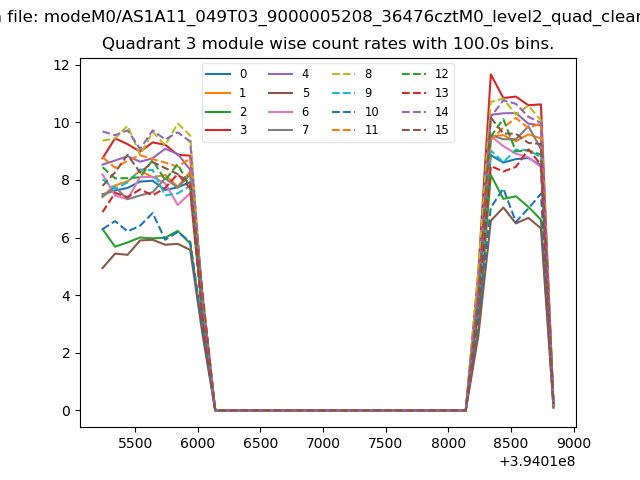 |
 |
| Parameter | Plot |
|---|---|
| CZT HV Monitor | 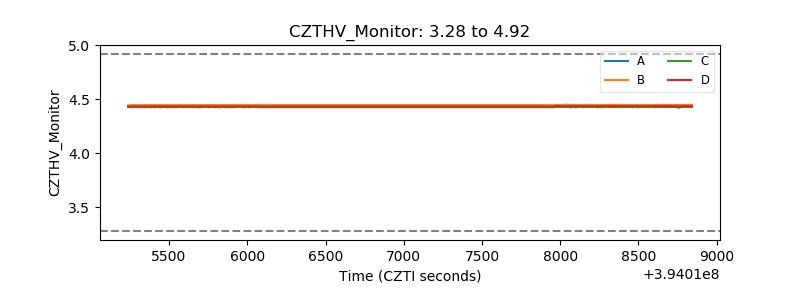 |
| D_VDD |  |
| Temperature 1 |  |
| Veto HV Monitor |  |
| Veto LLD |  |
| Alpha Counter | 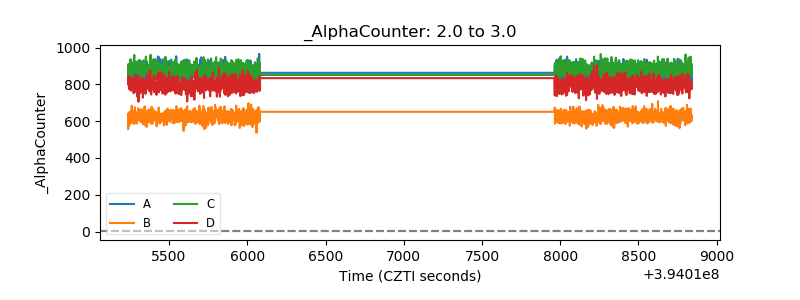 |
| _CPM_Rate | 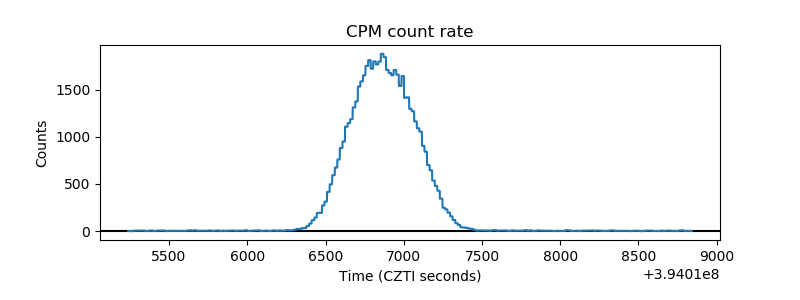 |
| CZT Counter | 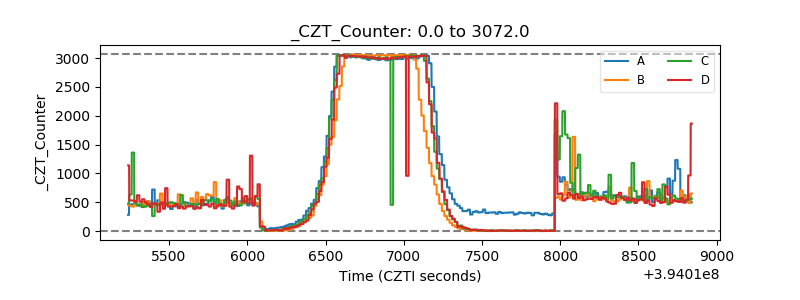 |
| +2.5 Volts monitor | 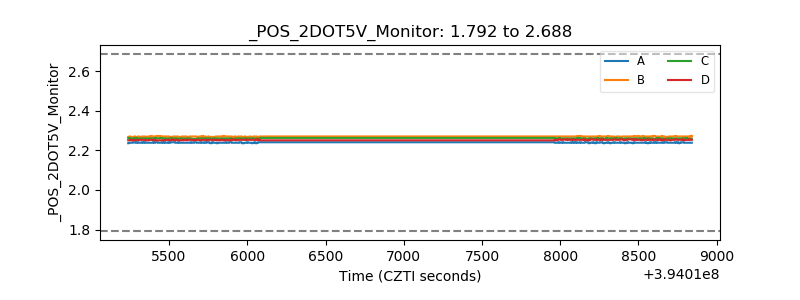 |
| +5 Volts monitor | 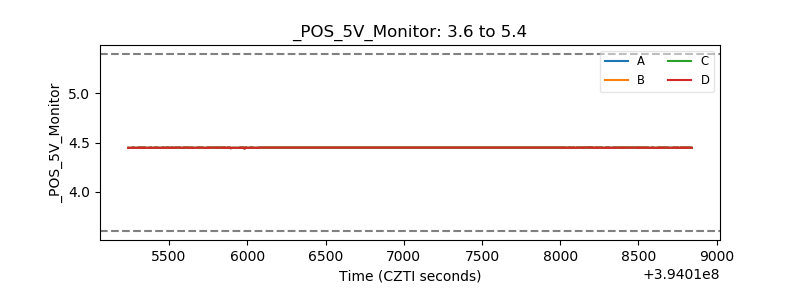 |
| _ROLL_ROT | 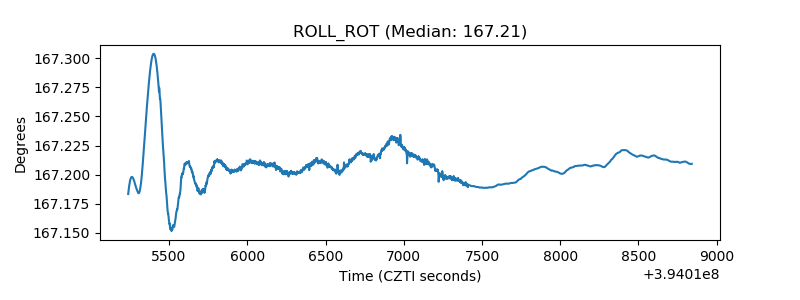 |
| _Roll_DEC | 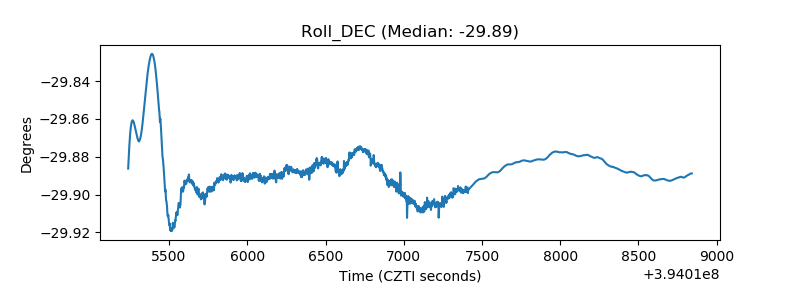 |
| _Roll_RA | 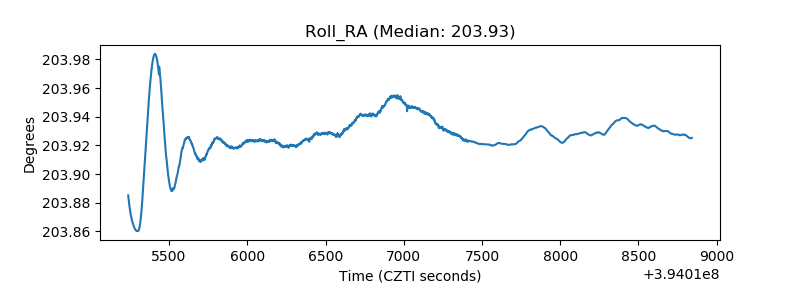 |
| Veto Counter | 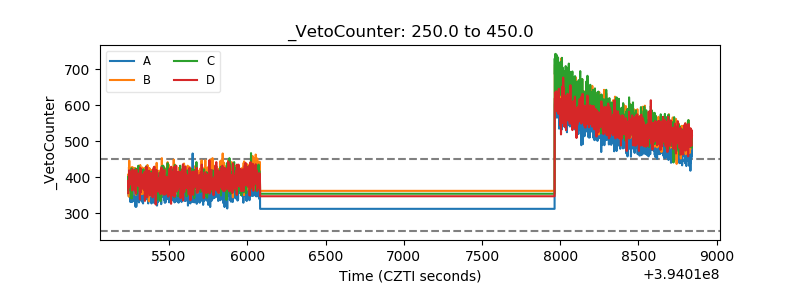 |