| Param | Original file | Final file |
|---|---|---|
| Filename | modeM0/AS1A11_049T02_9000005206_36472cztM0_level2.evt | modeM0/AS1A11_049T02_9000005206_36472cztM0_level2_quad_clean.evt |
| Size (bytes) | 1,205,231,040 | 175,881,600 |
| Size | 1.1 GB | 167.7 MB |
| Events in quadrant A | 7,592,066 | 1,090,369 |
| Events in quadrant B | 9,722,366 | 1,057,168 |
| Events in quadrant C | 8,630,546 | 1,062,869 |
| Events in quadrant D | 9,479,197 | 1,016,783 |
| Mode M0 | |||
|---|---|---|---|
| Quadrant | BADHDUFLAG | Total packets | Discarded packets |
| A | 0 | 32632 | 5 |
| B | 0 | 39387 | 8 |
| C | 0 | 35309 | 4 |
| D | 0 | 39254 | 4 |
| Mode SS | |||
|---|---|---|---|
| Quadrant | BADHDUFLAG | Total packets | Discarded packets |
| A | 0 | 326 | 0 |
| B | 0 | 326 | 0 |
| C | 0 | 326 | 0 |
| D | 0 | 326 | 0 |
| Mode M9 | |||
|---|---|---|---|
| Quadrant | BADHDUFLAG | Total packets | Discarded packets |
| A | 0 | 55 | 0 |
| B | 0 | 55 | 0 |
| C | 0 | 55 | 0 |
| D | 0 | 55 | 0 |
| Quadrant | Total seconds | Saturated seconds | Saturation percentage |
|---|---|---|---|
| A | 15936 | 13 | 0.081576% |
| B | 15934 | 613 | 3.847119% |
| C | 15936 | 196 | 1.229920% |
| D | 15936 | 410 | 2.572791% |
Noise dominated data is calculated using 1-second bins in cleaned event files. If a bin has >2000 counts, and if more than 50% of those come from <1% of pixels, then it is considered to be noise-dominated and hence unusable.
| Quadrant | # 1 sec bins | Bins with >0 counts | Bins with >2000 counts | High rate bins dominated by noise | Noise dominated (total time) | Noise dominated (detector-on time) | Marked lightcurve |
|---|---|---|---|---|---|---|---|
| A | 21426 | 15940 | 1 | 1 | 0.00% | 0.01% | 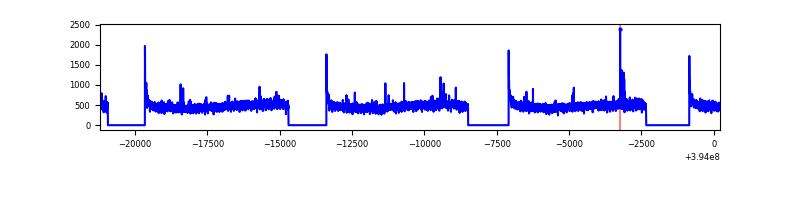 |
| B | 21426 | 15939 | 349 | 349 | 1.63% | 2.19% | 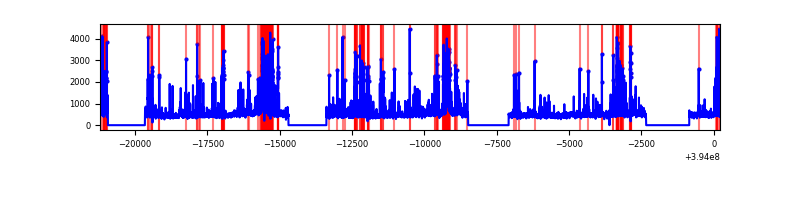 |
| C | 21426 | 15940 | 154 | 154 | 0.72% | 0.97% | 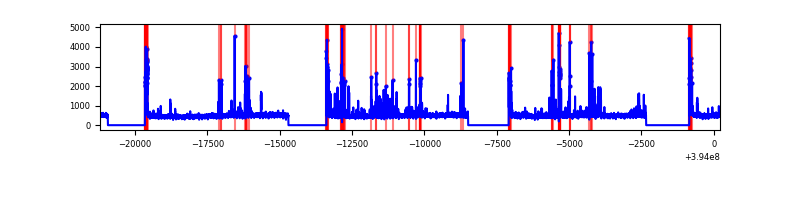 |
| D | 21426 | 15940 | 287 | 287 | 1.34% | 1.80% | 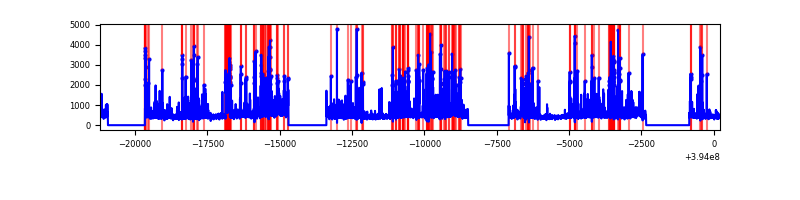 |
Top three noisy pixels from each quadrant. If the there are fewer than three noisy pixels in the level2.evt file, extra rows are filled as -1
| Pixel properties | Quadrant properties | ||||||
|---|---|---|---|---|---|---|---|
| Quadrant | DetID | PixID | Counts | Sigma | Mean | Median | Sigma |
| A | 10 | 83 | 480776 | 1313.19 | 1825 | 1790 | 364.8 |
| A | 9 | 143 | 30990 | 80.05 | 1825 | 1790 | 364.8 |
| A | 13 | 254 | 27492 | 70.46 | 1825 | 1790 | 364.8 |
| B | 5 | 172 | 1618189 | 4751.96 | 1779 | 1731 | 340.2 |
| B | 5 | 255 | 410159 | 1200.67 | 1779 | 1731 | 340.2 |
| B | 0 | 190 | 175611 | 511.16 | 1779 | 1731 | 340.2 |
| C | 15 | 214 | 682631 | 1684.84 | 1750 | 1760 | 404.1 |
| C | 0 | 207 | 645573 | 1593.14 | 1750 | 1760 | 404.1 |
| C | 0 | 10 | 345163 | 849.76 | 1750 | 1760 | 404.1 |
| D | 13 | 249 | 704269 | 1640.98 | 1752 | 1701 | 428.1 |
| D | 13 | 171 | 557424 | 1297.99 | 1752 | 1701 | 428.1 |
| D | 10 | 118 | 399981 | 930.26 | 1752 | 1701 | 428.1 |
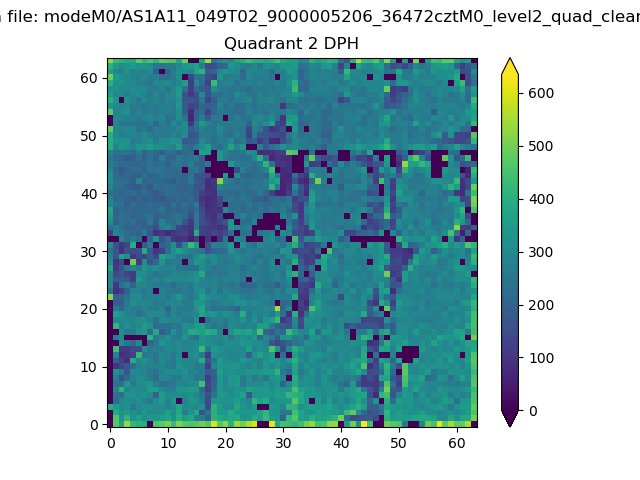
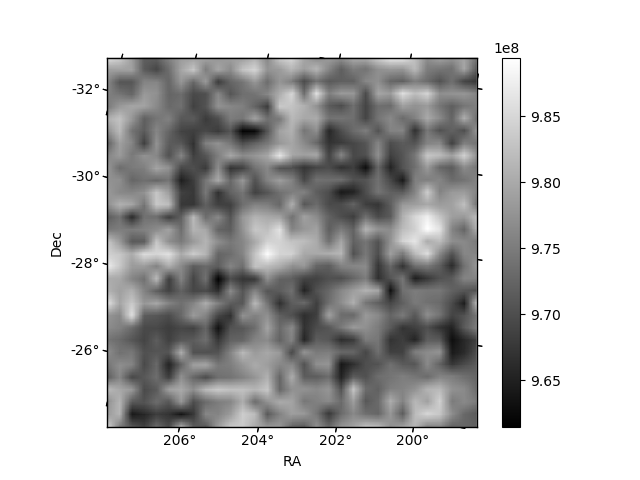
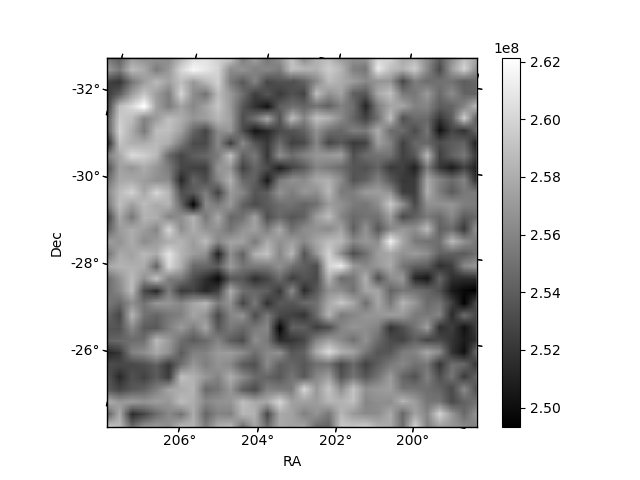
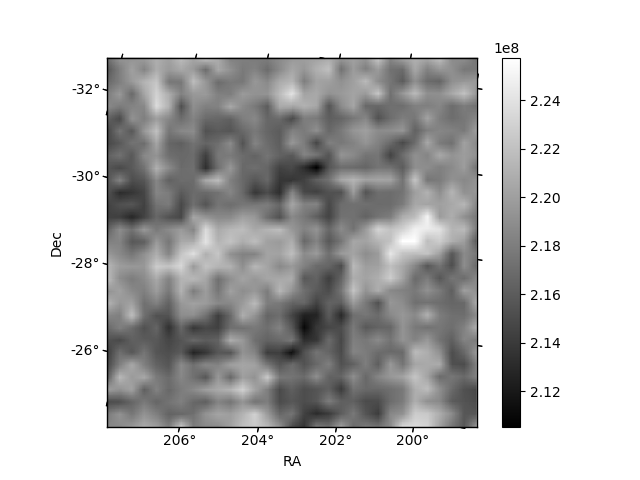
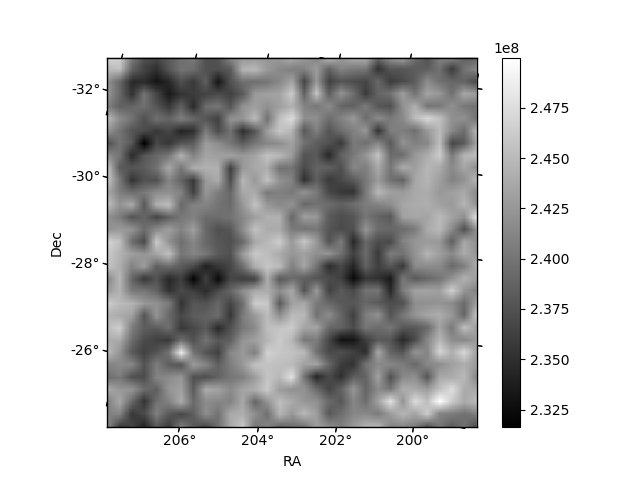
Histogram calculated using DETX and DETY for each event in the final _common_clean file
| Quadrant A | 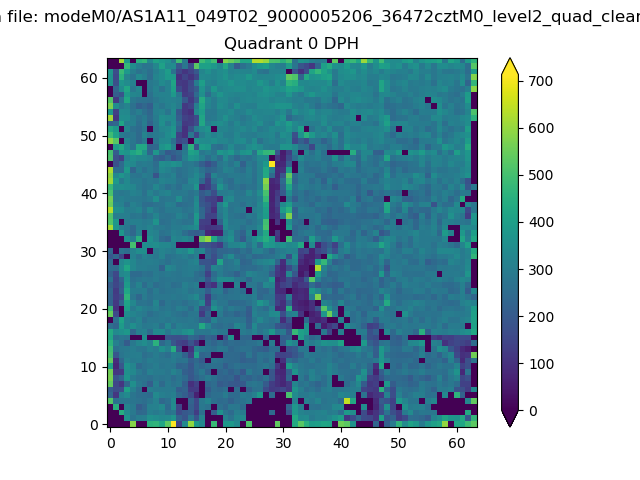 |
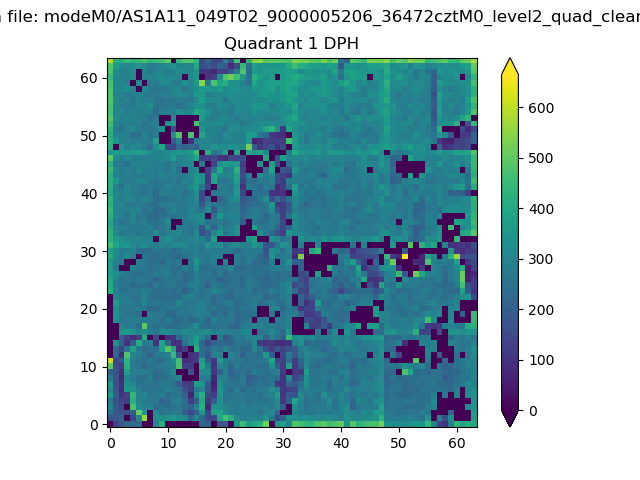 |
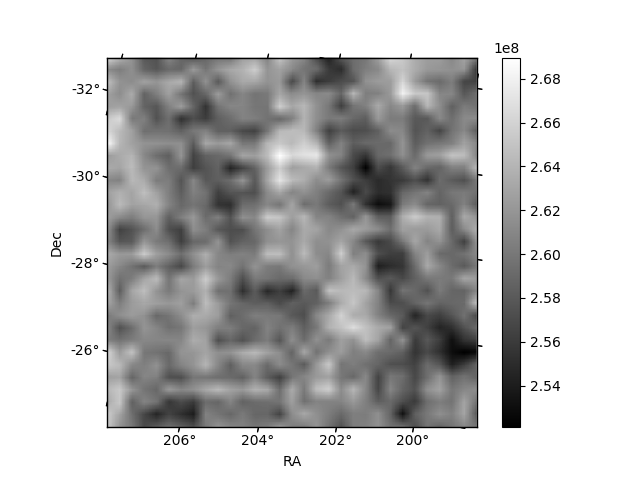
Quadrant B |
|---|---|---|---|
| Quadrant D | 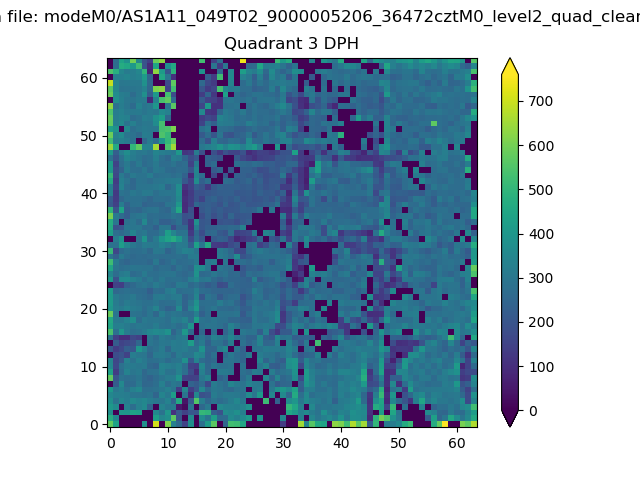 |
 |
Quadrant C |
| Plot type | Count rate plots | Images |
|---|---|---|
| Comparison with Poisson distribution Blue bars denote a histogram of data divided into 1 sec bins. Red curve is a Poisson curve with rate = median count rate of data. |
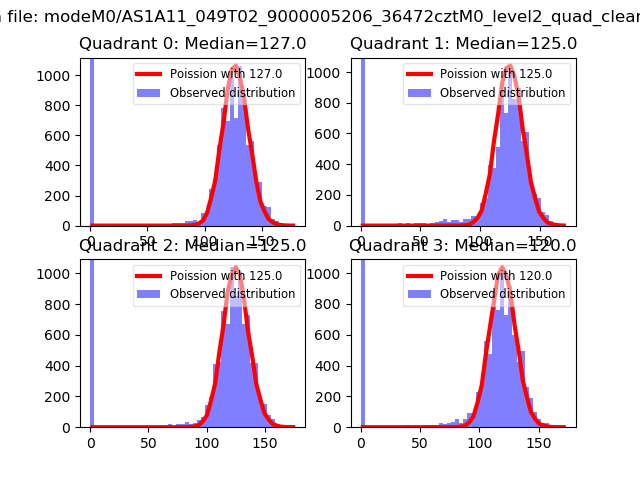 |
 |
| Quadrant-wise count rates Data is divided into 100 sec bins |
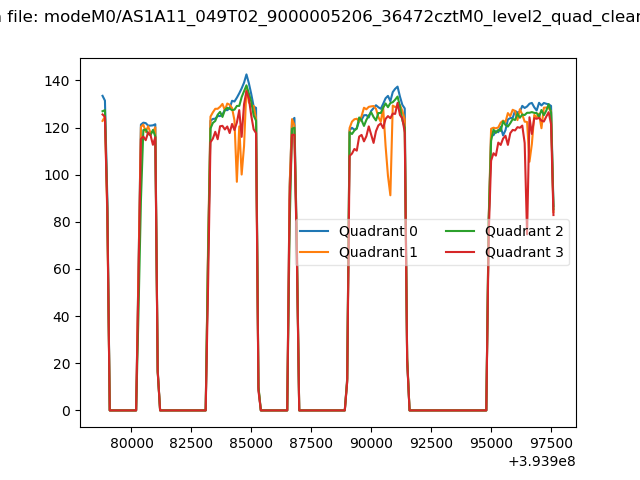 |
|
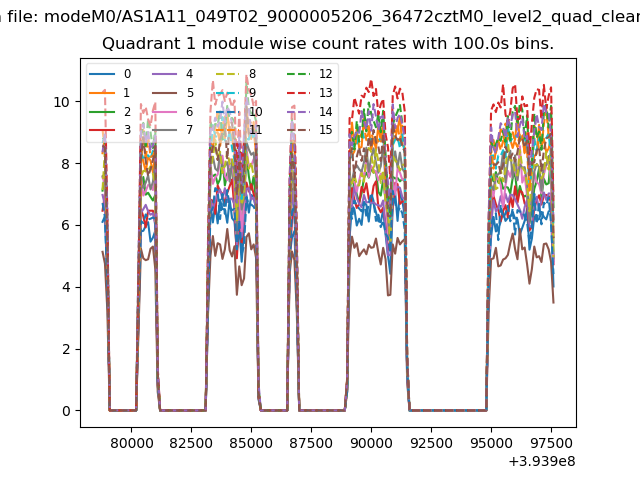
| Module-wise count rates for Quadrant A Data is divided into 100 sec bins |
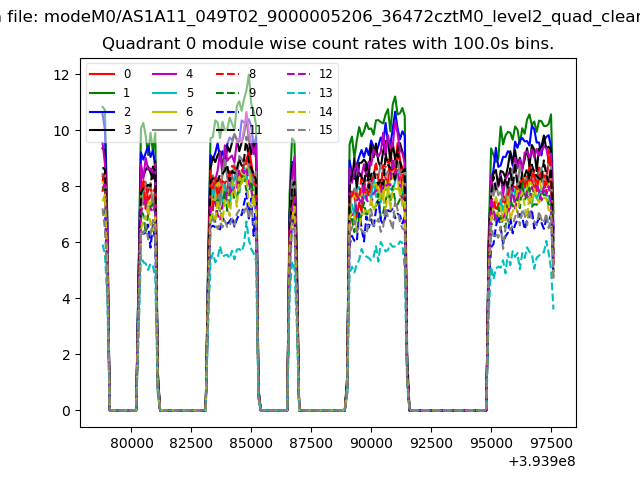 |
 |
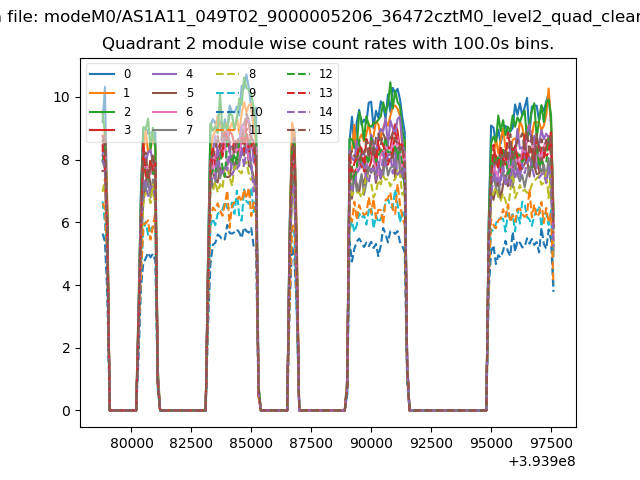
| Module-wise count rates for Quadrant B Data is divided into 100 sec bins |
 |
 |
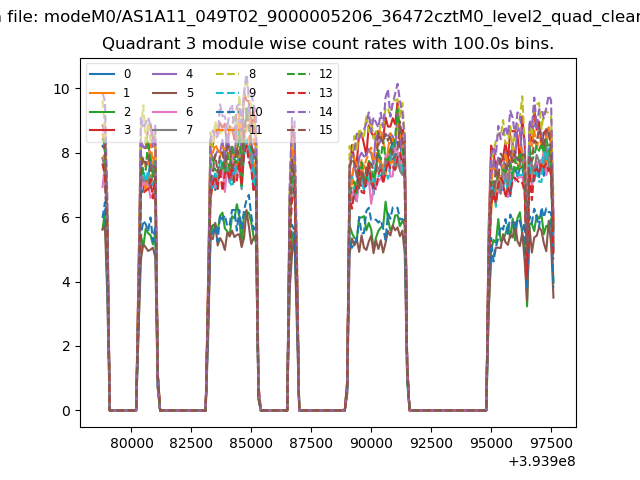
| Module-wise count rates for Quadrant C Data is divided into 100 sec bins |
 |
 |
| Module-wise count rates for Quadrant D Data is divided into 100 sec bins |
 |
 |
| Parameter | Plot |
|---|---|
| CZT HV Monitor | 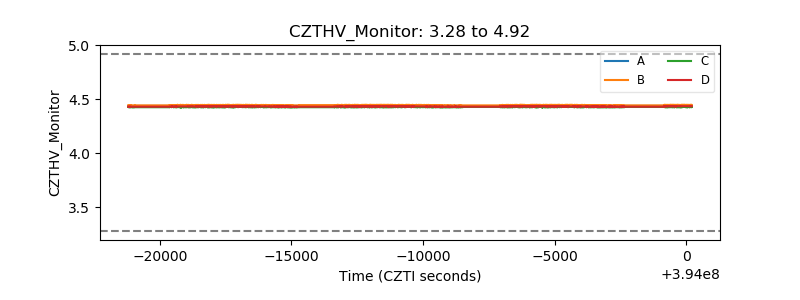 |
| D_VDD | 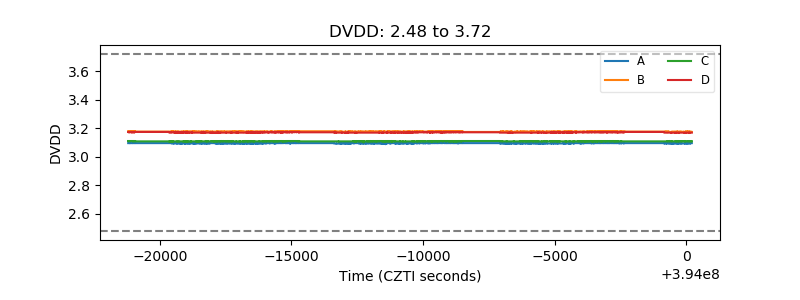 |
| Temperature 1 | 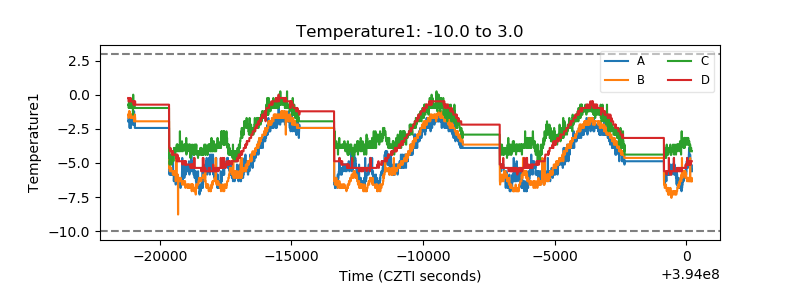 |
| Veto HV Monitor | 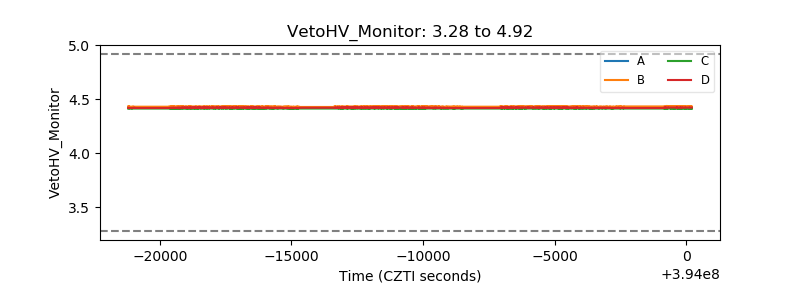 |
| Veto LLD | 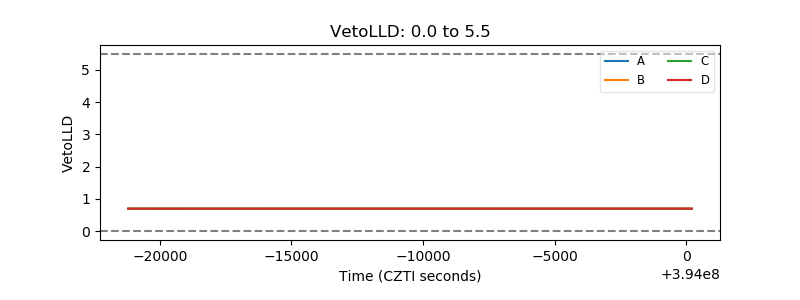 |
| Alpha Counter | 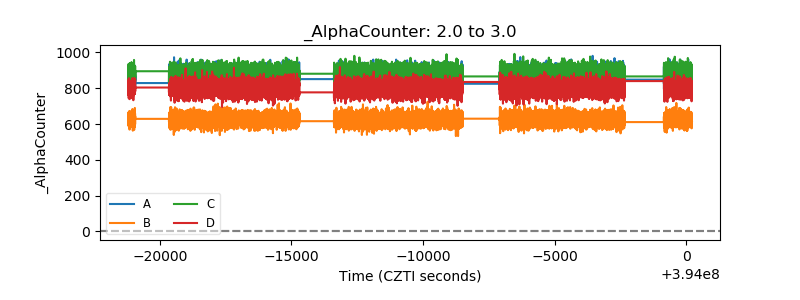 |
| _CPM_Rate | 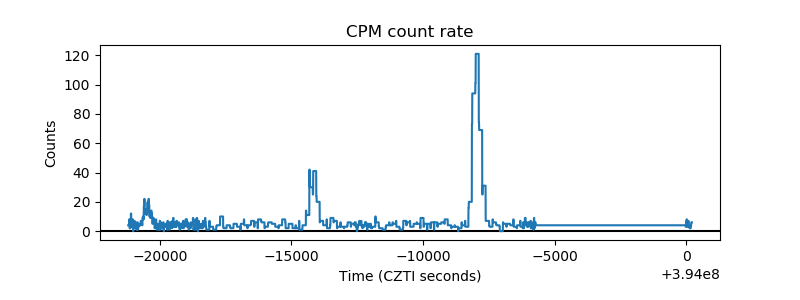 |
| CZT Counter | 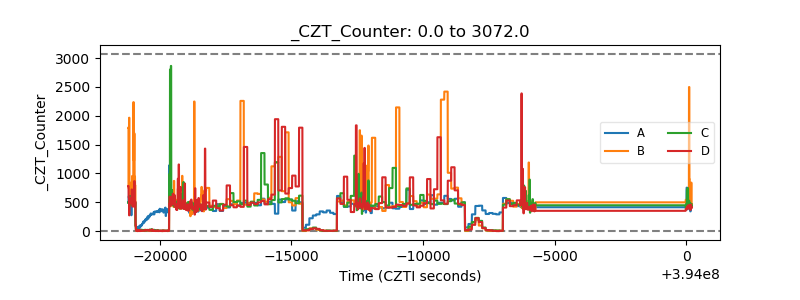 |
| +2.5 Volts monitor | 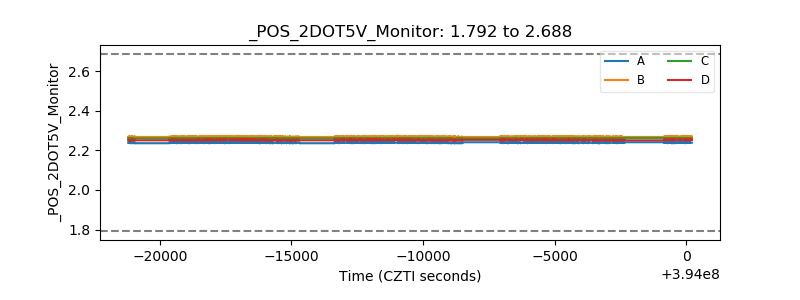 |
| +5 Volts monitor | 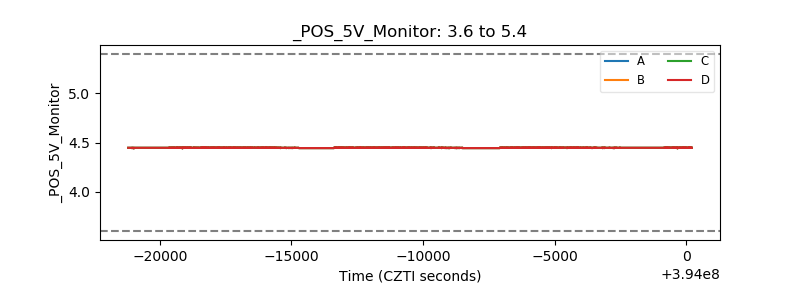 |
| _ROLL_ROT | 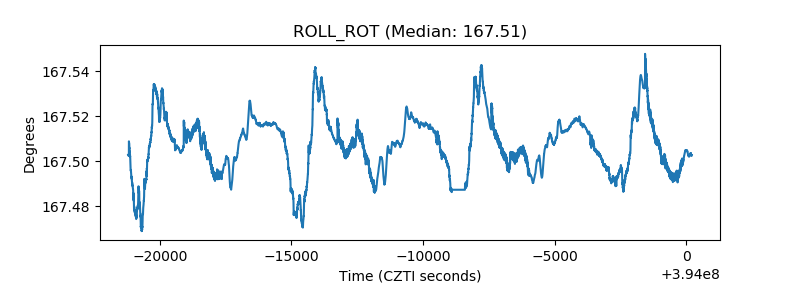 |
| _Roll_DEC | 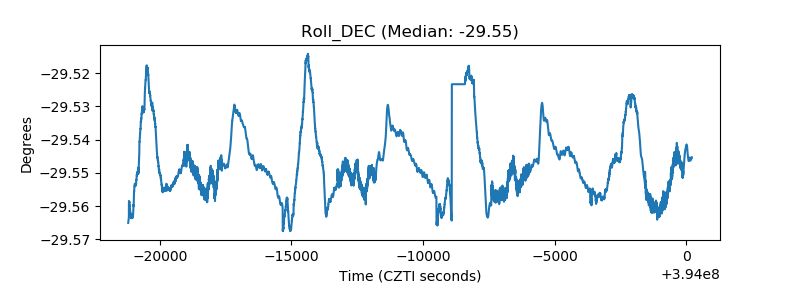 |
| _Roll_RA | 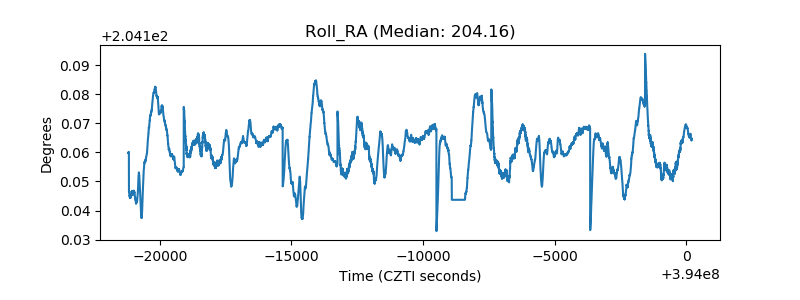 |
| Veto Counter | 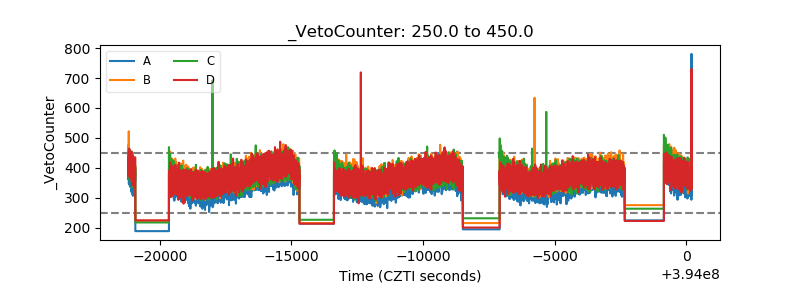 |