| Param | Original file | Final file |
|---|---|---|
| Filename | modeM0/AS1A11_049T02_9000005206_36465cztM0_level2.evt | modeM0/AS1A11_049T02_9000005206_36465cztM0_level2_quad_clean.evt |
| Size (bytes) | 185,837,760 | 26,484,480 |
| Size | 177.2 MB | 25.3 MB |
| Events in quadrant A | 1,248,006 | 160,937 |
| Events in quadrant B | 1,398,885 | 159,031 |
| Events in quadrant C | 1,461,545 | 152,484 |
| Events in quadrant D | 1,350,608 | 152,180 |
| Mode M0 | |||
|---|---|---|---|
| Quadrant | BADHDUFLAG | Total packets | Discarded packets |
| A | 0 | 5199 | 2 |
| B | 0 | 5653 | 1 |
| C | 0 | 5789 | 1 |
| D | 0 | 5601 | 1 |
| Mode SS | |||
|---|---|---|---|
| Quadrant | BADHDUFLAG | Total packets | Discarded packets |
| A | 0 | 52 | 0 |
| B | 0 | 52 | 0 |
| C | 0 | 52 | 0 |
| D | 0 | 52 | 0 |
| Mode M9 | |||
|---|---|---|---|
| Quadrant | BADHDUFLAG | Total packets | Discarded packets |
| A | 0 | 21 | 0 |
| B | 0 | 21 | 0 |
| C | 0 | 21 | 0 |
| D | 0 | 21 | 0 |
| Quadrant | Total seconds | Saturated seconds | Saturation percentage |
|---|---|---|---|
| A | 2454 | 7 | 0.285249% |
| B | 2454 | 30 | 1.222494% |
| C | 2454 | 92 | 3.748981% |
| D | 2454 | 13 | 0.529747% |
Noise dominated data is calculated using 1-second bins in cleaned event files. If a bin has >2000 counts, and if more than 50% of those come from <1% of pixels, then it is considered to be noise-dominated and hence unusable.
| Quadrant | # 1 sec bins | Bins with >0 counts | Bins with >2000 counts | High rate bins dominated by noise | Noise dominated (total time) | Noise dominated (detector-on time) | Marked lightcurve |
|---|---|---|---|---|---|---|---|
| A | 4577 | 2455 | 3 | 3 | 0.07% | 0.12% | 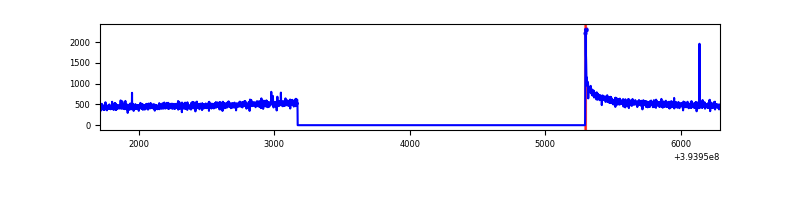 |
| B | 4577 | 2455 | 18 | 18 | 0.39% | 0.73% | 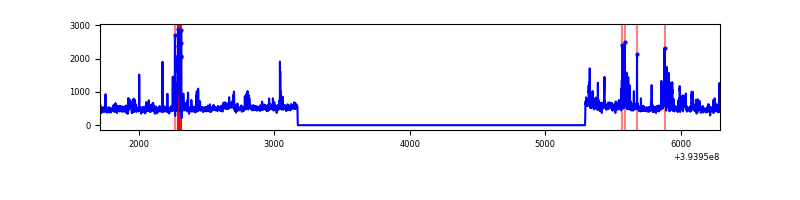 |
| C | 4577 | 2455 | 65 | 65 | 1.42% | 2.65% | 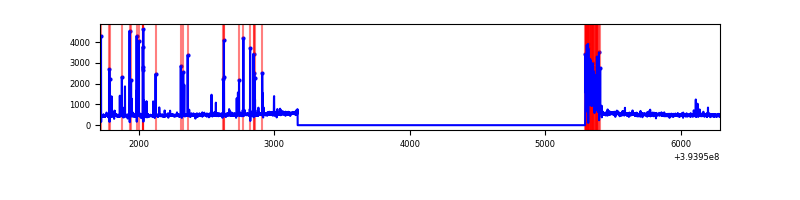 |
| D | 4577 | 2455 | 9 | 9 | 0.20% | 0.37% | 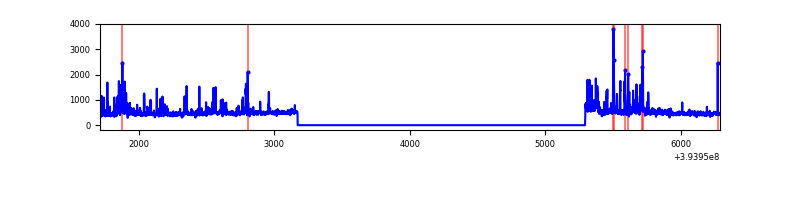 |
Top three noisy pixels from each quadrant. If the there are fewer than three noisy pixels in the level2.evt file, extra rows are filled as -1
| Pixel properties | Quadrant properties | ||||||
|---|---|---|---|---|---|---|---|
| Quadrant | DetID | PixID | Counts | Sigma | Mean | Median | Sigma |
| A | 10 | 83 | 97062 | 1617.14 | 295 | 290 | 59.8 |
| A | 13 | 254 | 4671 | 73.21 | 295 | 290 | 59.8 |
| A | 3 | 252 | 4036 | 62.6 | 295 | 290 | 59.8 |
| B | 5 | 172 | 139463 | 2441.41 | 290 | 282 | 57.0 |
| B | 0 | 189 | 57008 | 995.05 | 290 | 282 | 57.0 |
| B | 5 | 255 | 28849 | 501.1 | 290 | 282 | 57.0 |
| C | 0 | 10 | 262210 | 4011.93 | 278 | 279 | 65.3 |
| C | 15 | 214 | 105006 | 1604.07 | 278 | 279 | 65.3 |
| C | 0 | 207 | 8562 | 126.87 | 278 | 279 | 65.3 |
| D | 2 | 250 | 66109 | 943.76 | 283 | 276 | 69.8 |
| D | 10 | 199 | 55808 | 796.09 | 283 | 276 | 69.8 |
| D | 13 | 249 | 49227 | 701.74 | 283 | 276 | 69.8 |
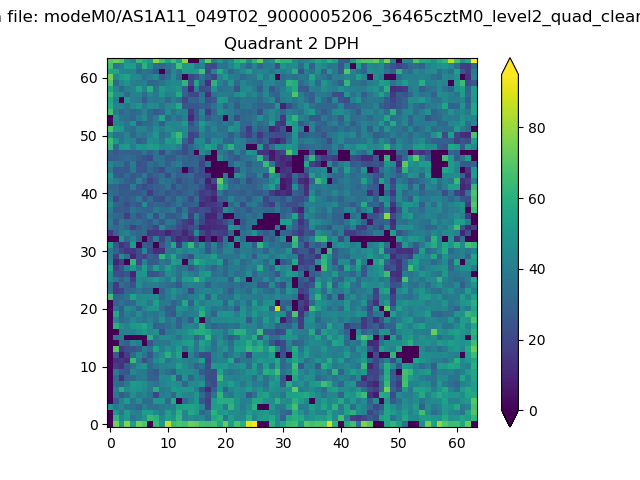
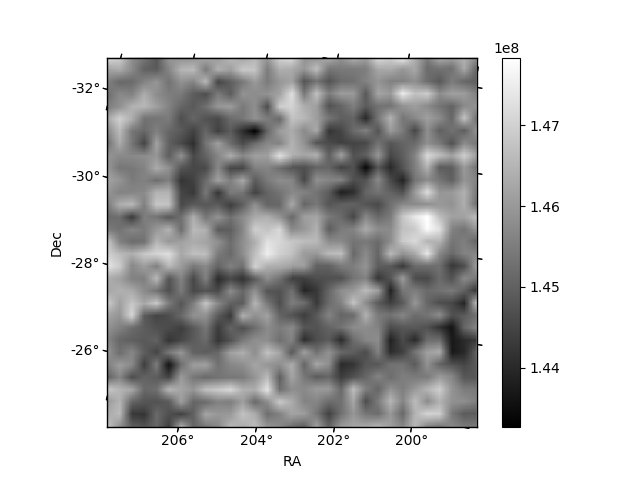
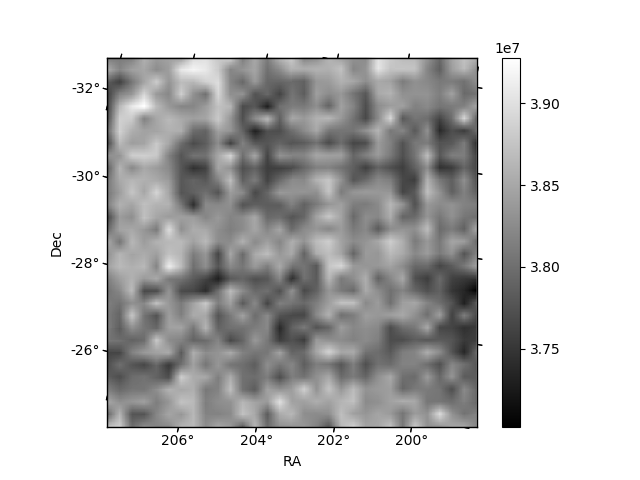
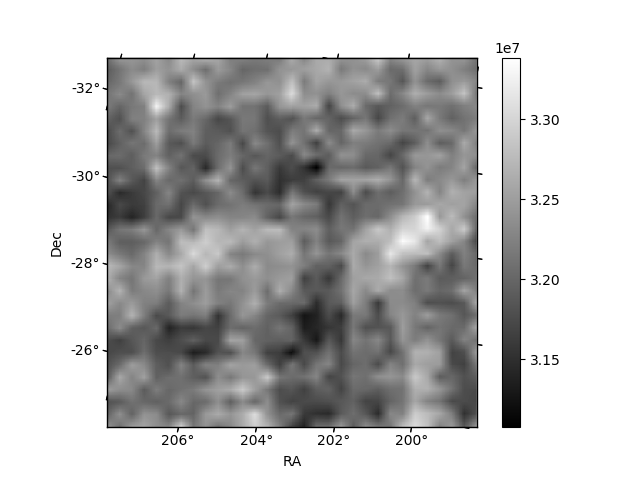
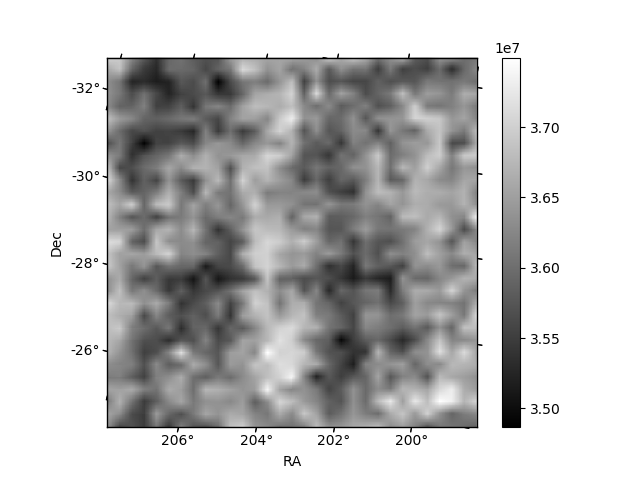
Histogram calculated using DETX and DETY for each event in the final _common_clean file
| Quadrant A | 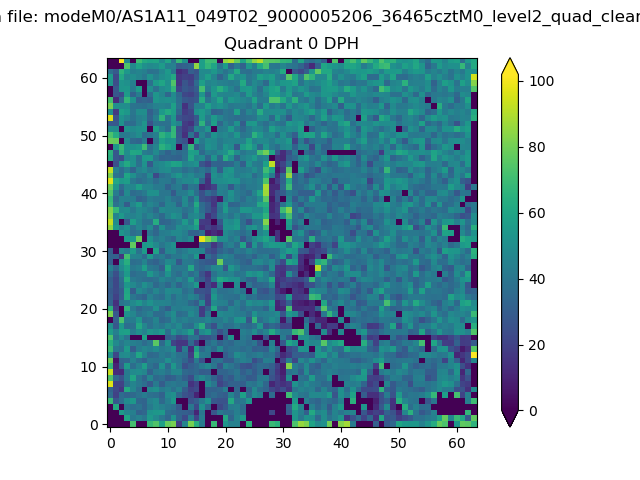 |
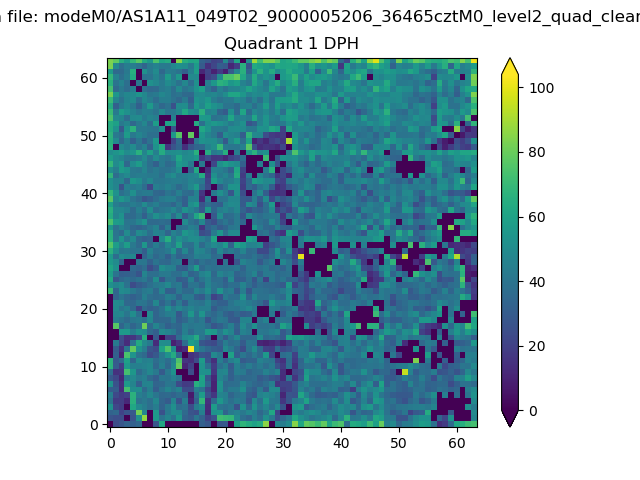 |
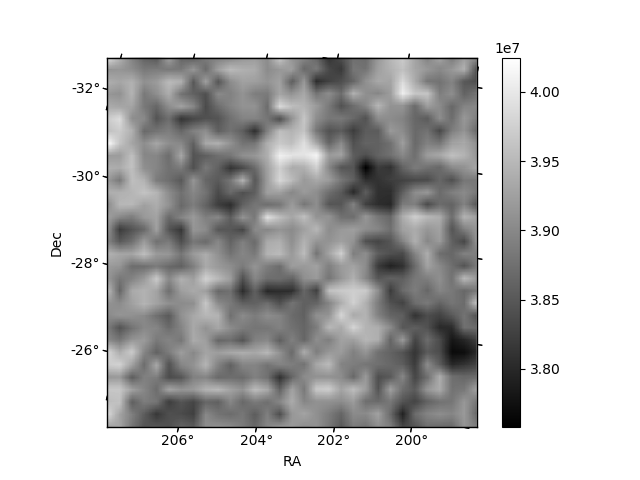
Quadrant B |
|---|---|---|---|
| Quadrant D | 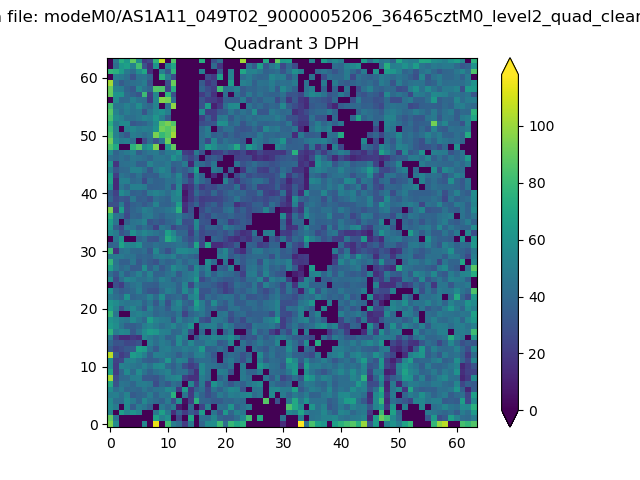 |
 |
Quadrant C |
| Plot type | Count rate plots | Images |
|---|---|---|
| Comparison with Poisson distribution Blue bars denote a histogram of data divided into 1 sec bins. Red curve is a Poisson curve with rate = median count rate of data. |
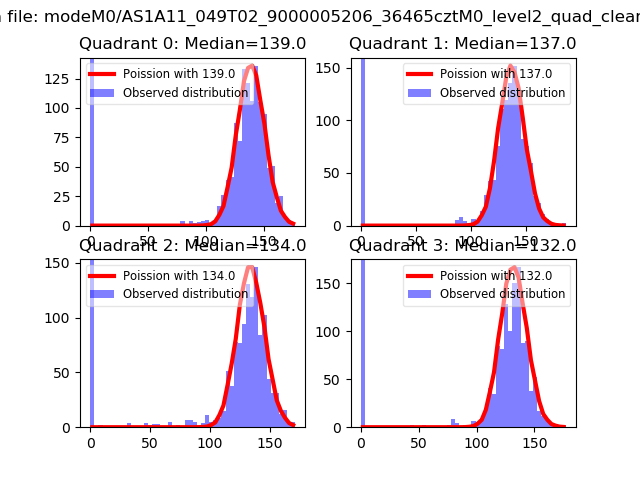 |
 |
| Quadrant-wise count rates Data is divided into 100 sec bins |
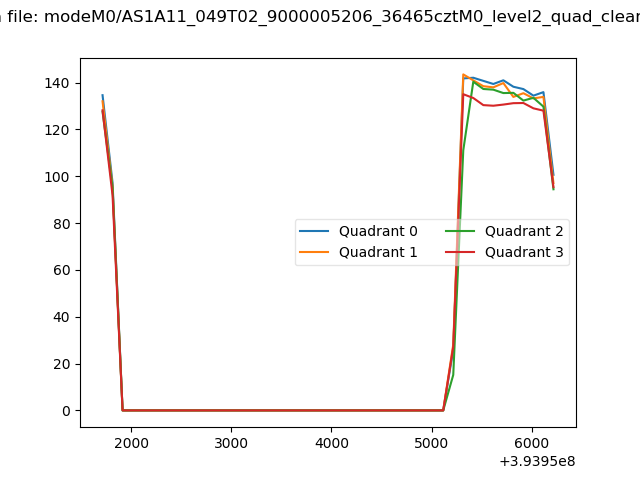 |
|
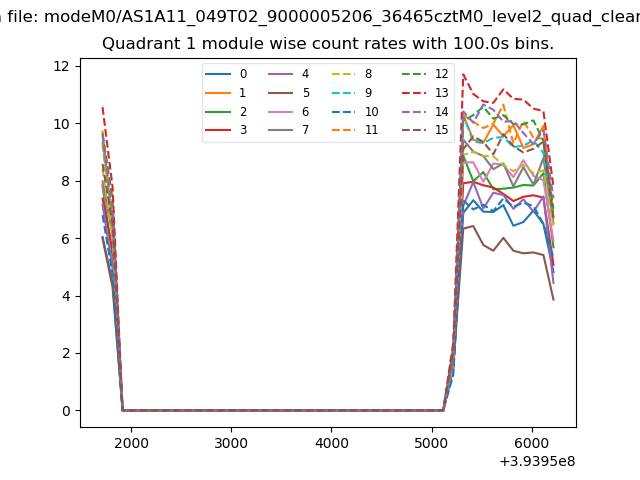
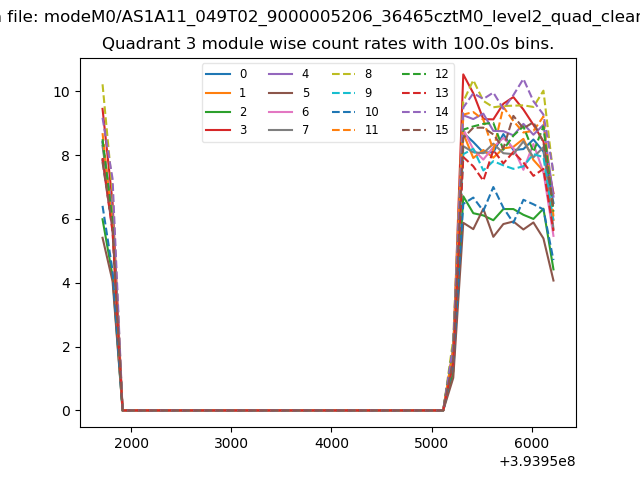
| Module-wise count rates for Quadrant A Data is divided into 100 sec bins |
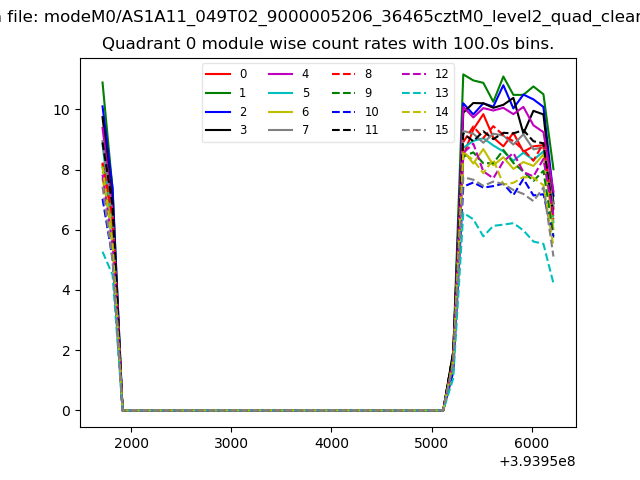 |
 |
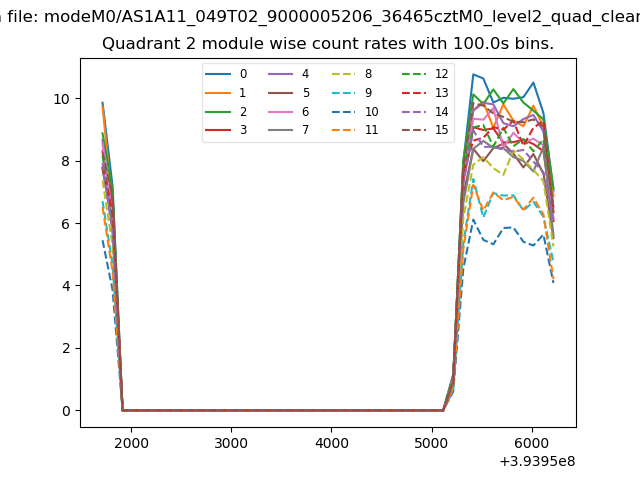
| Module-wise count rates for Quadrant B Data is divided into 100 sec bins |
 |
 |
| Module-wise count rates for Quadrant C Data is divided into 100 sec bins |
 |
 |
| Module-wise count rates for Quadrant D Data is divided into 100 sec bins |
 |
 |
| Parameter | Plot |
|---|---|
| CZT HV Monitor | 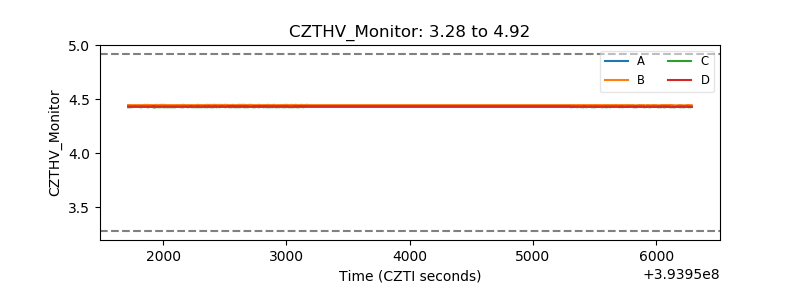 |
| D_VDD | 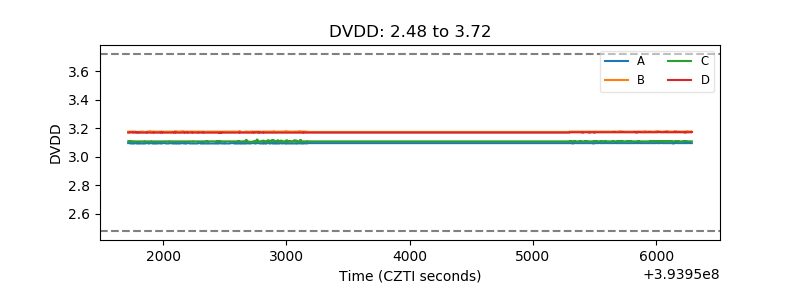 |
| Temperature 1 | 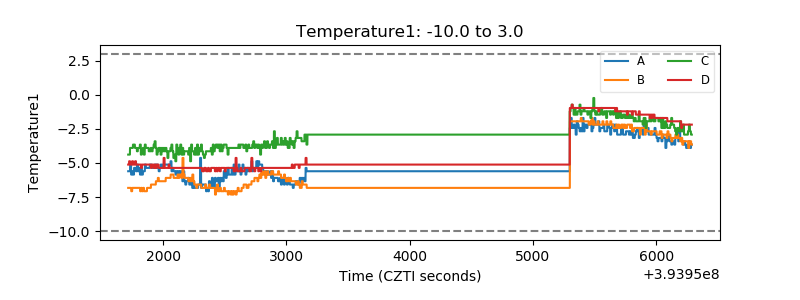 |
| Veto HV Monitor | 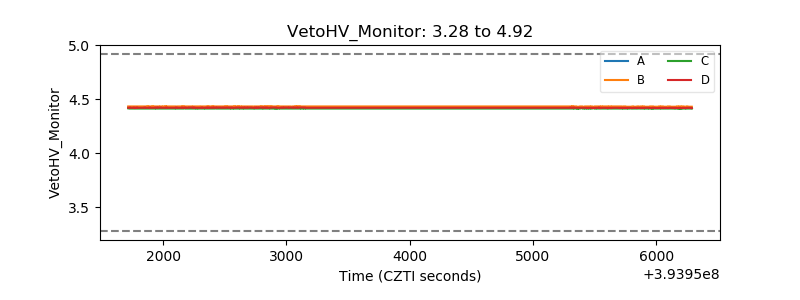 |
| Veto LLD | 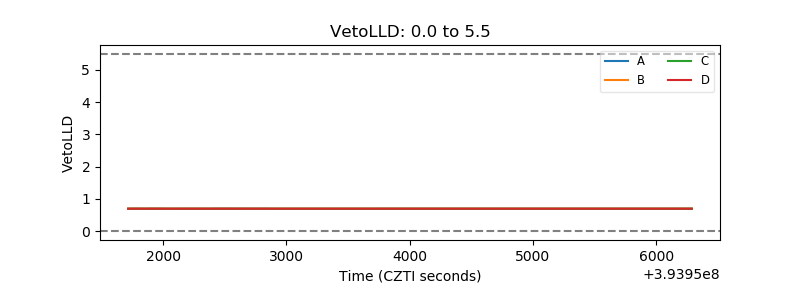 |
| Alpha Counter | 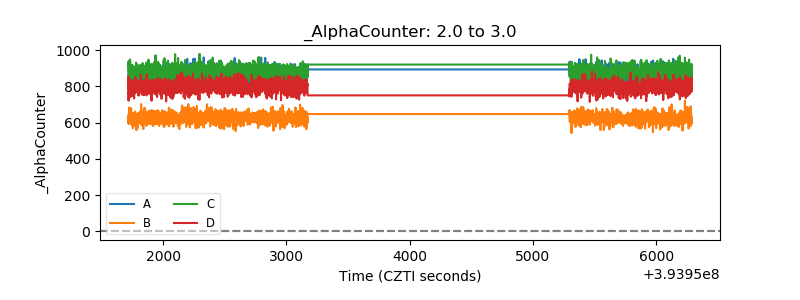 |
| _CPM_Rate | 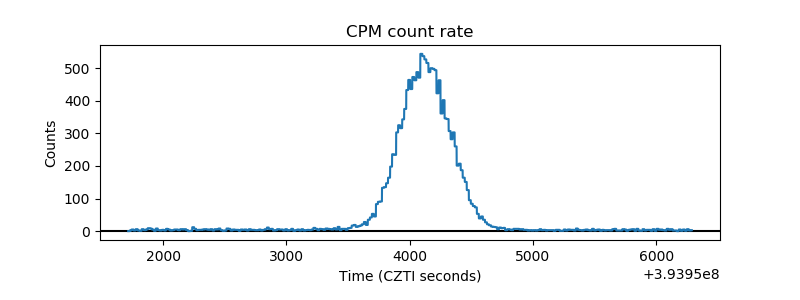 |
| CZT Counter | 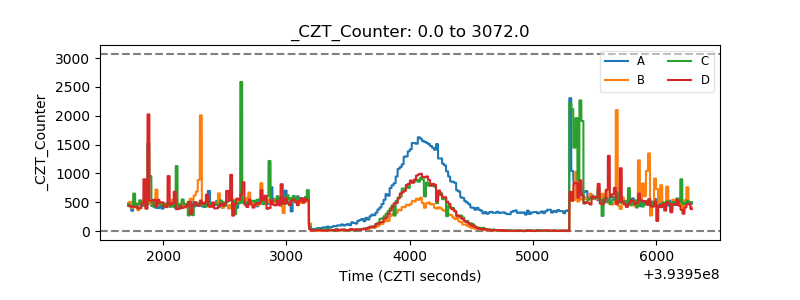 |
| +2.5 Volts monitor | 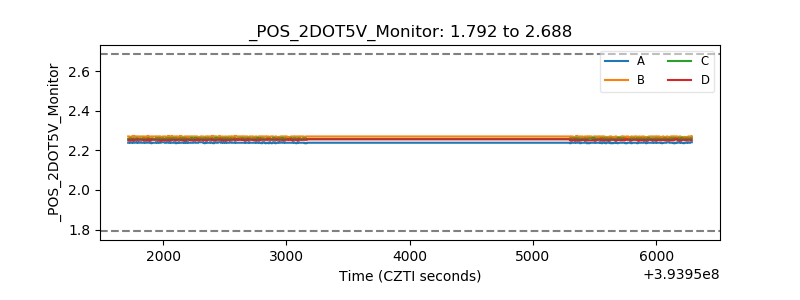 |
| +5 Volts monitor | 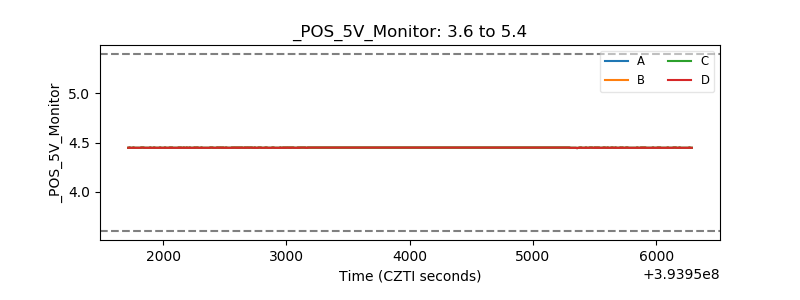 |
| _ROLL_ROT | 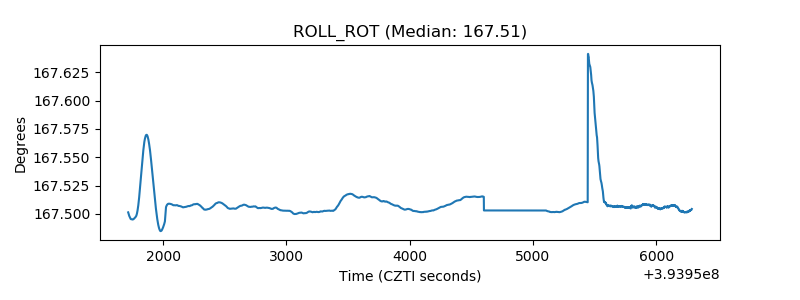 |
| _Roll_DEC | 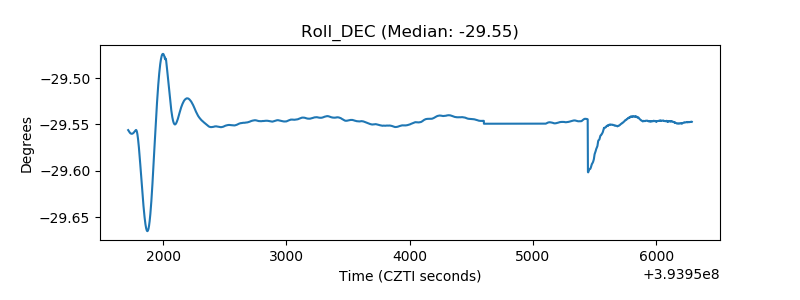 |
| _Roll_RA | 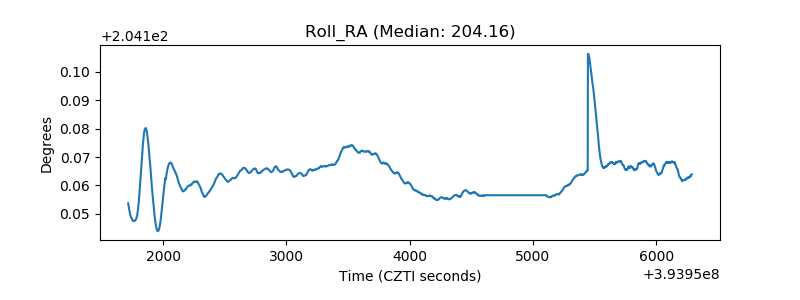 |
| Veto Counter | 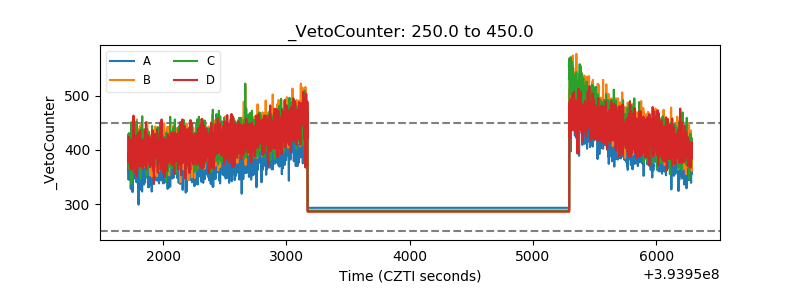 |