| Param | Original file | Final file |
|---|---|---|
| Filename | modeM0/AS1A09_014T01_9000005204_36464cztM0_level2.evt | modeM0/AS1A09_014T01_9000005204_36464cztM0_level2_quad_clean.evt |
| Size (bytes) | 398,243,520 | 101,750,400 |
| Size | 379.8 MB | 97.0 MB |
| Events in quadrant A | 2,613,053 | 699,177 |
| Events in quadrant B | 3,269,328 | 687,756 |
| Events in quadrant C | 2,868,602 | 684,903 |
| Events in quadrant D | 2,966,735 | 655,976 |
| Mode M9 | |||
|---|---|---|---|
| Quadrant | BADHDUFLAG | Total packets | Discarded packets |
| A | 0 | 22 | 0 |
| B | 0 | 22 | 0 |
| C | 0 | 22 | 0 |
| D | 0 | 22 | 0 |
| Mode SS | |||
|---|---|---|---|
| Quadrant | BADHDUFLAG | Total packets | Discarded packets |
| A | 0 | 102 | 0 |
| B | 0 | 102 | 0 |
| C | 0 | 102 | 0 |
| D | 0 | 102 | 0 |
| Mode M0 | |||
|---|---|---|---|
| Quadrant | BADHDUFLAG | Total packets | Discarded packets |
| A | 0 | 10863 | 3 |
| B | 0 | 12886 | 2 |
| C | 0 | 11302 | 2 |
| D | 0 | 11908 | 2 |
| Quadrant | Total seconds | Saturated seconds | Saturation percentage |
|---|---|---|---|
| A | 5051 | 9 | 0.178183% |
| B | 5051 | 109 | 2.157989% |
| C | 5051 | 91 | 1.801623% |
| D | 5051 | 99 | 1.960008% |
Noise dominated data is calculated using 1-second bins in cleaned event files. If a bin has >2000 counts, and if more than 50% of those come from <1% of pixels, then it is considered to be noise-dominated and hence unusable.
| Quadrant | # 1 sec bins | Bins with >0 counts | Bins with >2000 counts | High rate bins dominated by noise | Noise dominated (total time) | Noise dominated (detector-on time) | Marked lightcurve |
|---|---|---|---|---|---|---|---|
| A | 7174 | 5052 | 0 | 0 | 0.00% | 0.00% |  |
| B | 7174 | 5052 | 82 | 82 | 1.14% | 1.62% | 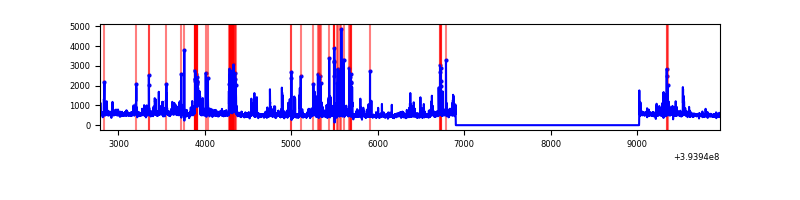 |
| C | 7174 | 5052 | 56 | 56 | 0.78% | 1.11% |  |
| D | 7174 | 5052 | 75 | 75 | 1.05% | 1.48% | 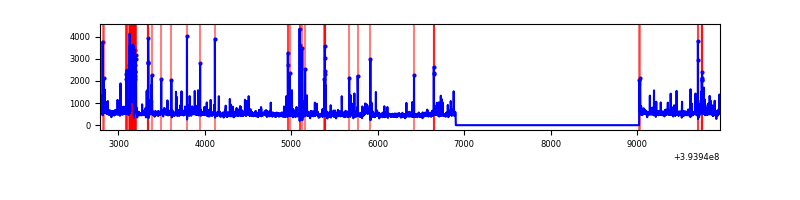 |
Top three noisy pixels from each quadrant. If the there are fewer than three noisy pixels in the level2.evt file, extra rows are filled as -1
| Pixel properties | Quadrant properties | ||||||
|---|---|---|---|---|---|---|---|
| Quadrant | DetID | PixID | Counts | Sigma | Mean | Median | Sigma |
| A | 10 | 83 | 181569 | 1468.38 | 624 | 615 | 123.2 |
| A | 13 | 254 | 9317 | 70.61 | 624 | 615 | 123.2 |
| A | 13 | 6 | 6668 | 49.12 | 624 | 615 | 123.2 |
| B | 5 | 172 | 377962 | 3323.75 | 611 | 595 | 113.5 |
| B | 5 | 255 | 208710 | 1833.02 | 611 | 595 | 113.5 |
| B | 0 | 189 | 86732 | 758.67 | 611 | 595 | 113.5 |
| C | 0 | 10 | 267259 | 1922.5 | 604 | 610 | 138.7 |
| C | 15 | 214 | 235440 | 1693.09 | 604 | 610 | 138.7 |
| C | 0 | 207 | 6175 | 40.12 | 604 | 610 | 138.7 |
| D | 13 | 249 | 139986 | 962.87 | 607 | 593 | 144.8 |
| D | 12 | 128 | 121810 | 837.32 | 607 | 593 | 144.8 |
| D | 10 | 199 | 89950 | 617.24 | 607 | 593 | 144.8 |
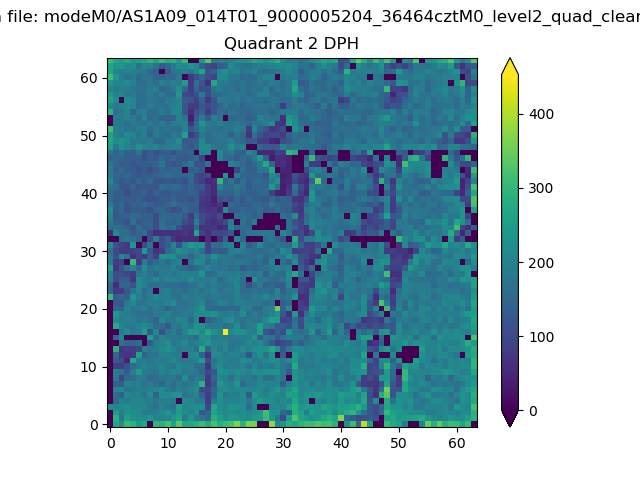
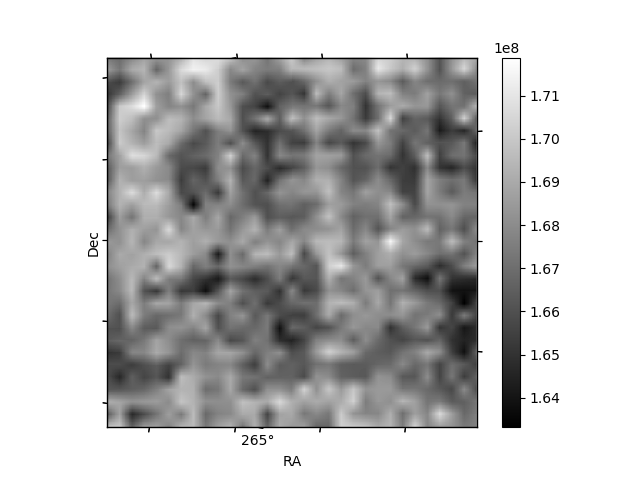
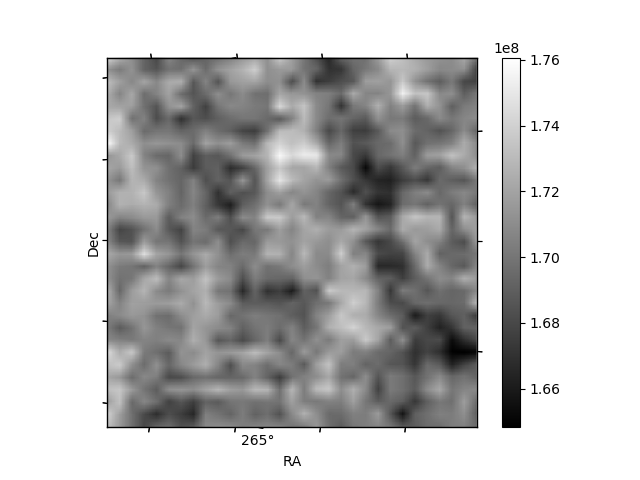
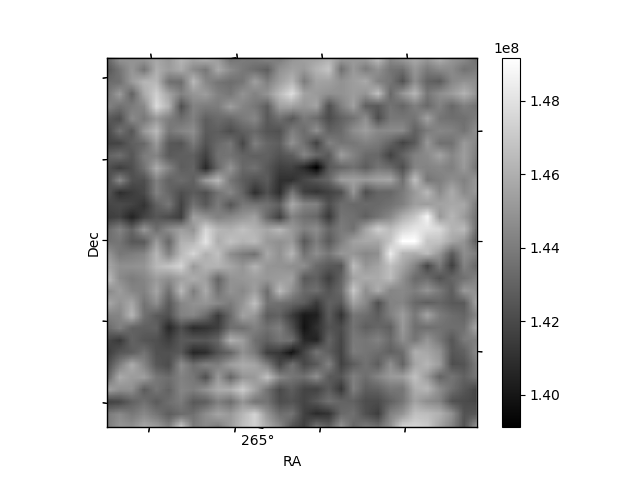
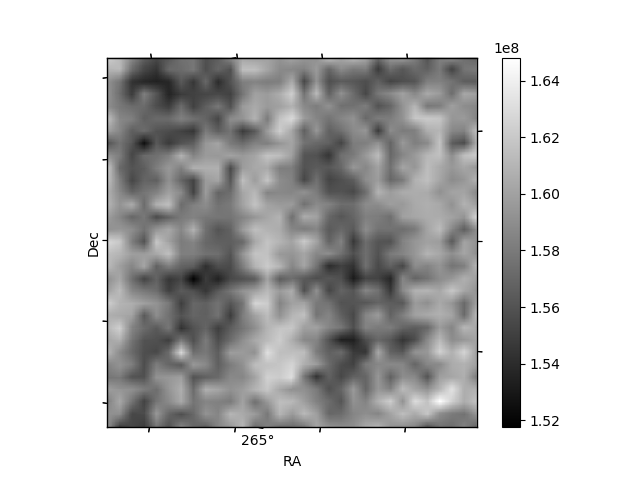
Histogram calculated using DETX and DETY for each event in the final _common_clean file
| Quadrant A | 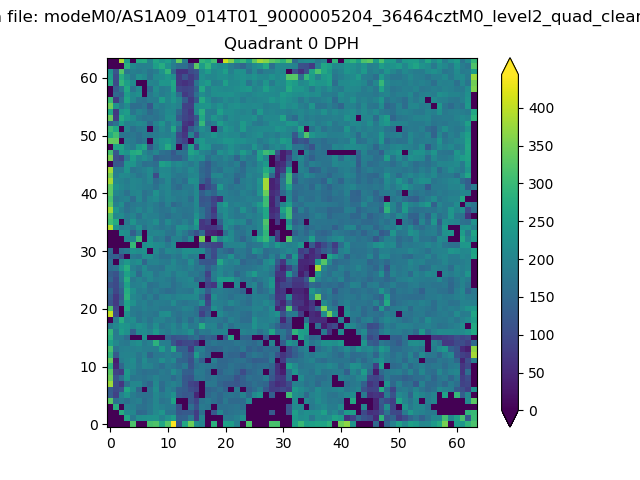 |
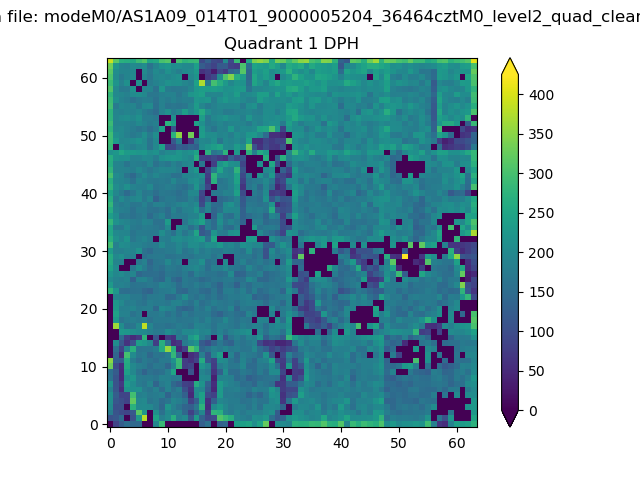 |
Quadrant B |
|---|---|---|---|
| Quadrant D | 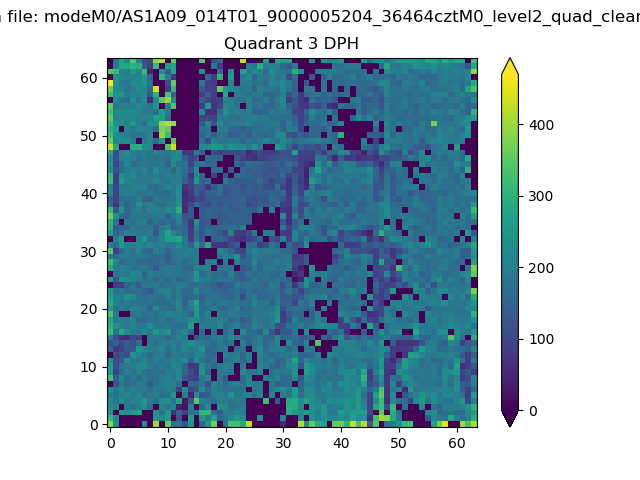 |
 |
Quadrant C |
| Plot type | Count rate plots | Images |
|---|---|---|
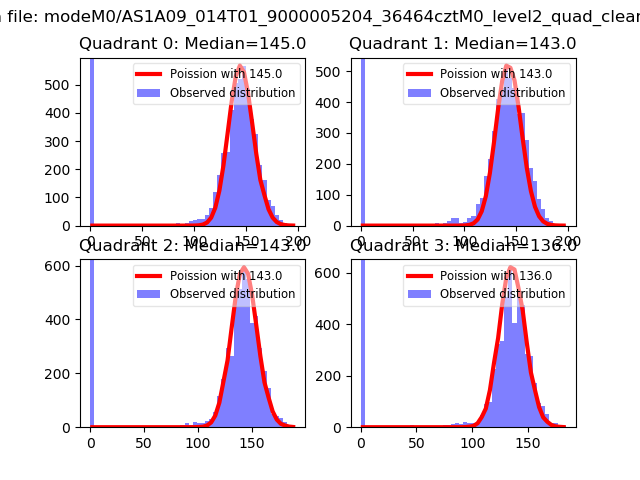
| Comparison with Poisson distribution Blue bars denote a histogram of data divided into 1 sec bins. Red curve is a Poisson curve with rate = median count rate of data. |
 |
 |
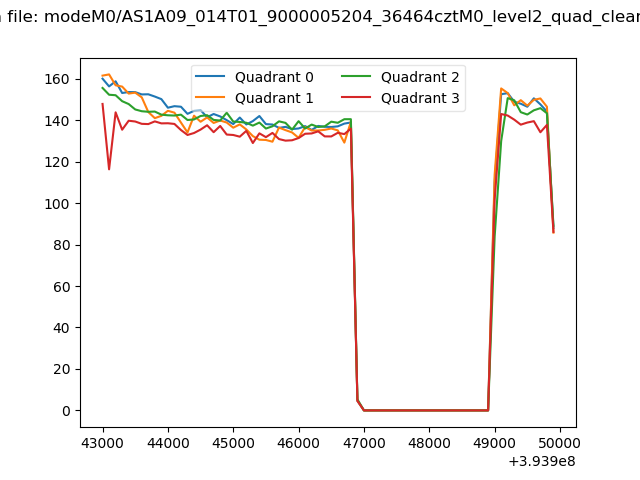
| Quadrant-wise count rates Data is divided into 100 sec bins |
 |
|
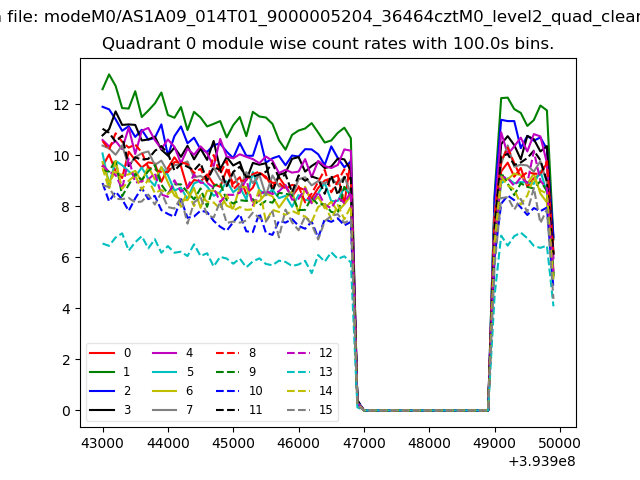
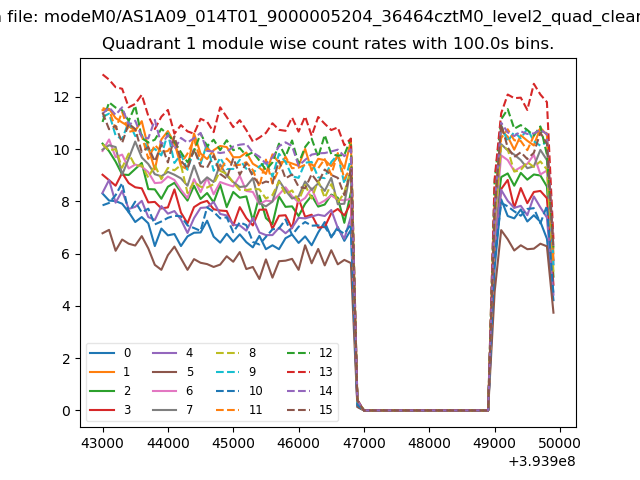
| Module-wise count rates for Quadrant A Data is divided into 100 sec bins |
 |
 |
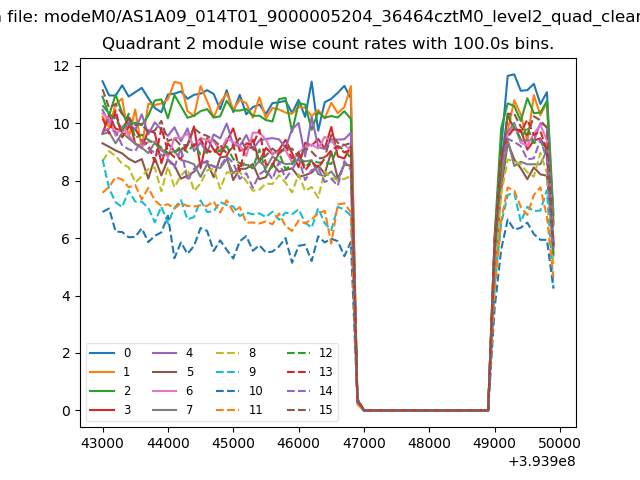
| Module-wise count rates for Quadrant B Data is divided into 100 sec bins |
 |
 |
| Module-wise count rates for Quadrant C Data is divided into 100 sec bins |
 |
 |
| Module-wise count rates for Quadrant D Data is divided into 100 sec bins |
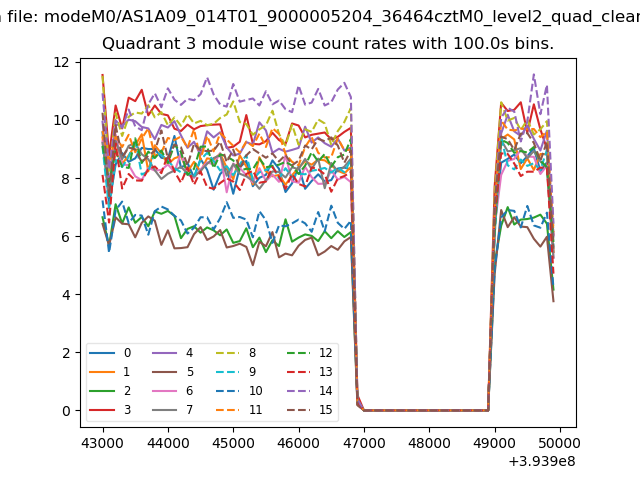 |
 |
| Parameter | Plot |
|---|---|
| CZT HV Monitor | 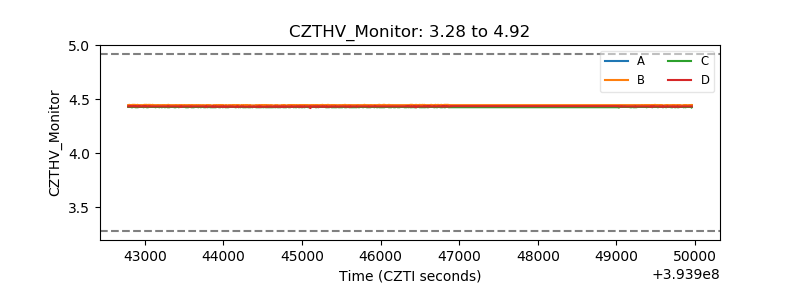 |
| D_VDD | 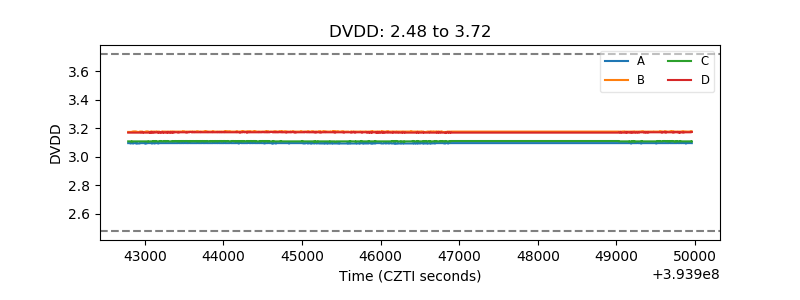 |
| Temperature 1 | 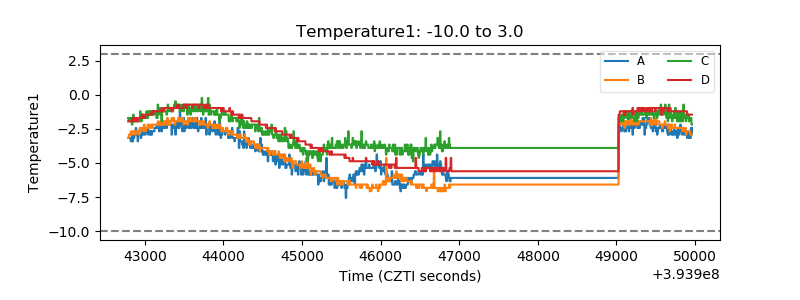 |
| Veto HV Monitor | 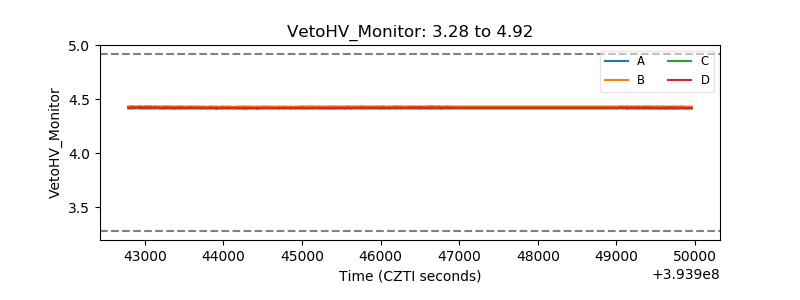 |
| Veto LLD | 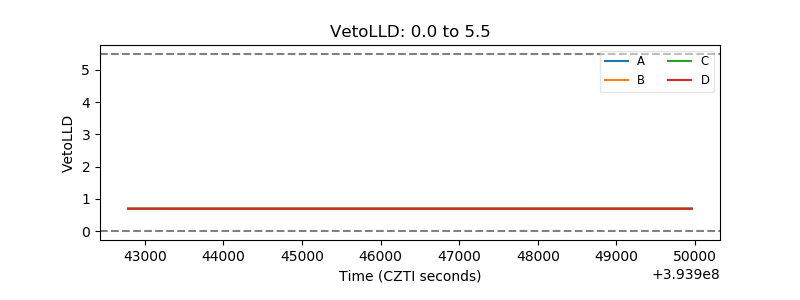 |
| Alpha Counter | 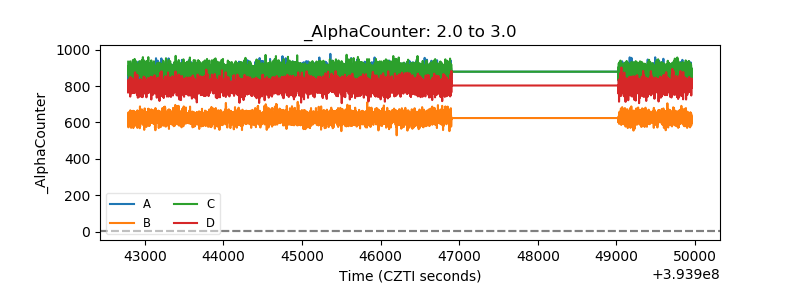 |
| _CPM_Rate | 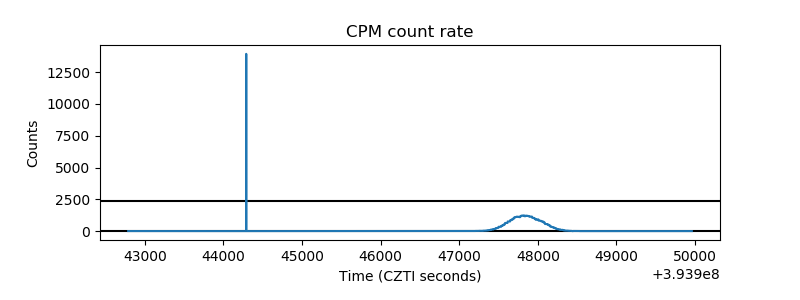 |
| CZT Counter | 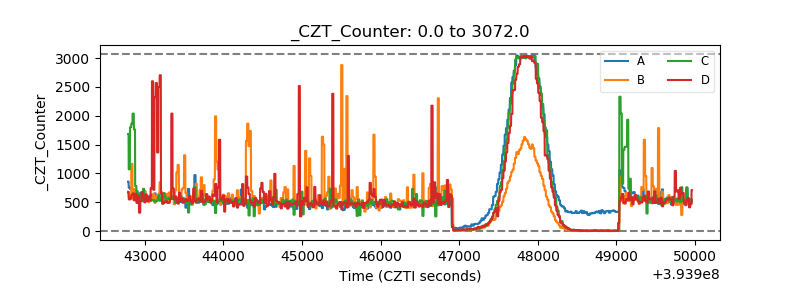 |
| +2.5 Volts monitor |  |
| +5 Volts monitor | 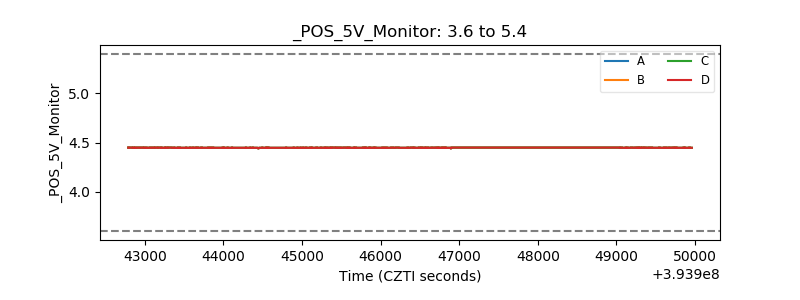 |
| _ROLL_ROT | 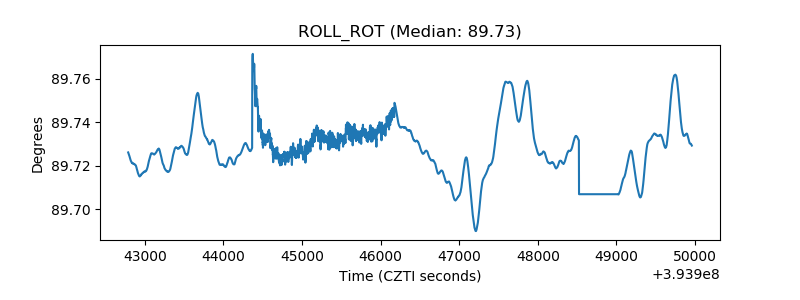 |
| _Roll_DEC | 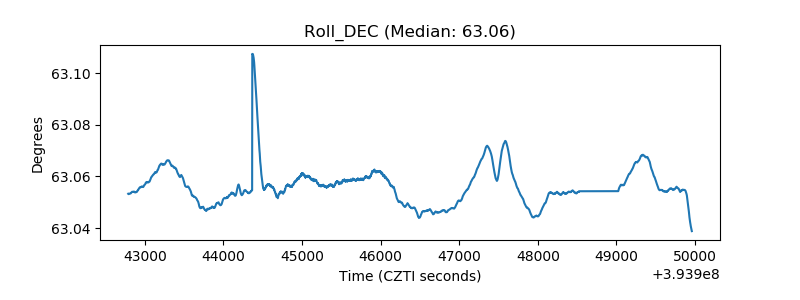 |
| _Roll_RA | 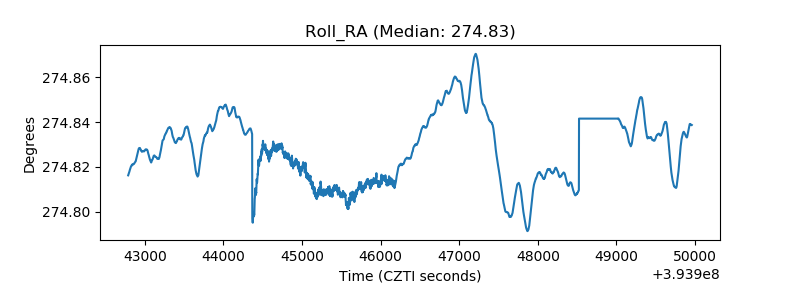 |
| Veto Counter |  |