| Param | Original file | Final file |
|---|---|---|
| Filename | modeM0/AS1A09_014T01_9000005204cztM0_level2.fits | modeM0/AS1A09_014T01_9000005204cztM0_level2_quad_clean.evt |
| Size (bytes) | 106,044,480 | 61,845,120 |
| Size | 101.1 MB | 59.0 MB |
| Events in quadrant A | 670,700 | 305,302 |
| Events in quadrant B | 617,534 | 290,991 |
| Events in quadrant C | 647,904 | 293,957 |
| Events in quadrant D | 566,894 | 272,525 |
| Mode M9 | |||
|---|---|---|---|
| Quadrant | BADHDUFLAG | Total packets | Discarded packets |
| A | 0 | 62 | 0 |
| B | 0 | 62 | 0 |
| C | 0 | 62 | 0 |
| D | 0 | 62 | 0 |
| Mode SS | |||
|---|---|---|---|
| Quadrant | BADHDUFLAG | Total packets | Discarded packets |
| A | 0 | 210 | 0 |
| B | 0 | 210 | 0 |
| C | 0 | 210 | 0 |
| D | 0 | 210 | 0 |
| Mode M0 | |||
|---|---|---|---|
| Quadrant | BADHDUFLAG | Total packets | Discarded packets |
| A | 0 | 21801 | 0 |
| B | 0 | 26035 | 0 |
| C | 0 | 22494 | 0 |
| D | 0 | 24594 | 0 |
| Quadrant | Total seconds | Saturated seconds | Saturation percentage |
|---|---|---|---|
| A | 10234 | 22 | 0.214970% |
| B | 10234 | 274 | 2.677350% |
| C | 10234 | 160 | 1.563416% |
| D | 10234 | 213 | 2.081298% |
Noise dominated data is calculated using 1-second bins in cleaned event files. If a bin has >2000 counts, and if more than 50% of those come from <1% of pixels, then it is considered to be noise-dominated and hence unusable.
| Quadrant | # 1 sec bins | Bins with >0 counts | Bins with >2000 counts | High rate bins dominated by noise | Noise dominated (total time) | Noise dominated (detector-on time) | Marked lightcurve |
|---|---|---|---|---|---|---|---|
| A | 16363 | 10234 | 0 | 0 | 0.00% | 0.00% | 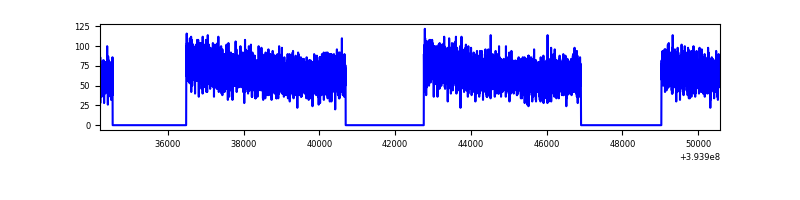 |
| B | 16363 | 10219 | 0 | 0 | 0.00% | 0.00% | 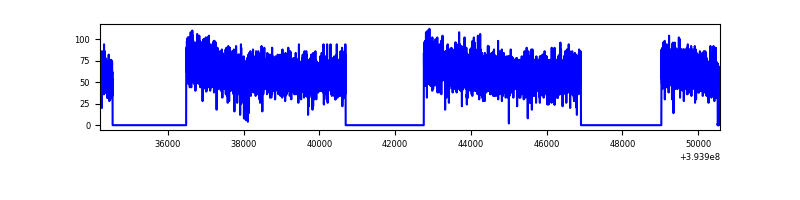 |
| C | 16363 | 10233 | 0 | 0 | 0.00% | 0.00% | 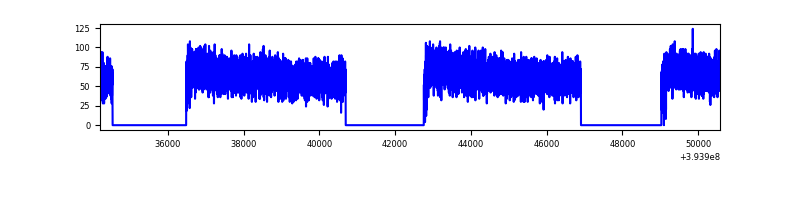 |
| D | 16363 | 10232 | 0 | 0 | 0.00% | 0.00% | 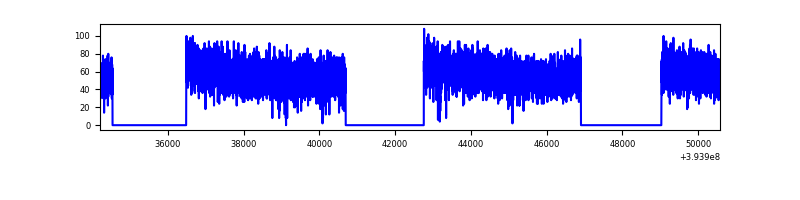 |
Top three noisy pixels from each quadrant. If the there are fewer than three noisy pixels in the level2.evt file, extra rows are filled as -1
| Pixel properties | Quadrant properties | ||||||
|---|---|---|---|---|---|---|---|
| Quadrant | DetID | PixID | Counts | Sigma | Mean | Median | Sigma |
| A | 9 | 19 | 549 | 8.73 | 175 | 167 | 43.8 |
| A | 0 | 29 | 534 | 8.38 | 175 | 167 | 43.8 |
| A | 14 | 79 | 526 | 8.2 | 175 | 167 | 43.8 |
| B | 2 | 9 | 537 | 11.49 | 164 | 158 | 33.0 |
| B | 3 | 80 | 506 | 10.55 | 164 | 158 | 33.0 |
| B | 2 | 8 | 453 | 8.94 | 164 | 158 | 33.0 |
| C | 1 | 81 | 568 | 8.94 | 171 | 162 | 45.4 |
| C | 1 | 80 | 531 | 8.12 | 171 | 162 | 45.4 |
| C | 3 | 202 | 525 | 7.99 | 171 | 162 | 45.4 |
| D | 15 | 47 | 410 | 5.93 | 162 | 149 | 44.0 |
| D | 7 | 3 | 410 | 5.93 | 162 | 149 | 44.0 |
| D | 10 | 189 | 399 | 5.68 | 162 | 149 | 44.0 |
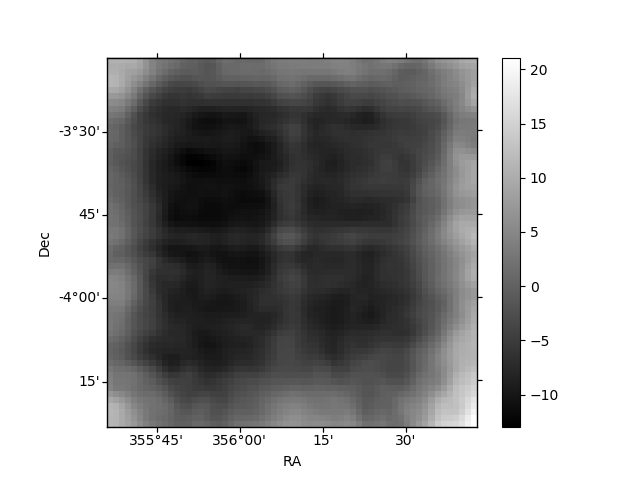
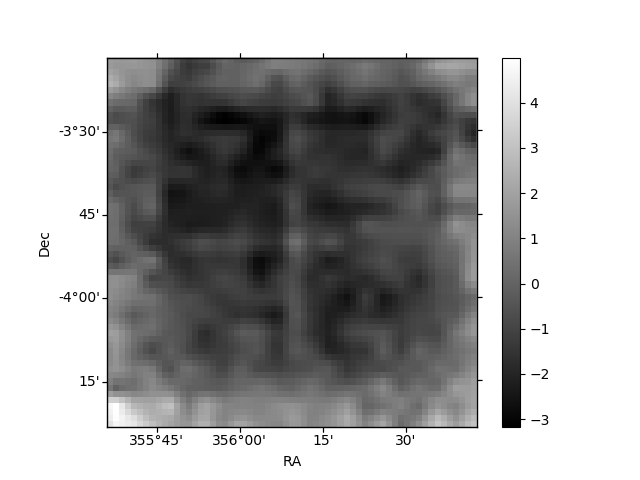
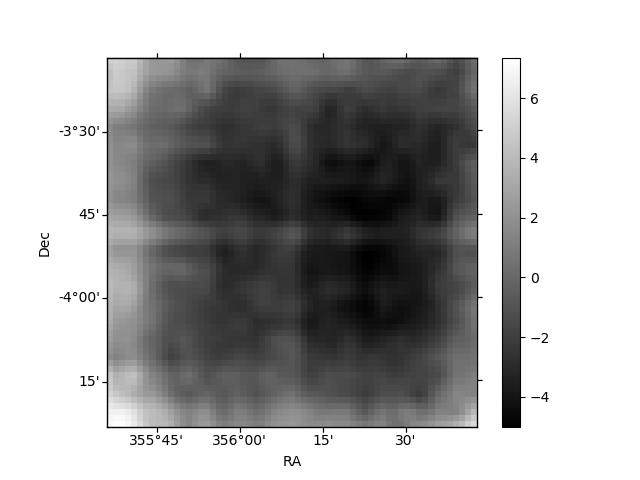
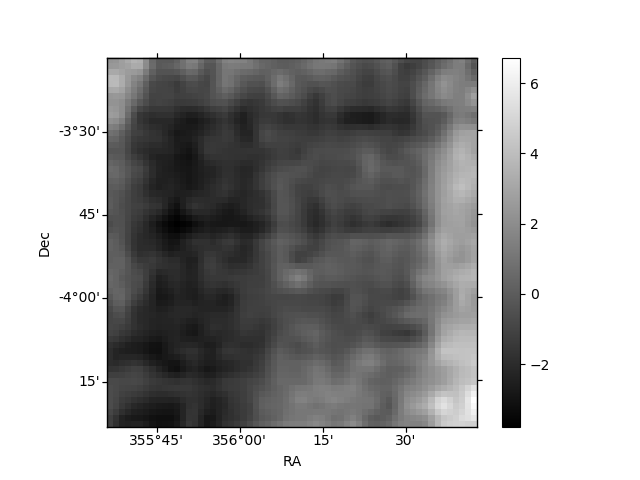
Histogram calculated using DETX and DETY for each event in the final _common_clean file
| Quadrant A | 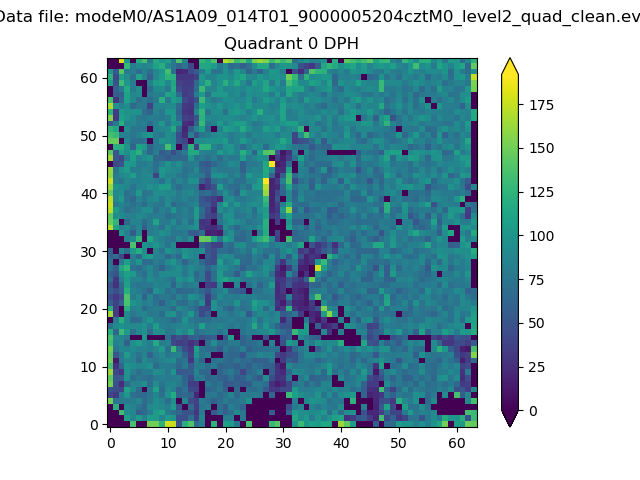 |
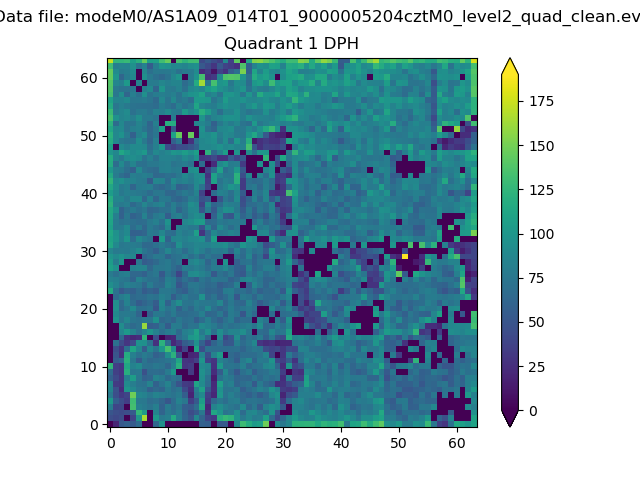 |
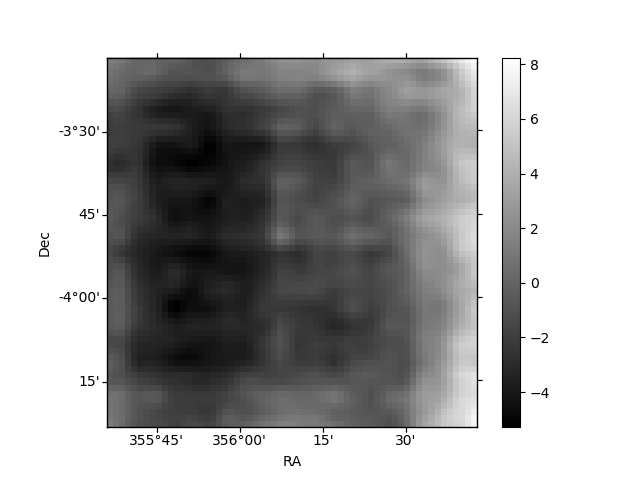
Quadrant B |
|---|---|---|---|
| Quadrant D |  |
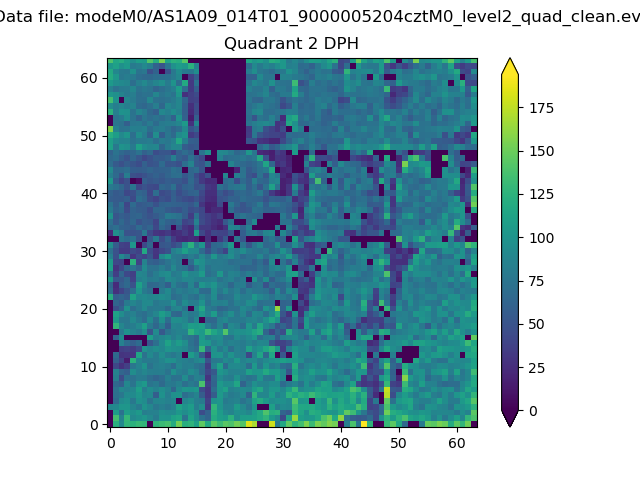 |
Quadrant C |
| Plot type | Count rate plots | Images |
|---|---|---|
| Comparison with Poisson distribution Blue bars denote a histogram of data divided into 1 sec bins. Red curve is a Poisson curve with rate = median count rate of data. |
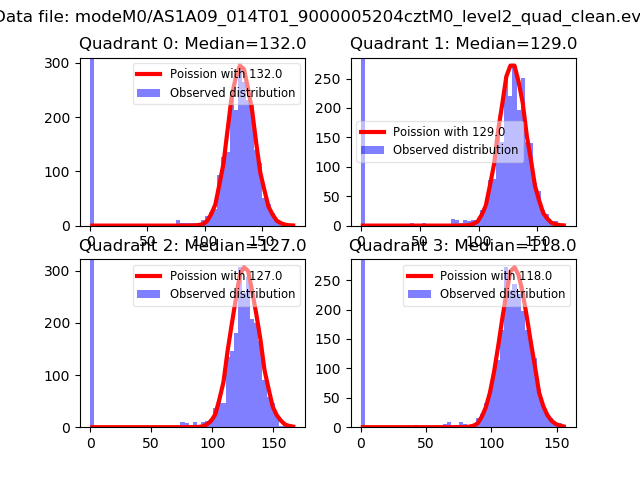 |
 |
| Quadrant-wise count rates Data is divided into 100 sec bins |
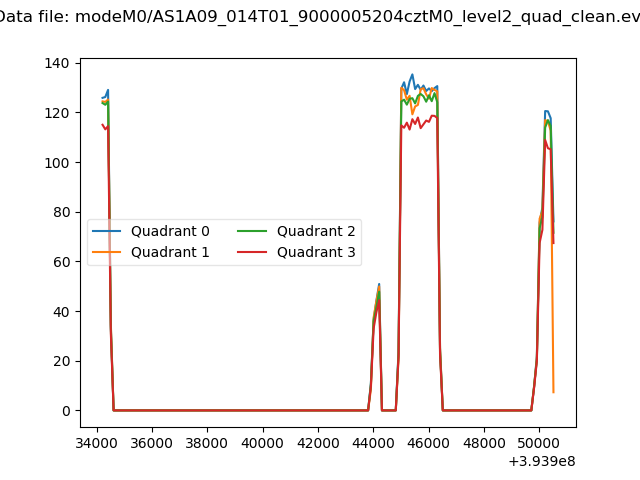 |
|
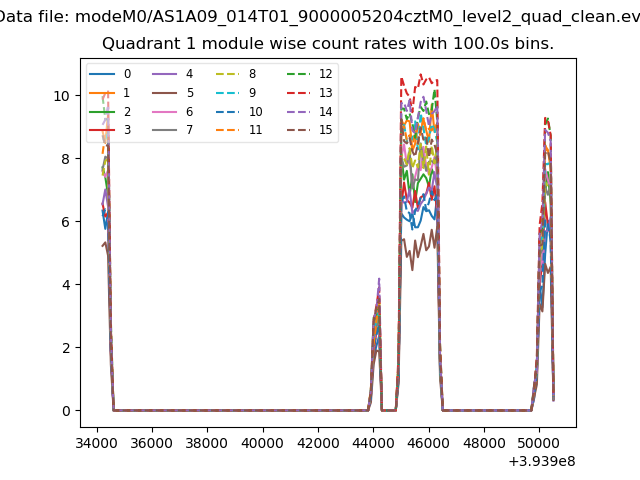
| Module-wise count rates for Quadrant A Data is divided into 100 sec bins |
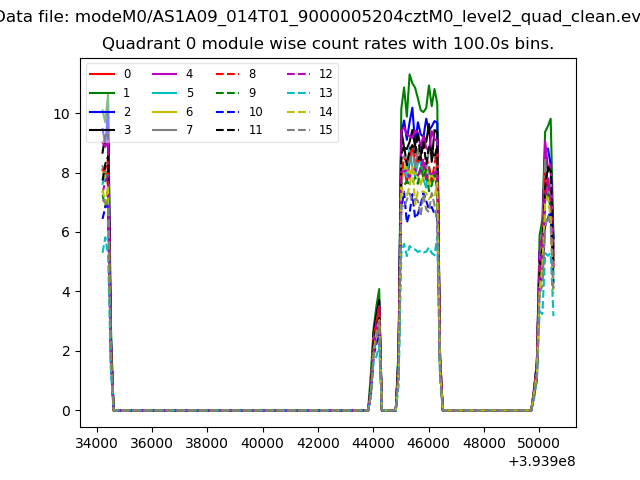 |
 |
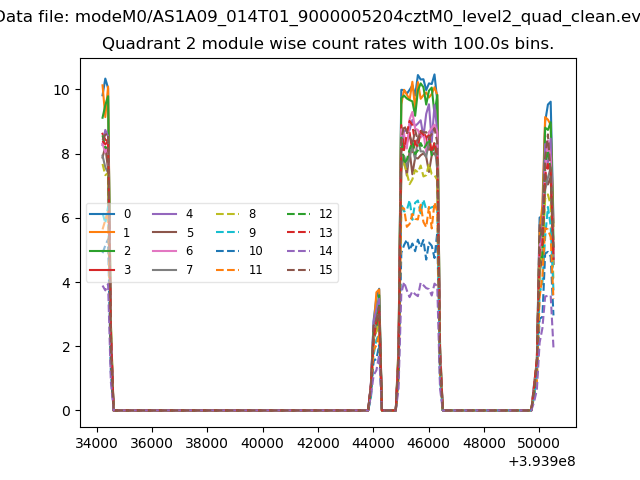
| Module-wise count rates for Quadrant B Data is divided into 100 sec bins |
 |
 |
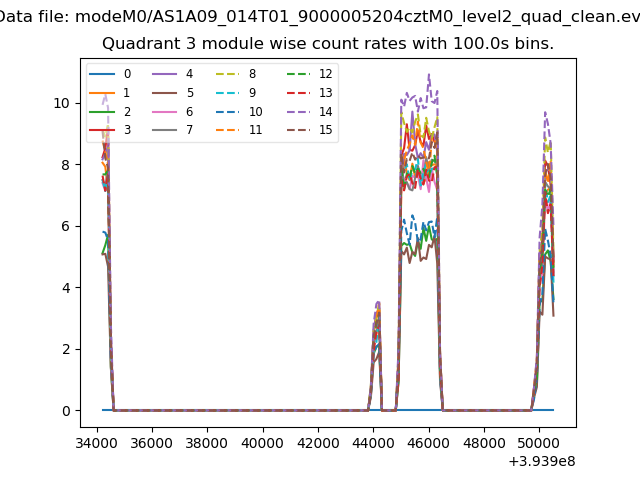
| Module-wise count rates for Quadrant C Data is divided into 100 sec bins |
 |
 |
| Module-wise count rates for Quadrant D Data is divided into 100 sec bins |
 |
 |
| Parameter | Plot |
|---|---|
| CZT HV Monitor | 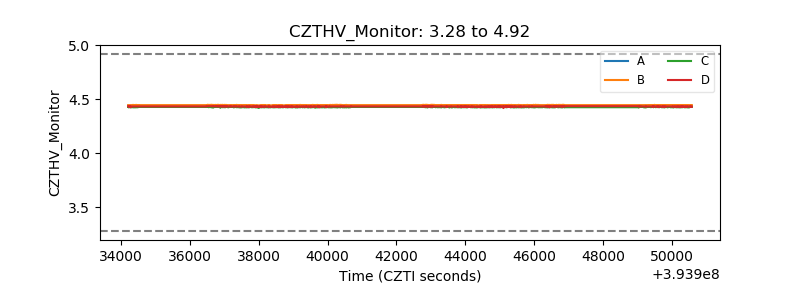 |
| D_VDD | 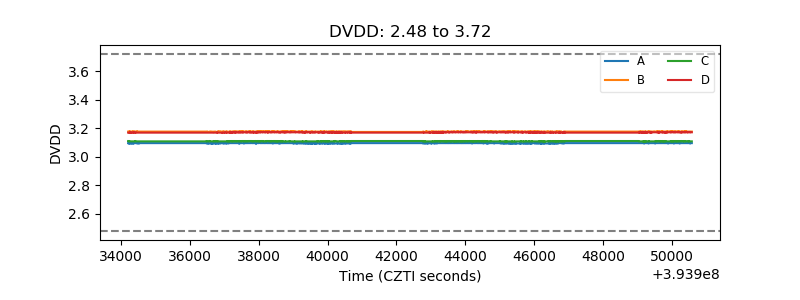 |
| Temperature 1 | 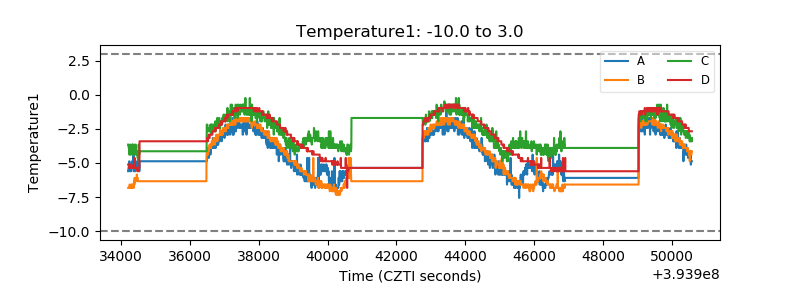 |
| Veto HV Monitor | 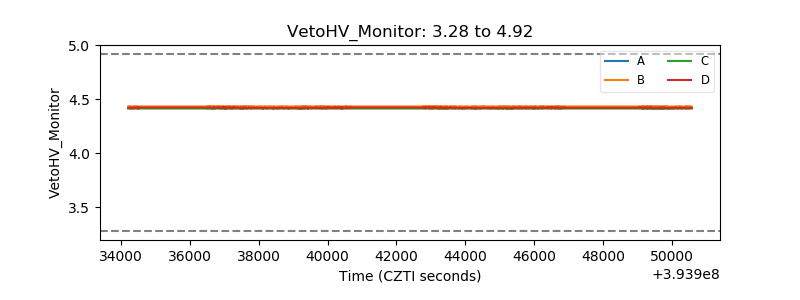 |
| Veto LLD | 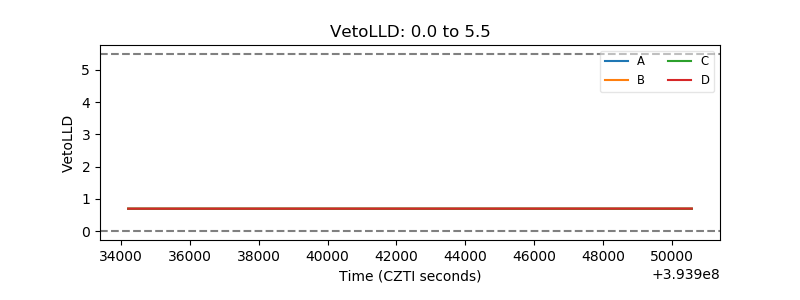 |
| Alpha Counter | 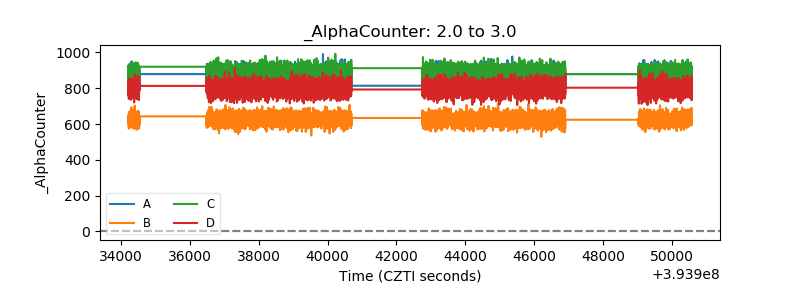 |
| _CPM_Rate | 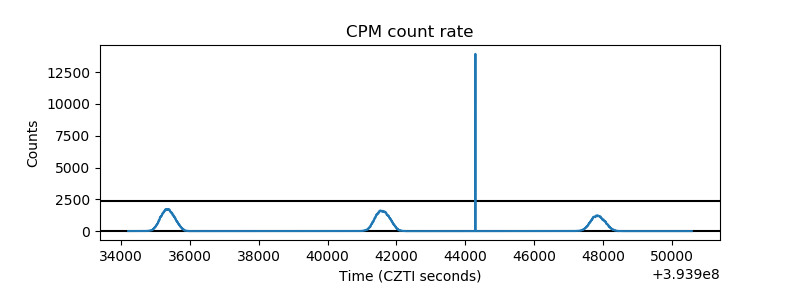 |
| CZT Counter | 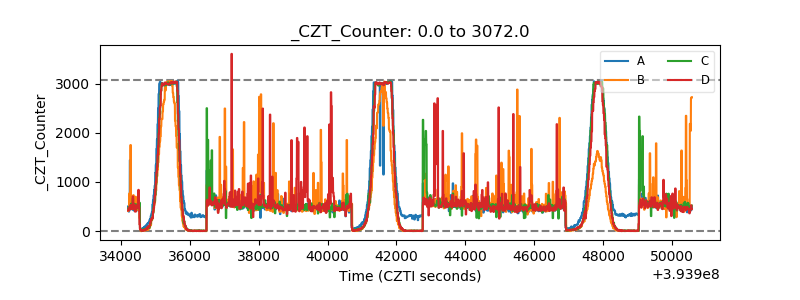 |
| +2.5 Volts monitor | 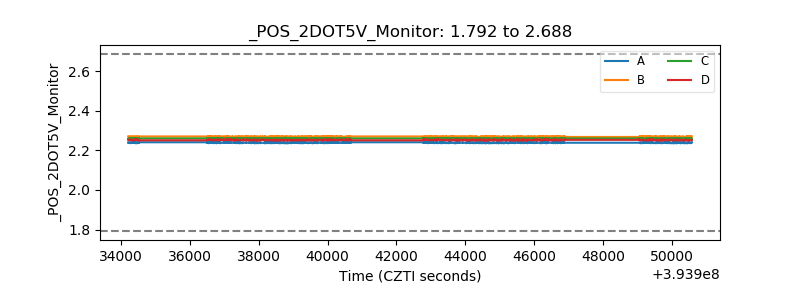 |
| +5 Volts monitor | 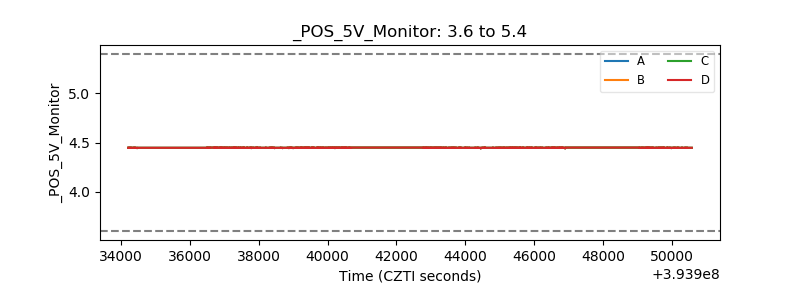 |
| _ROLL_ROT | 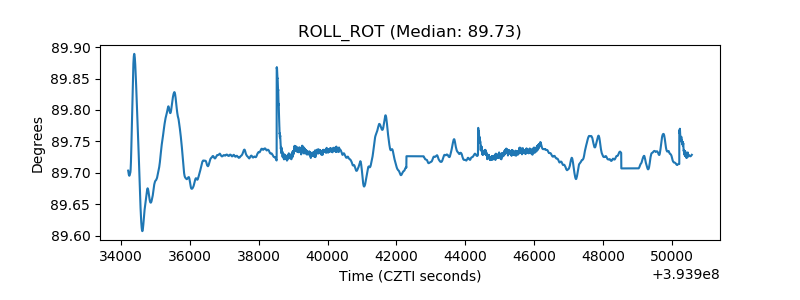 |
| _Roll_DEC | 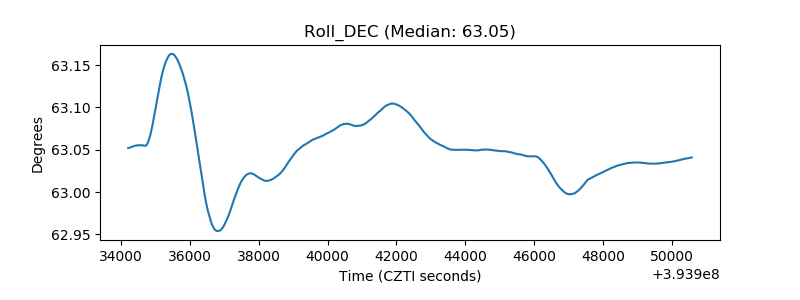 |
| _Roll_RA | 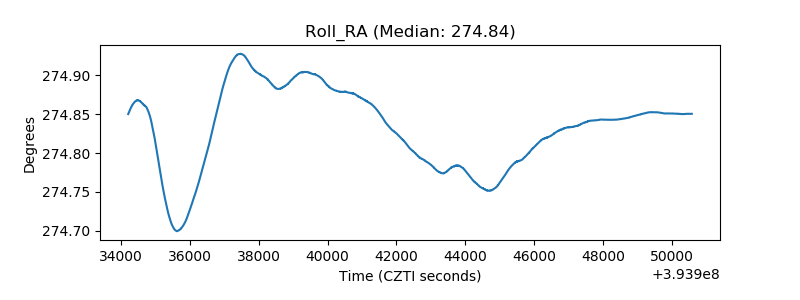 |
| Veto Counter | 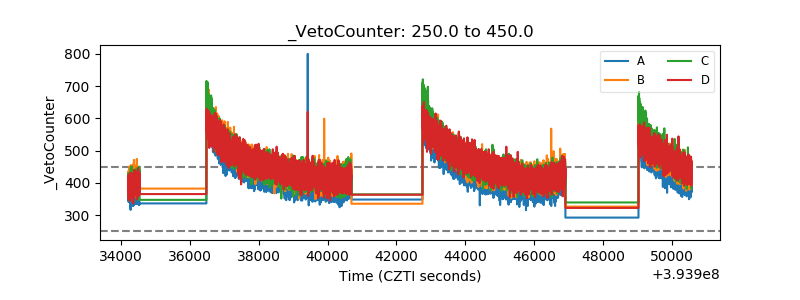 |