| Param | Original file | Final file |
|---|---|---|
| Filename | modeM0/AS1A11_003T08_9000005202_36461cztM0_level2.evt | modeM0/AS1A11_003T08_9000005202_36461cztM0_level2_quad_clean.evt |
| Size (bytes) | 442,632,960 | 85,685,760 |
| Size | 422.1 MB | 81.7 MB |
| Events in quadrant A | 2,801,745 | 569,731 |
| Events in quadrant B | 4,050,486 | 551,391 |
| Events in quadrant C | 3,074,275 | 554,894 |
| Events in quadrant D | 3,105,176 | 534,014 |
| Mode SS | |||
|---|---|---|---|
| Quadrant | BADHDUFLAG | Total packets | Discarded packets |
| A | 0 | 114 | 0 |
| B | 0 | 114 | 0 |
| C | 0 | 114 | 0 |
| D | 0 | 114 | 0 |
| Mode M9 | |||
|---|---|---|---|
| Quadrant | BADHDUFLAG | Total packets | Discarded packets |
| A | 0 | 35 | 0 |
| B | 0 | 35 | 0 |
| C | 0 | 35 | 0 |
| D | 0 | 35 | 0 |
| Mode M0 | |||
|---|---|---|---|
| Quadrant | BADHDUFLAG | Total packets | Discarded packets |
| A | 0 | 11686 | 3 |
| B | 0 | 15569 | 2 |
| C | 0 | 12296 | 2 |
| D | 0 | 12754 | 2 |
| Quadrant | Total seconds | Saturated seconds | Saturation percentage |
|---|---|---|---|
| A | 5496 | 11 | 0.200146% |
| B | 5496 | 430 | 7.823872% |
| C | 5496 | 94 | 1.710335% |
| D | 5496 | 61 | 1.109898% |
Noise dominated data is calculated using 1-second bins in cleaned event files. If a bin has >2000 counts, and if more than 50% of those come from <1% of pixels, then it is considered to be noise-dominated and hence unusable.
| Quadrant | # 1 sec bins | Bins with >0 counts | Bins with >2000 counts | High rate bins dominated by noise | Noise dominated (total time) | Noise dominated (detector-on time) | Marked lightcurve |
|---|---|---|---|---|---|---|---|
| A | 9021 | 5498 | 0 | 0 | 0.00% | 0.00% | 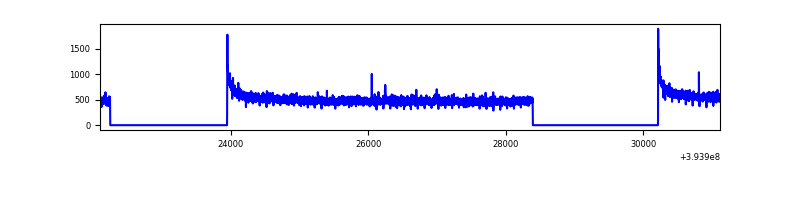 |
| B | 9021 | 5498 | 294 | 294 | 3.26% | 5.35% | 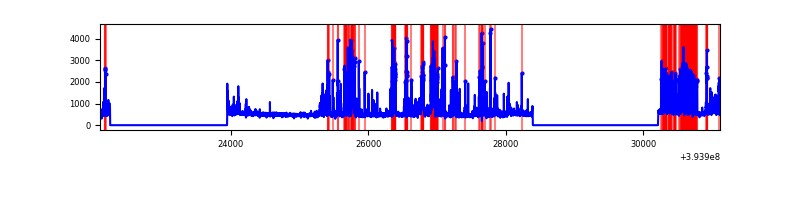 |
| C | 9021 | 5498 | 41 | 41 | 0.45% | 0.75% | 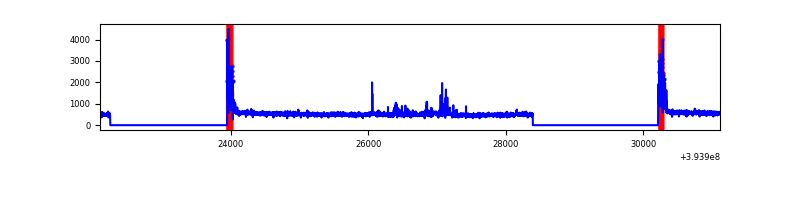 |
| D | 9021 | 5498 | 45 | 45 | 0.50% | 0.82% | 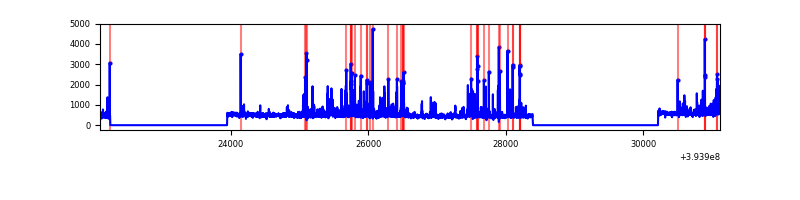 |
Top three noisy pixels from each quadrant. If the there are fewer than three noisy pixels in the level2.evt file, extra rows are filled as -1
| Pixel properties | Quadrant properties | ||||||
|---|---|---|---|---|---|---|---|
| Quadrant | DetID | PixID | Counts | Sigma | Mean | Median | Sigma |
| A | 10 | 83 | 193114 | 1423.0 | 672 | 660 | 135.2 |
| A | 13 | 254 | 8934 | 61.18 | 672 | 660 | 135.2 |
| A | 13 | 6 | 7404 | 49.86 | 672 | 660 | 135.2 |
| B | 5 | 172 | 761142 | 6113.63 | 644 | 625 | 124.4 |
| B | 0 | 182 | 506299 | 4065.0 | 644 | 625 | 124.4 |
| B | 5 | 255 | 117954 | 943.18 | 644 | 625 | 124.4 |
| C | 0 | 10 | 289372 | 1931.31 | 641 | 645 | 149.5 |
| C | 15 | 214 | 257930 | 1720.99 | 641 | 645 | 149.5 |
| C | 10 | 49 | 24468 | 159.35 | 641 | 645 | 149.5 |
| D | 2 | 250 | 139321 | 869.38 | 649 | 631 | 159.5 |
| D | 2 | 153 | 138335 | 863.2 | 649 | 631 | 159.5 |
| D | 13 | 249 | 62554 | 388.16 | 649 | 631 | 159.5 |
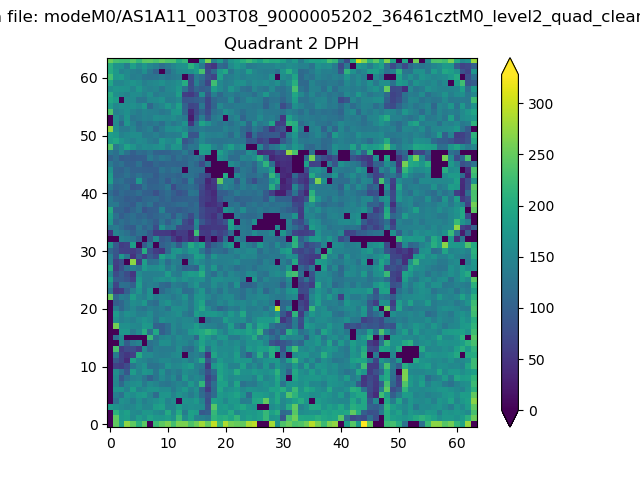
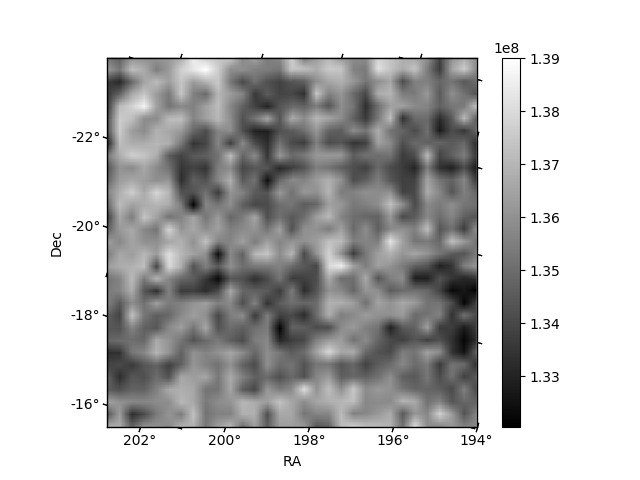
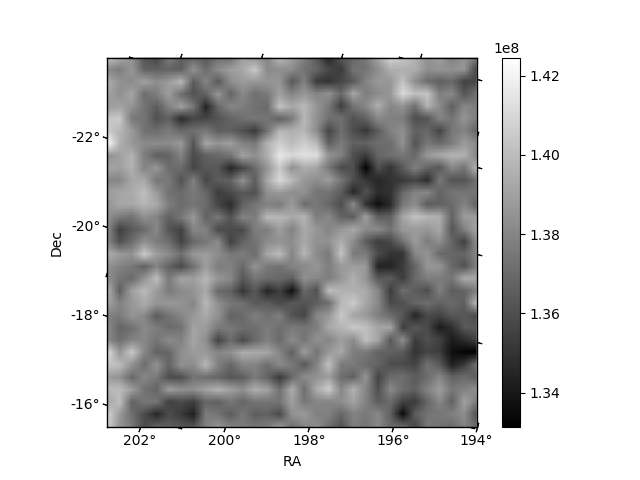
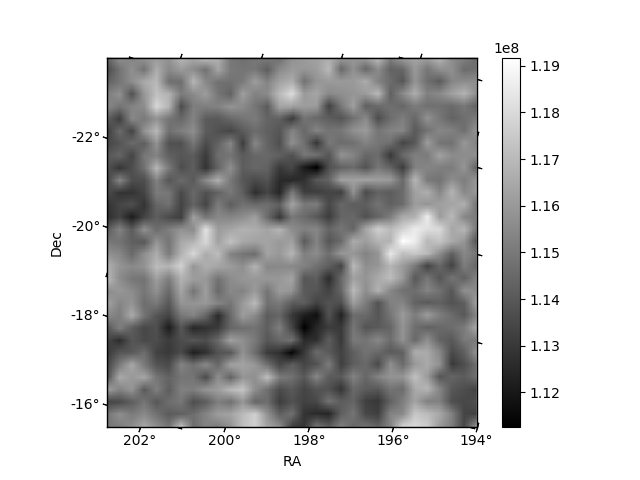
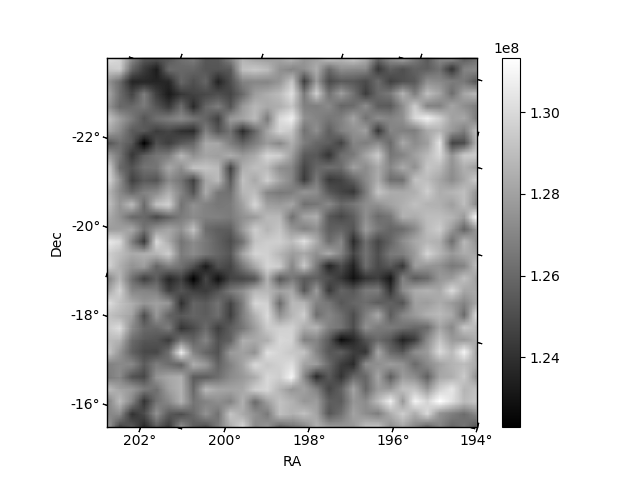
Histogram calculated using DETX and DETY for each event in the final _common_clean file
| Quadrant A | 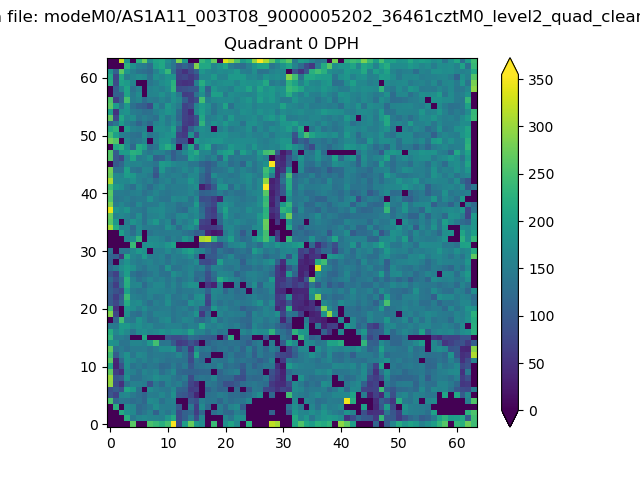 |
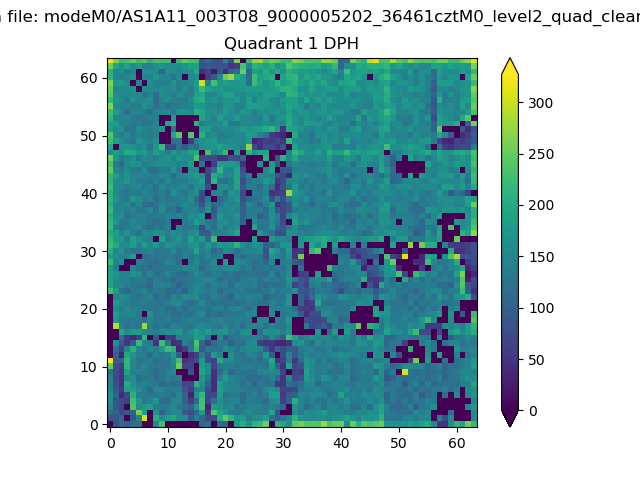 |
Quadrant B |
|---|---|---|---|
| Quadrant D | 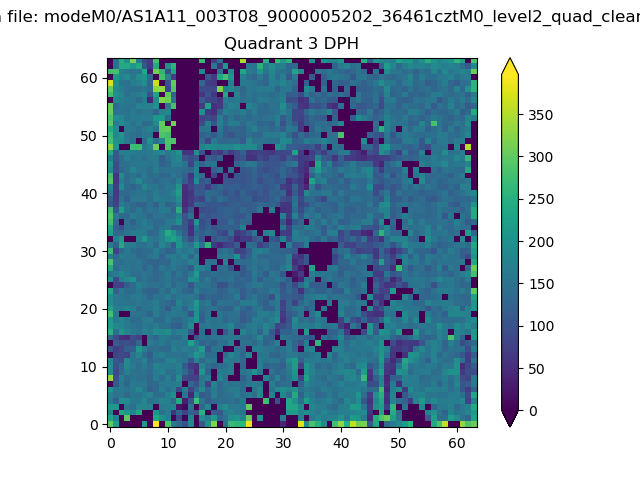 |
 |
Quadrant C |
| Plot type | Count rate plots | Images |
|---|---|---|
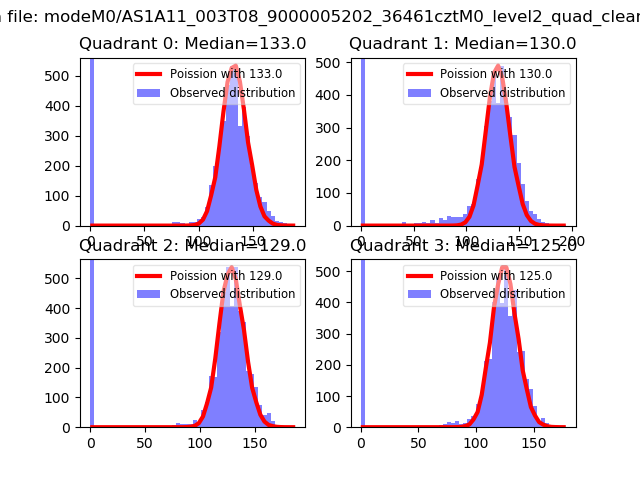
| Comparison with Poisson distribution Blue bars denote a histogram of data divided into 1 sec bins. Red curve is a Poisson curve with rate = median count rate of data. |
 |
 |
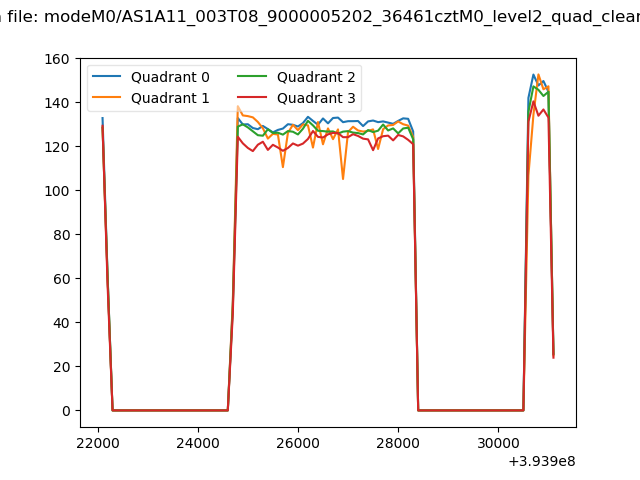
| Quadrant-wise count rates Data is divided into 100 sec bins |
 |
|
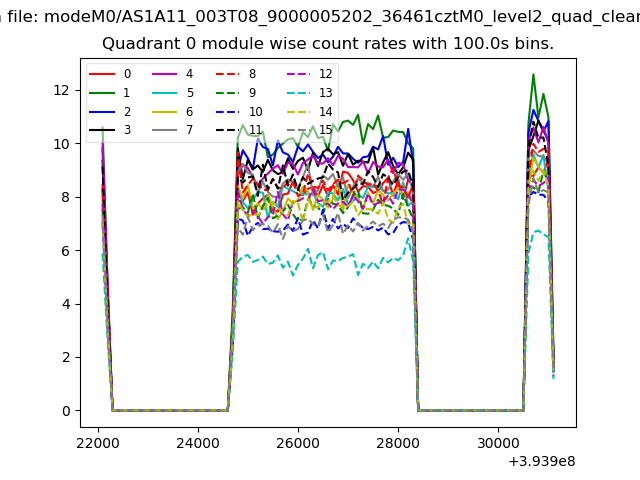
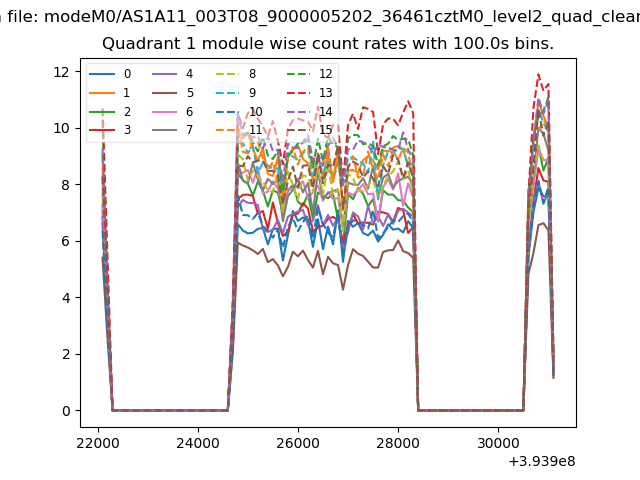
| Module-wise count rates for Quadrant A Data is divided into 100 sec bins |
 |
 |
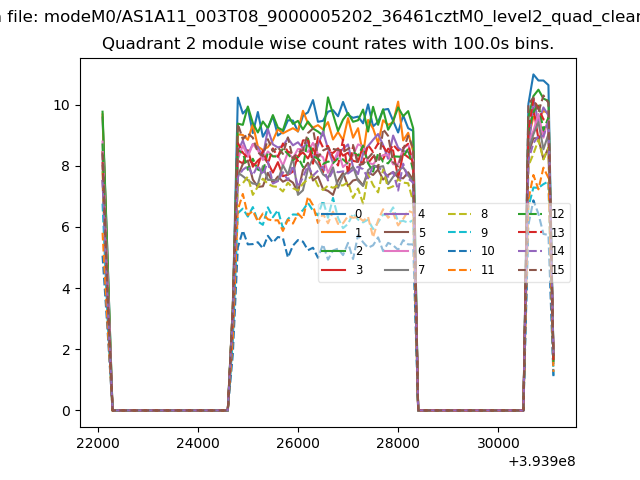
| Module-wise count rates for Quadrant B Data is divided into 100 sec bins |
 |
 |
| Module-wise count rates for Quadrant C Data is divided into 100 sec bins |
 |
 |
| Module-wise count rates for Quadrant D Data is divided into 100 sec bins |
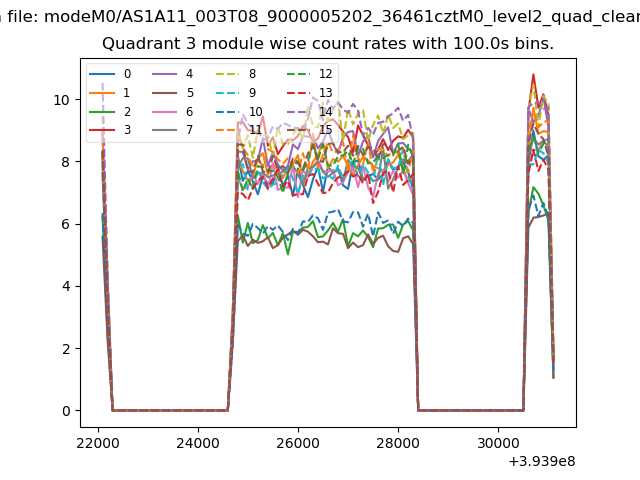 |
 |
| Parameter | Plot |
|---|---|
| CZT HV Monitor | 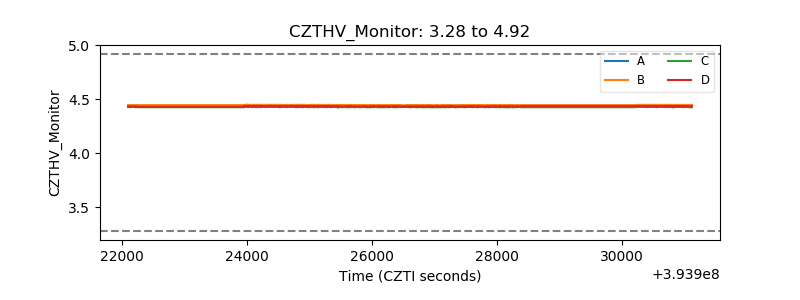 |
| D_VDD | 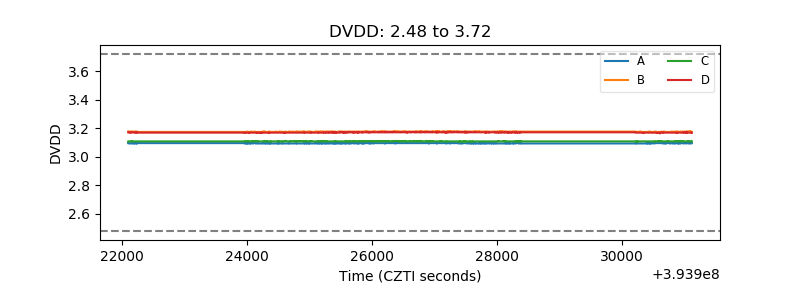 |
| Temperature 1 | 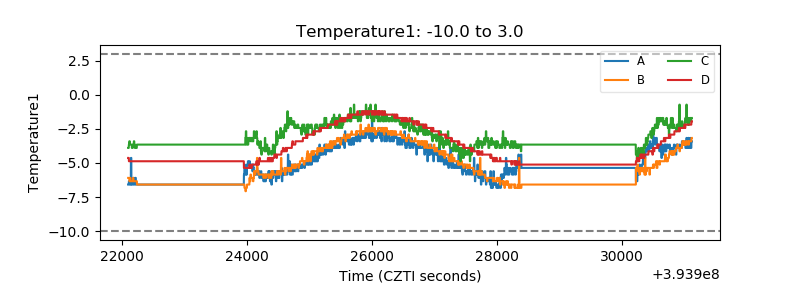 |
| Veto HV Monitor | 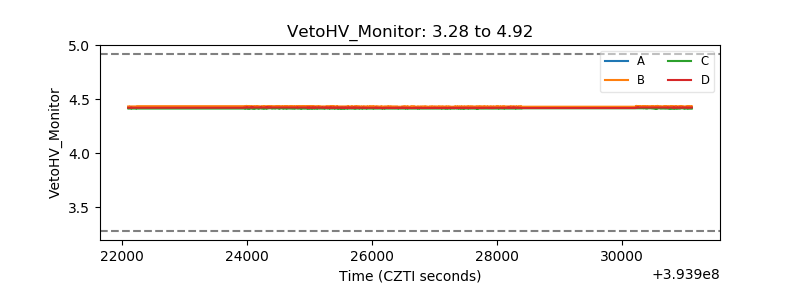 |
| Veto LLD | 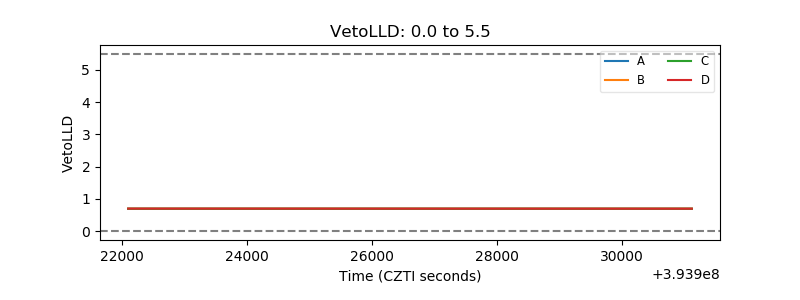 |
| Alpha Counter | 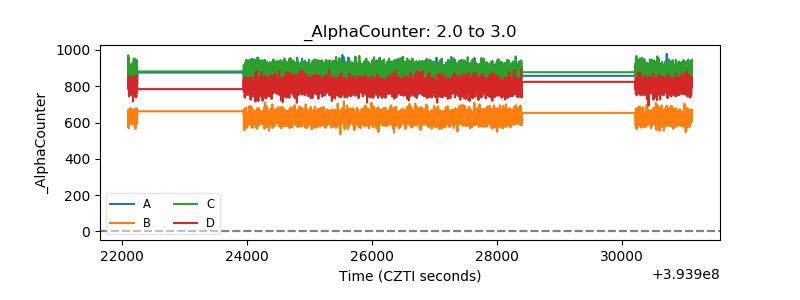 |
| _CPM_Rate | 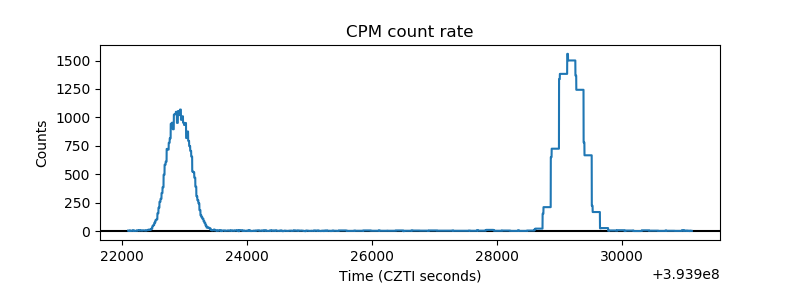 |
| CZT Counter | 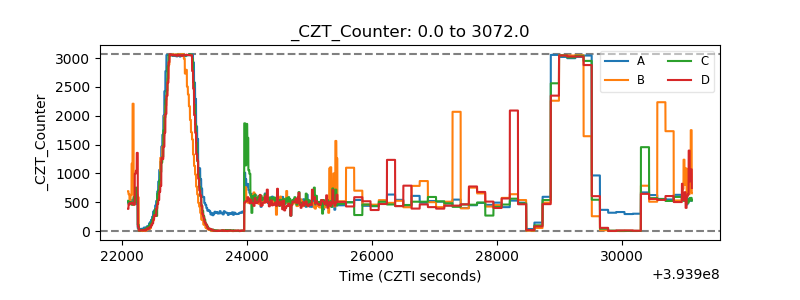 |
| +2.5 Volts monitor | 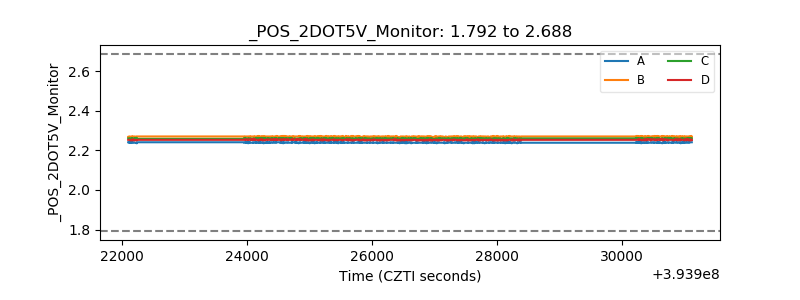 |
| +5 Volts monitor | 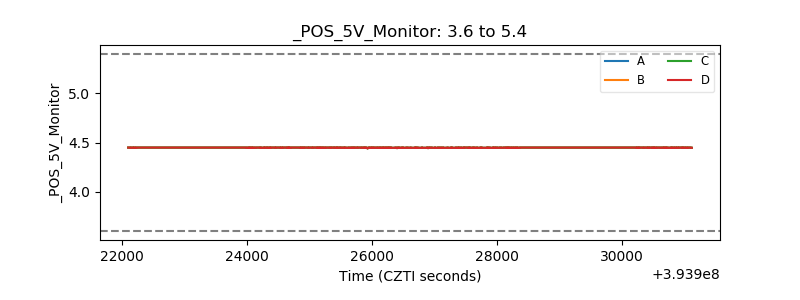 |
| _ROLL_ROT | 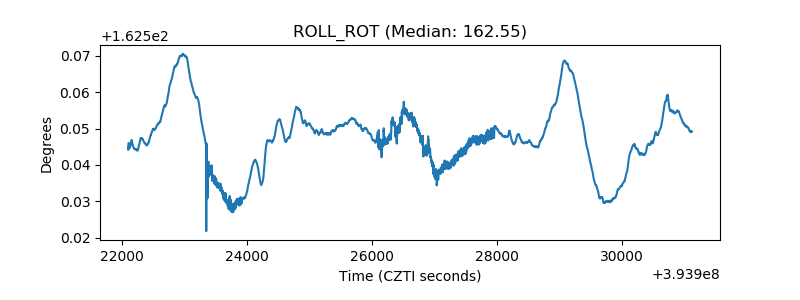 |
| _Roll_DEC | 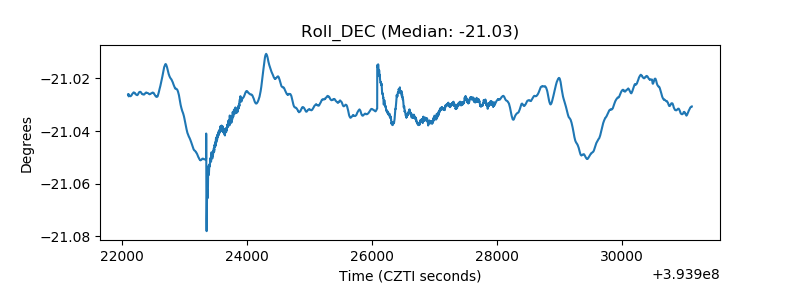 |
| _Roll_RA | 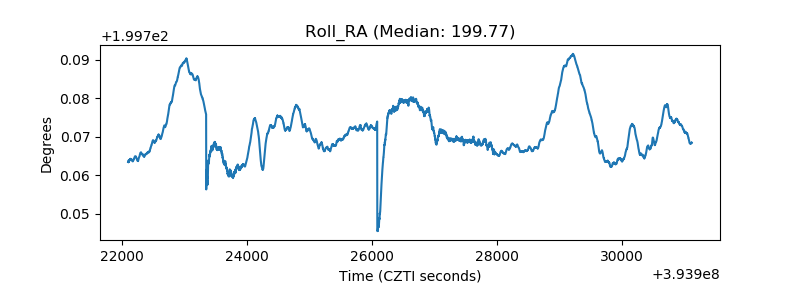 |
| Veto Counter | 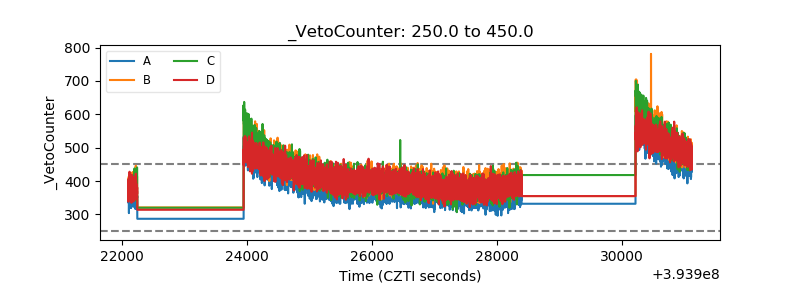 |