| Param | Original file | Final file |
|---|---|---|
| Filename | modeM0/AS1C07_009T01_9000005200_36453cztM0_level2.evt | modeM0/AS1C07_009T01_9000005200_36453cztM0_level2_quad_clean.evt |
| Size (bytes) | 407,960,640 | 94,492,800 |
| Size | 389.1 MB | 90.1 MB |
| Events in quadrant A | 2,663,523 | 631,068 |
| Events in quadrant B | 3,346,653 | 624,667 |
| Events in quadrant C | 2,928,594 | 618,383 |
| Events in quadrant D | 3,034,279 | 594,690 |
| Mode M0 | |||
|---|---|---|---|
| Quadrant | BADHDUFLAG | Total packets | Discarded packets |
| A | 0 | 11637 | 3 |
| B | 0 | 13709 | 2 |
| C | 0 | 12068 | 2 |
| D | 0 | 12997 | 2 |
| Mode SS | |||
|---|---|---|---|
| Quadrant | BADHDUFLAG | Total packets | Discarded packets |
| A | 0 | 112 | 0 |
| B | 0 | 112 | 0 |
| C | 0 | 112 | 0 |
| D | 0 | 112 | 0 |
| Mode M9 | |||
|---|---|---|---|
| Quadrant | BADHDUFLAG | Total packets | Discarded packets |
| A | 0 | 28 | 0 |
| B | 0 | 28 | 0 |
| C | 0 | 28 | 0 |
| D | 0 | 29 | 0 |
| Quadrant | Total seconds | Saturated seconds | Saturation percentage |
|---|---|---|---|
| A | 5626 | 13 | 0.231070% |
| B | 5626 | 132 | 2.346250% |
| C | 5626 | 68 | 1.208674% |
| D | 5626 | 92 | 1.635265% |
Noise dominated data is calculated using 1-second bins in cleaned event files. If a bin has >2000 counts, and if more than 50% of those come from <1% of pixels, then it is considered to be noise-dominated and hence unusable.
| Quadrant | # 1 sec bins | Bins with >0 counts | Bins with >2000 counts | High rate bins dominated by noise | Noise dominated (total time) | Noise dominated (detector-on time) | Marked lightcurve |
|---|---|---|---|---|---|---|---|
| A | 7149 | 5627 | 0 | 0 | 0.00% | 0.00% | 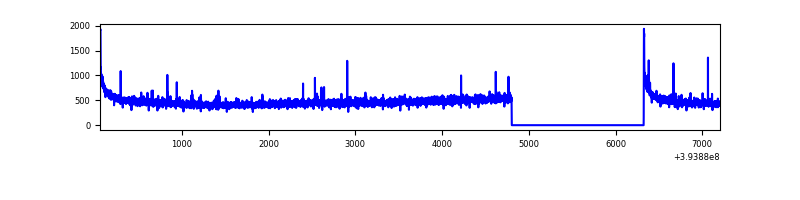 |
| B | 7149 | 5627 | 69 | 69 | 0.97% | 1.23% | 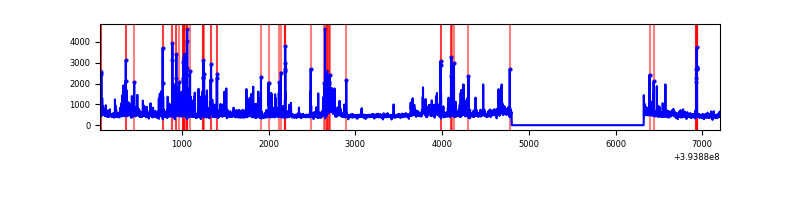 |
| C | 7149 | 5627 | 46 | 46 | 0.64% | 0.82% | 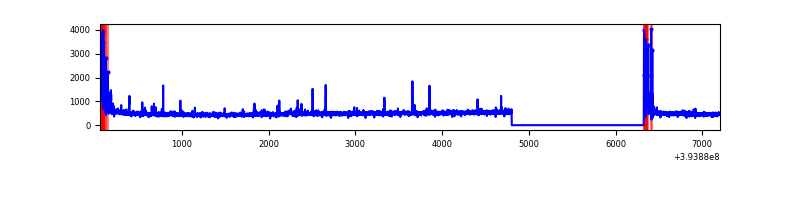 |
| D | 7149 | 5627 | 80 | 80 | 1.12% | 1.42% | 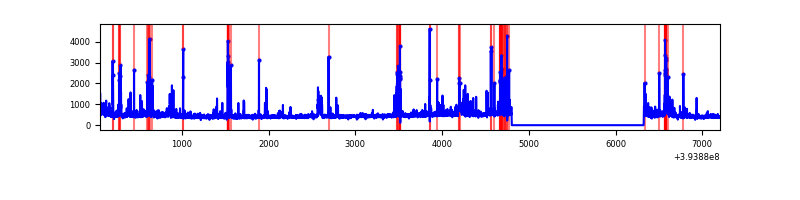 |
Top three noisy pixels from each quadrant. If the there are fewer than three noisy pixels in the level2.evt file, extra rows are filled as -1
| Pixel properties | Quadrant properties | ||||||
|---|---|---|---|---|---|---|---|
| Quadrant | DetID | PixID | Counts | Sigma | Mean | Median | Sigma |
| A | 10 | 83 | 197381 | 1542.71 | 629 | 615 | 127.5 |
| A | 13 | 254 | 9585 | 70.33 | 629 | 615 | 127.5 |
| A | 13 | 6 | 7759 | 56.01 | 629 | 615 | 127.5 |
| B | 5 | 255 | 352543 | 2974.71 | 619 | 602 | 118.3 |
| B | 5 | 172 | 351616 | 2966.87 | 619 | 602 | 118.3 |
| B | 0 | 190 | 58404 | 488.56 | 619 | 602 | 118.3 |
| C | 15 | 214 | 258927 | 1822.26 | 611 | 614 | 141.8 |
| C | 0 | 10 | 229322 | 1613.42 | 611 | 614 | 141.8 |
| C | 15 | 159 | 20330 | 139.08 | 611 | 614 | 141.8 |
| D | 13 | 171 | 146667 | 996.22 | 609 | 593 | 146.6 |
| D | 13 | 249 | 103350 | 700.8 | 609 | 593 | 146.6 |
| D | 10 | 118 | 89089 | 603.54 | 609 | 593 | 146.6 |
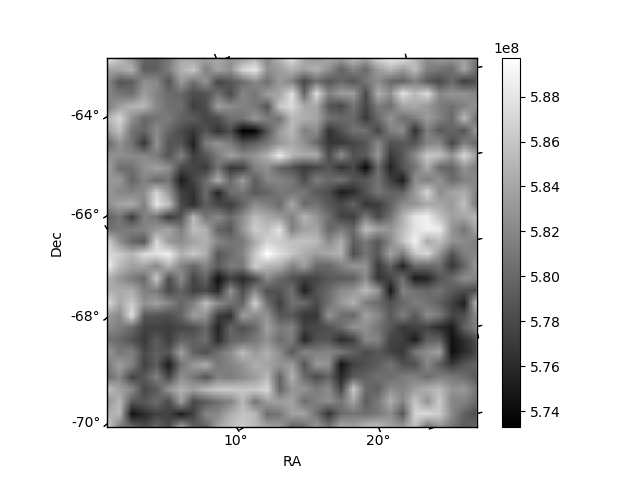
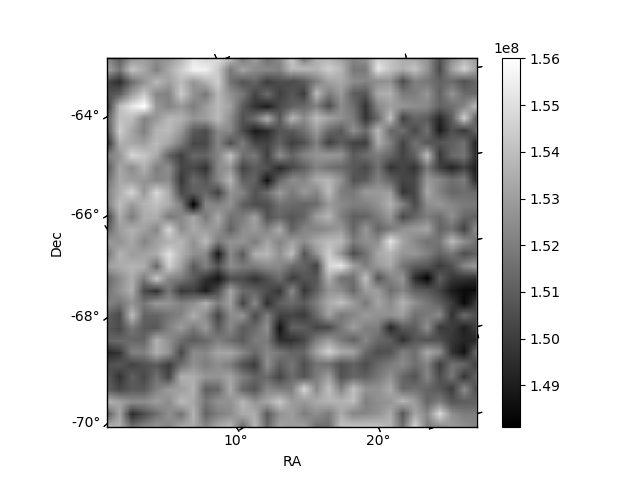
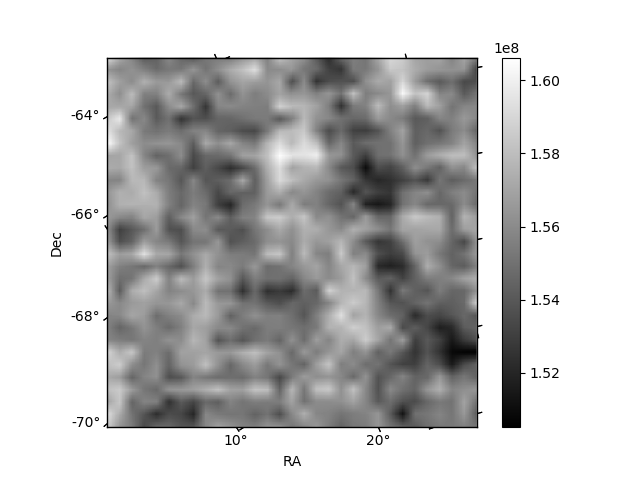
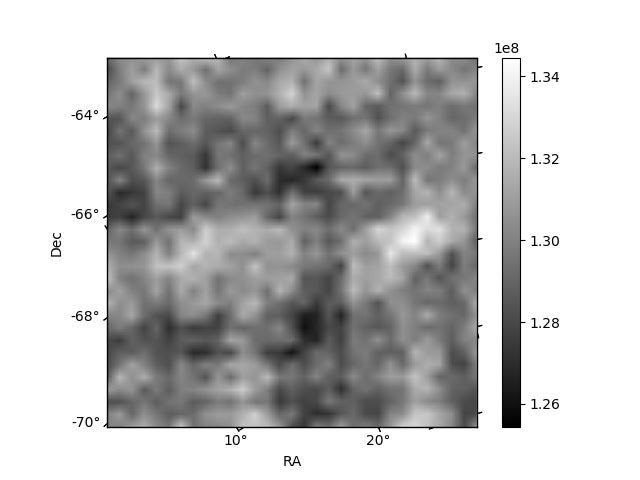
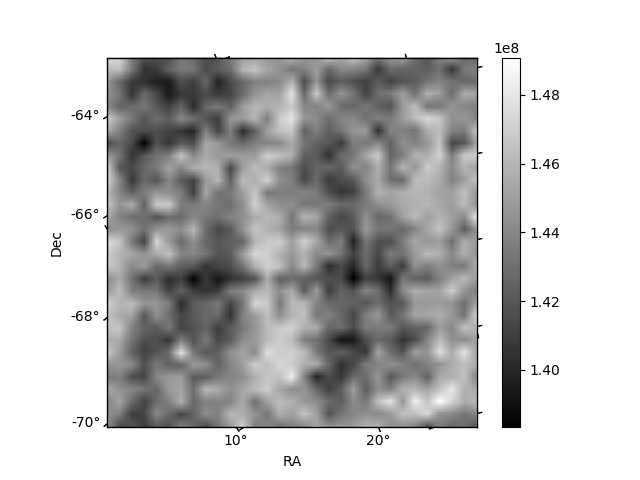
Histogram calculated using DETX and DETY for each event in the final _common_clean file
| Quadrant A | 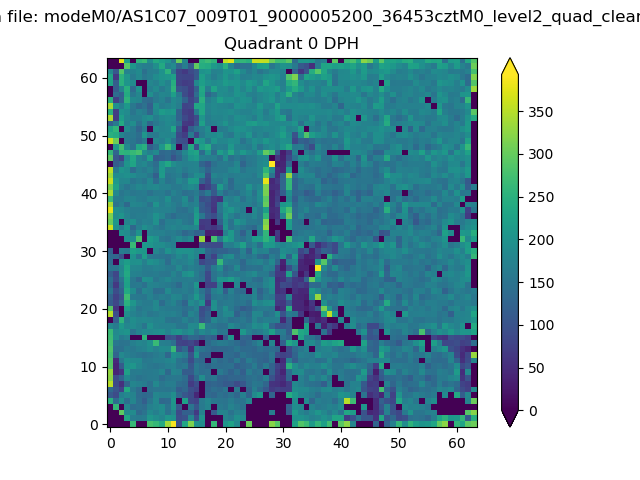 |
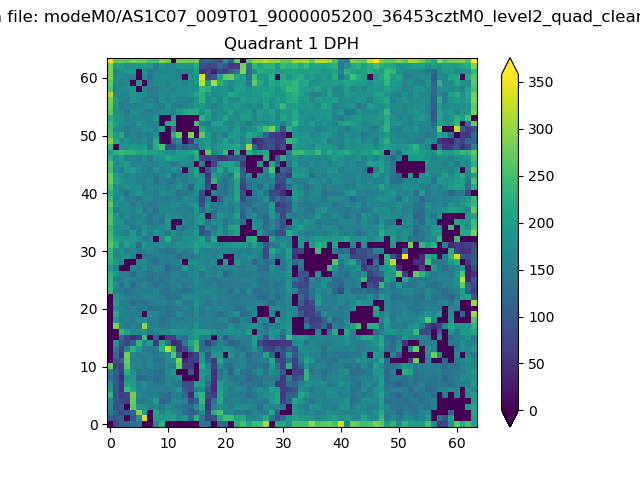 |
Quadrant B |
|---|---|---|---|
| Quadrant D | 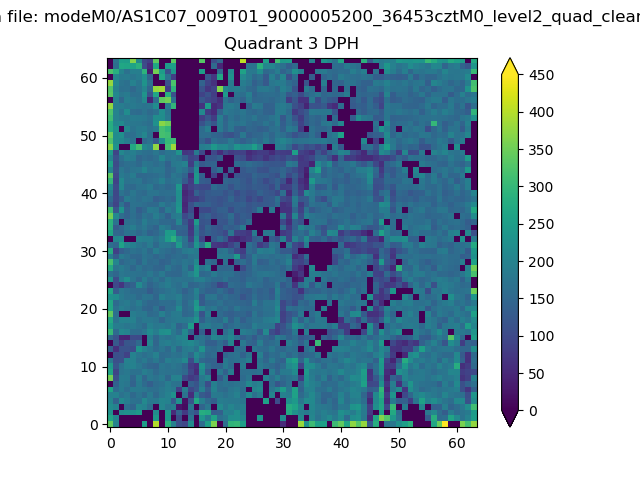 |
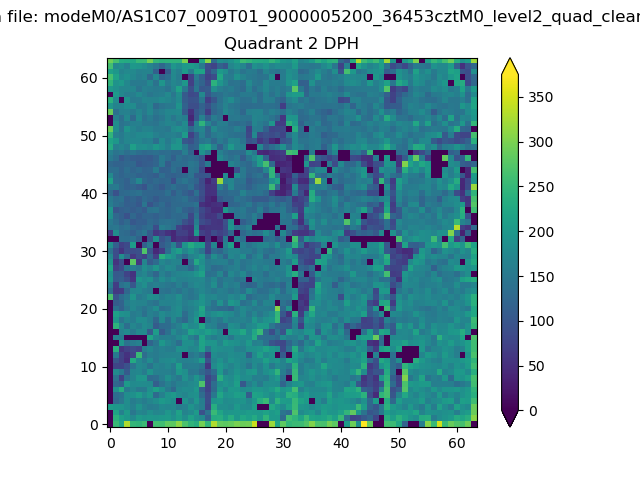 |
Quadrant C |
| Plot type | Count rate plots | Images |
|---|---|---|
| Comparison with Poisson distribution Blue bars denote a histogram of data divided into 1 sec bins. Red curve is a Poisson curve with rate = median count rate of data. |
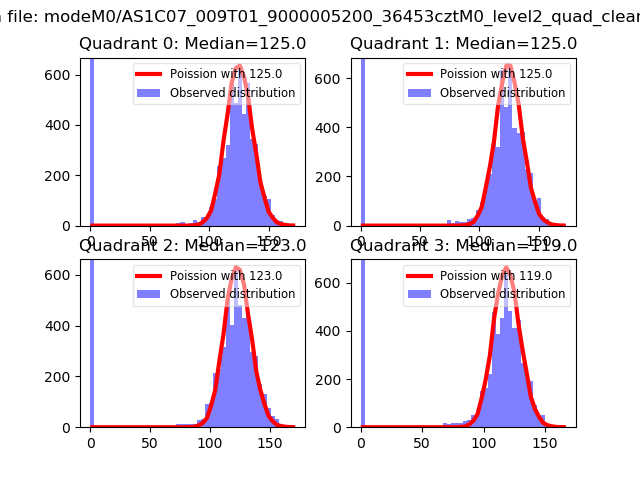 |
 |
| Quadrant-wise count rates Data is divided into 100 sec bins |
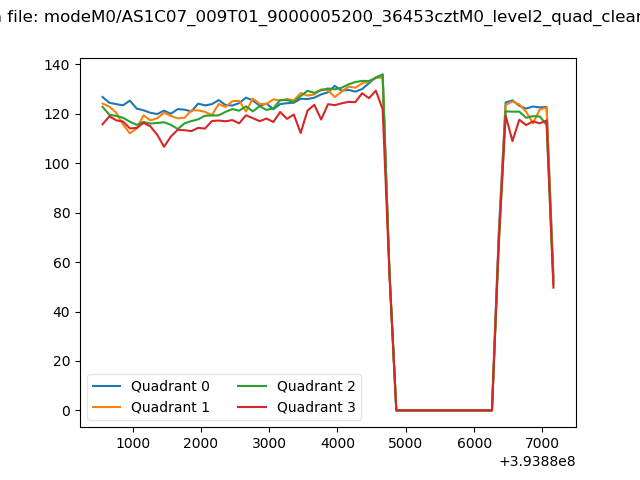 |
|
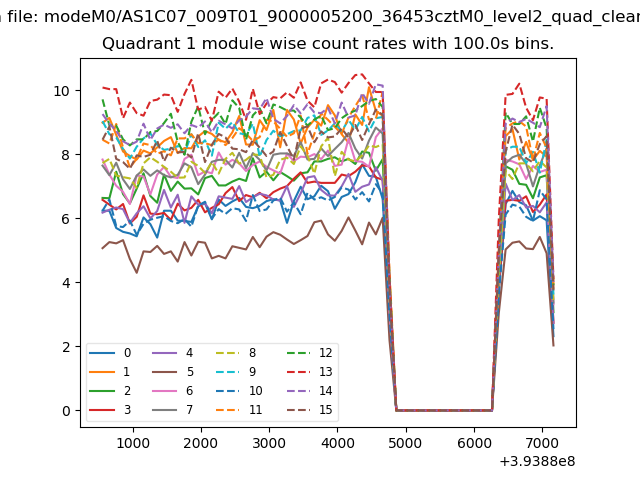
| Module-wise count rates for Quadrant A Data is divided into 100 sec bins |
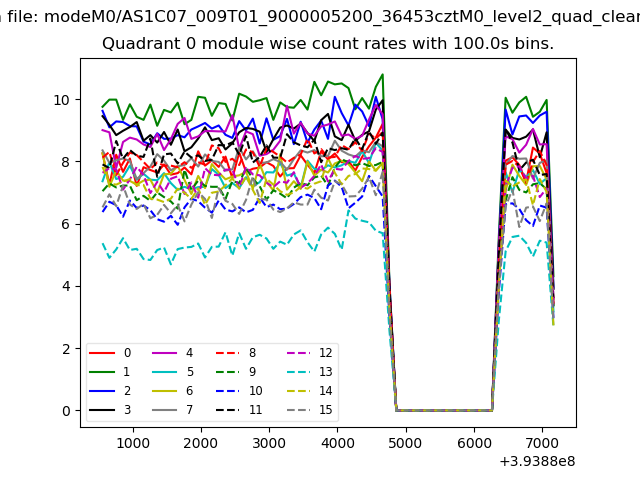 |
 |
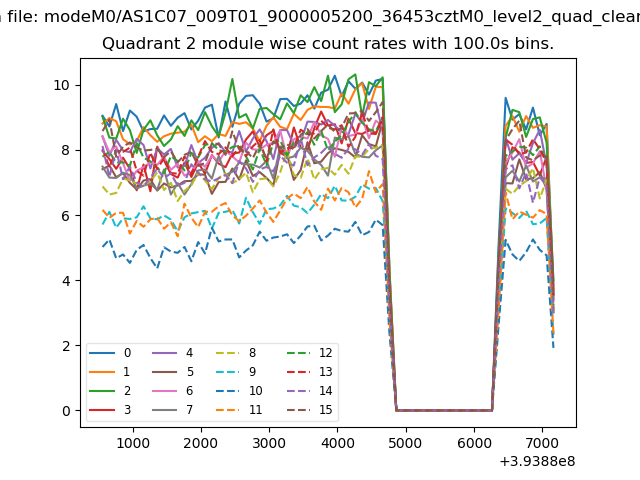
| Module-wise count rates for Quadrant B Data is divided into 100 sec bins |
 |
 |
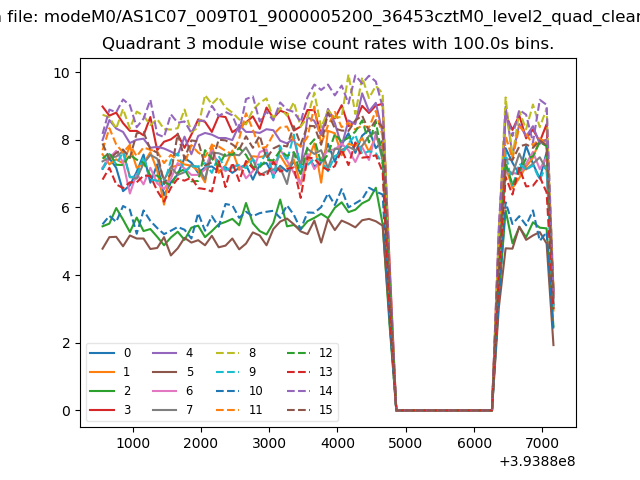
| Module-wise count rates for Quadrant C Data is divided into 100 sec bins |
 |
 |
| Module-wise count rates for Quadrant D Data is divided into 100 sec bins |
 |
 |
| Parameter | Plot |
|---|---|
| CZT HV Monitor | 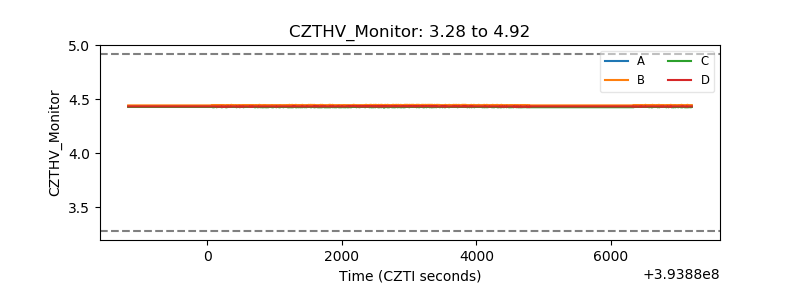 |
| D_VDD | 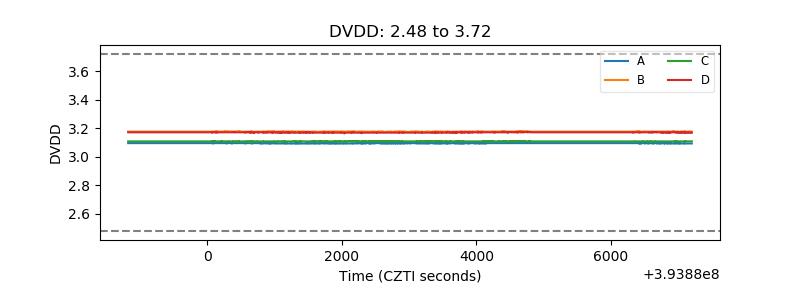 |
| Temperature 1 | 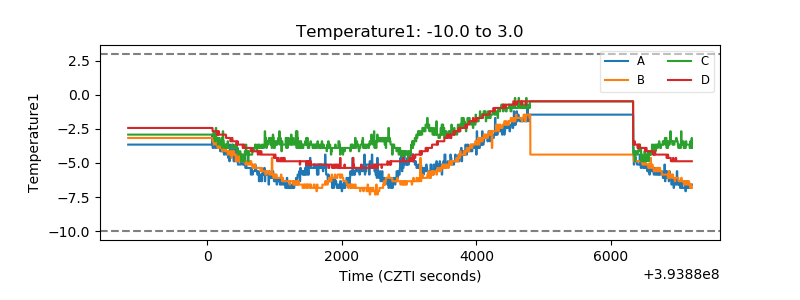 |
| Veto HV Monitor | 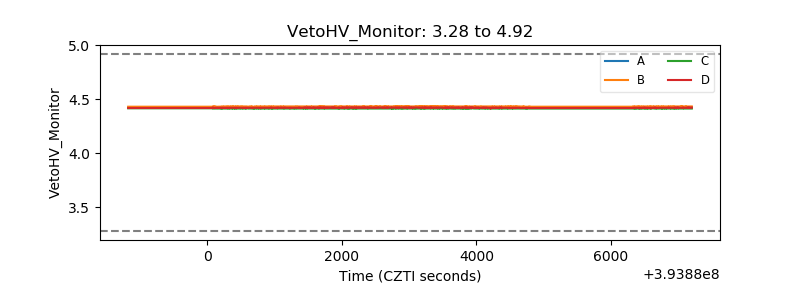 |
| Veto LLD | 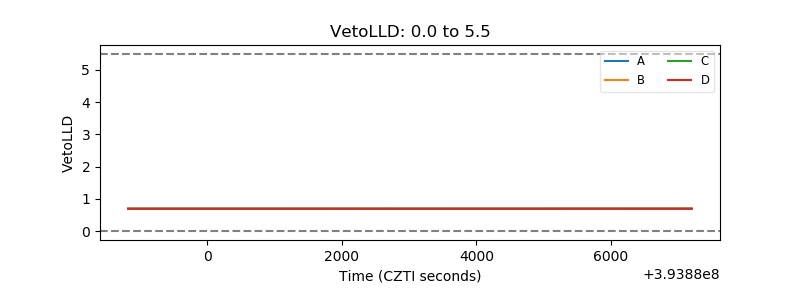 |
| Alpha Counter | 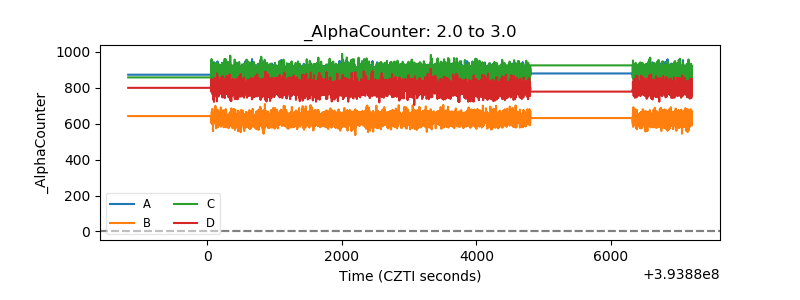 |
| _CPM_Rate | 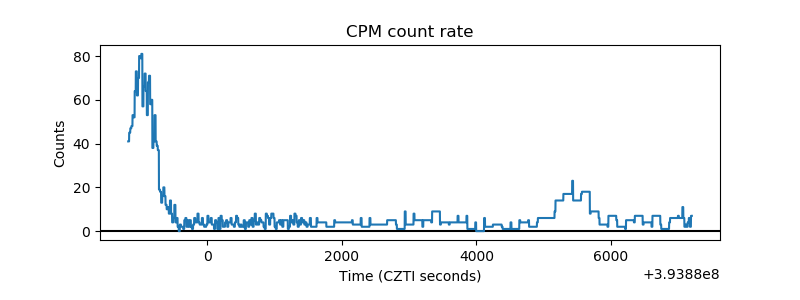 |
| CZT Counter | 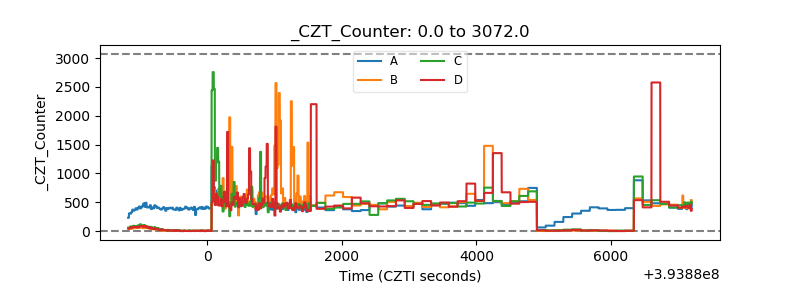 |
| +2.5 Volts monitor | 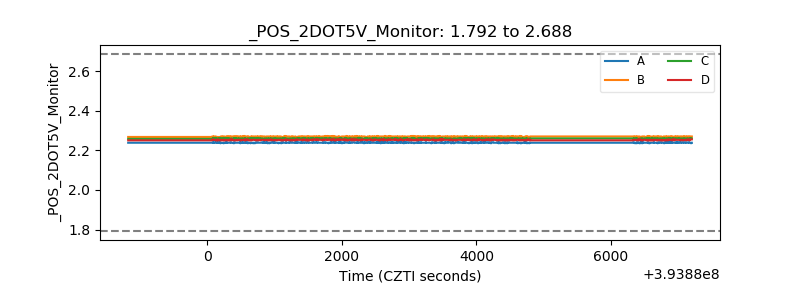 |
| +5 Volts monitor | 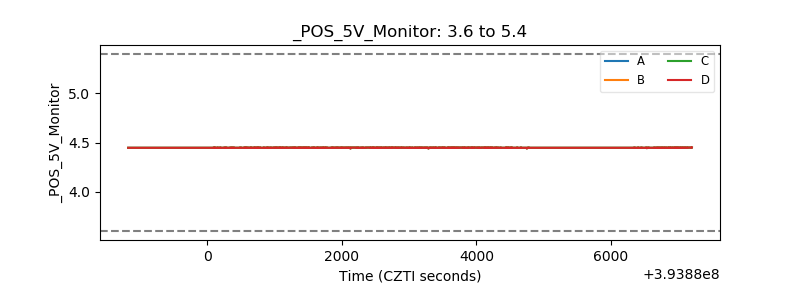 |
| _ROLL_ROT | 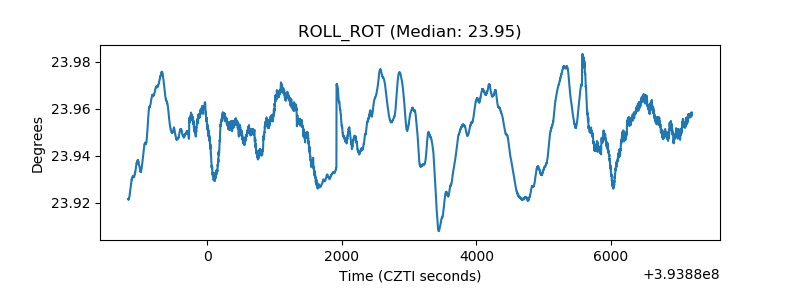 |
| _Roll_DEC | 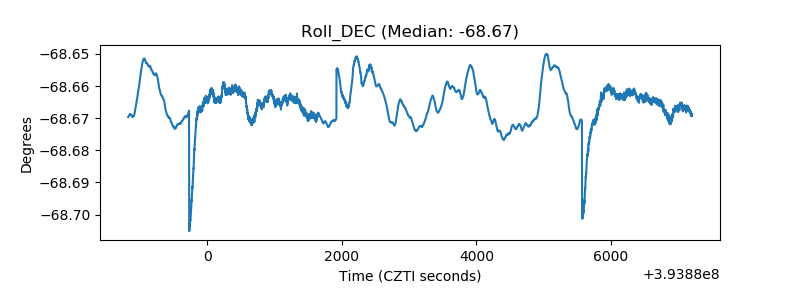 |
| _Roll_RA |  |
| Veto Counter | 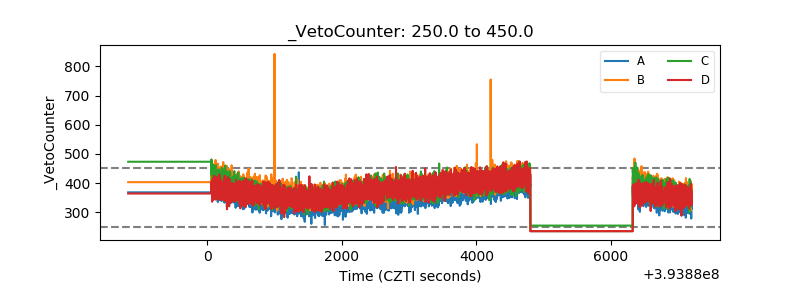 |