| Param | Original file | Final file |
|---|---|---|
| Filename | modeM0/AS1C07_009T01_9000005200_36451cztM0_level2.evt | modeM0/AS1C07_009T01_9000005200_36451cztM0_level2_quad_clean.evt |
| Size (bytes) | 371,183,040 | 60,186,240 |
| Size | 354.0 MB | 57.4 MB |
| Events in quadrant A | 2,527,169 | 380,155 |
| Events in quadrant B | 2,988,419 | 375,863 |
| Events in quadrant C | 2,687,328 | 365,162 |
| Events in quadrant D | 2,701,318 | 353,688 |
| Mode M0 | |||
|---|---|---|---|
| Quadrant | BADHDUFLAG | Total packets | Discarded packets |
| A | 0 | 10629 | 3 |
| B | 0 | 12022 | 2 |
| C | 0 | 10906 | 2 |
| D | 0 | 11292 | 2 |
| Mode SS | |||
|---|---|---|---|
| Quadrant | BADHDUFLAG | Total packets | Discarded packets |
| A | 0 | 102 | 0 |
| B | 0 | 102 | 0 |
| C | 0 | 102 | 0 |
| D | 0 | 102 | 0 |
| Mode M9 | |||
|---|---|---|---|
| Quadrant | BADHDUFLAG | Total packets | Discarded packets |
| A | 0 | 21 | 0 |
| B | 0 | 21 | 0 |
| C | 0 | 21 | 0 |
| D | 0 | 21 | 0 |
| Quadrant | Total seconds | Saturated seconds | Saturation percentage |
|---|---|---|---|
| A | 4949 | 14 | 0.282885% |
| B | 4949 | 130 | 2.626793% |
| C | 4949 | 65 | 1.313397% |
| D | 4950 | 76 | 1.535354% |
Noise dominated data is calculated using 1-second bins in cleaned event files. If a bin has >2000 counts, and if more than 50% of those come from <1% of pixels, then it is considered to be noise-dominated and hence unusable.
| Quadrant | # 1 sec bins | Bins with >0 counts | Bins with >2000 counts | High rate bins dominated by noise | Noise dominated (total time) | Noise dominated (detector-on time) | Marked lightcurve |
|---|---|---|---|---|---|---|---|
| A | 7042 | 4950 | 8 | 8 | 0.11% | 0.16% | 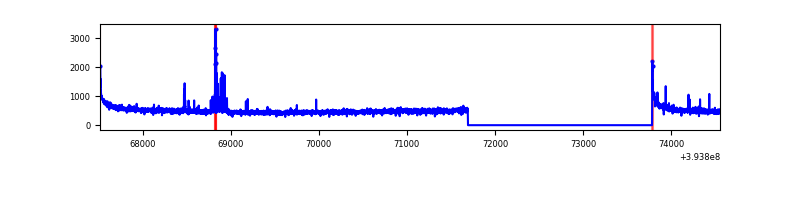 |
| B | 7042 | 4950 | 71 | 71 | 1.01% | 1.43% | 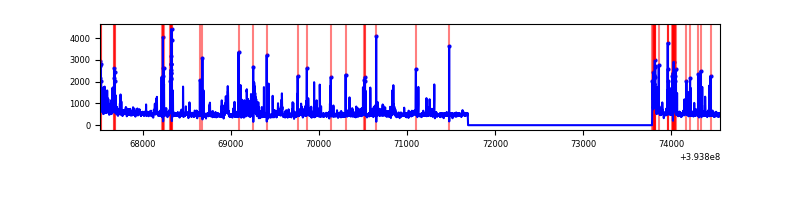 |
| C | 7042 | 4950 | 55 | 55 | 0.78% | 1.11% | 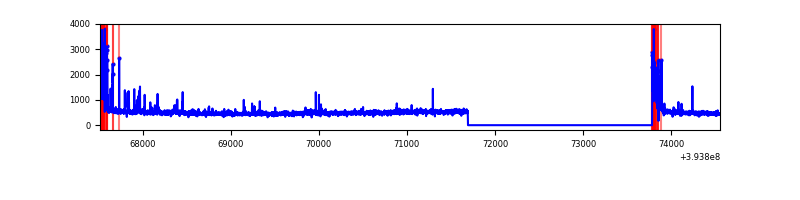 |
| D | 7043 | 4951 | 66 | 66 | 0.94% | 1.33% | 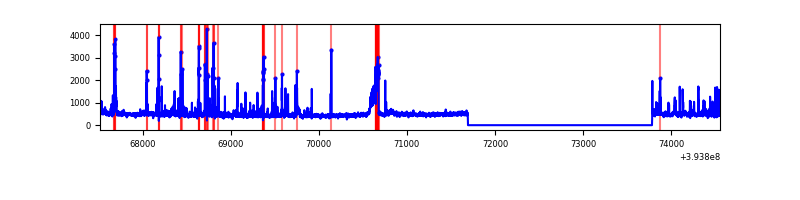 |
Top three noisy pixels from each quadrant. If the there are fewer than three noisy pixels in the level2.evt file, extra rows are filled as -1
| Pixel properties | Quadrant properties | ||||||
|---|---|---|---|---|---|---|---|
| Quadrant | DetID | PixID | Counts | Sigma | Mean | Median | Sigma |
| A | 10 | 83 | 190568 | 1633.82 | 580 | 568 | 116.3 |
| A | 7 | 3 | 67588 | 576.31 | 580 | 568 | 116.3 |
| A | 9 | 143 | 12311 | 100.98 | 580 | 568 | 116.3 |
| B | 5 | 172 | 359240 | 3345.1 | 571 | 556 | 107.2 |
| B | 5 | 255 | 158221 | 1470.39 | 571 | 556 | 107.2 |
| B | 0 | 190 | 45230 | 416.63 | 571 | 556 | 107.2 |
| C | 0 | 10 | 285194 | 2203.79 | 554 | 557 | 129.2 |
| C | 15 | 214 | 226363 | 1748.3 | 554 | 557 | 129.2 |
| C | 15 | 159 | 8566 | 62.01 | 554 | 557 | 129.2 |
| D | 13 | 249 | 212927 | 1604.14 | 555 | 541 | 132.4 |
| D | 13 | 171 | 95259 | 715.4 | 555 | 541 | 132.4 |
| D | 2 | 249 | 52852 | 395.1 | 555 | 541 | 132.4 |
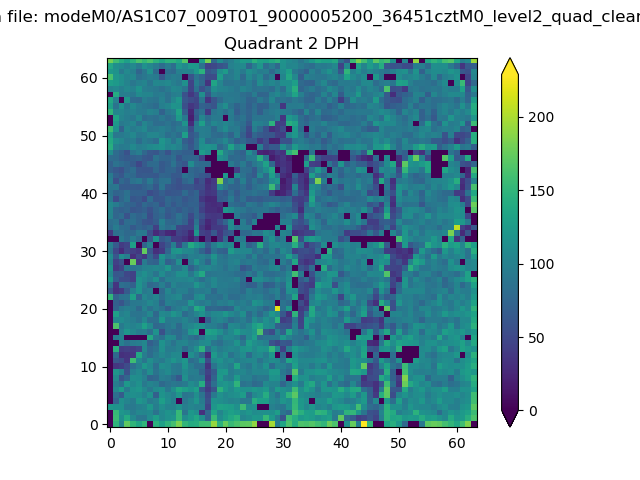
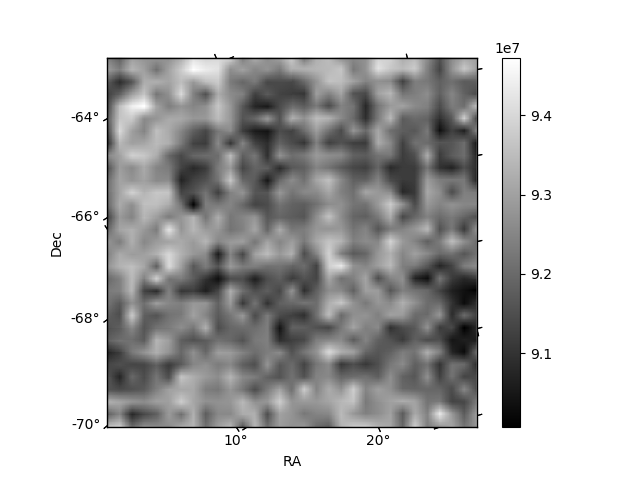
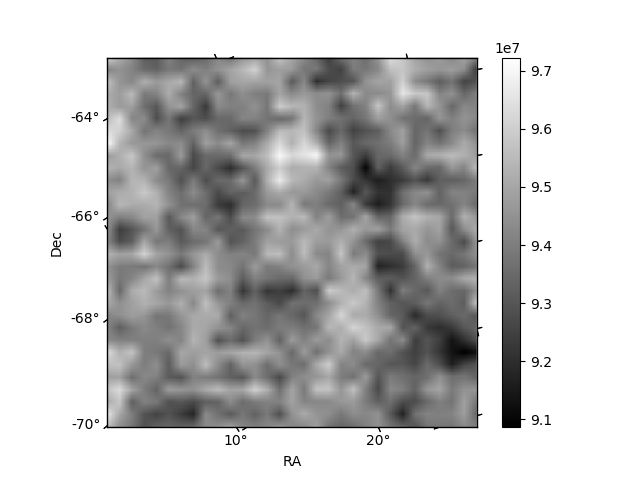
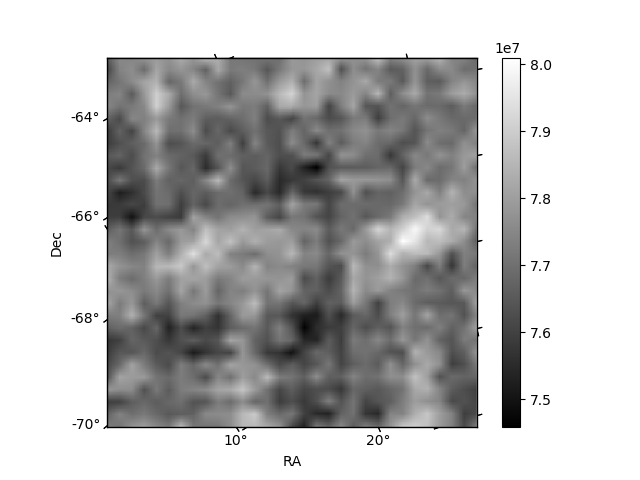
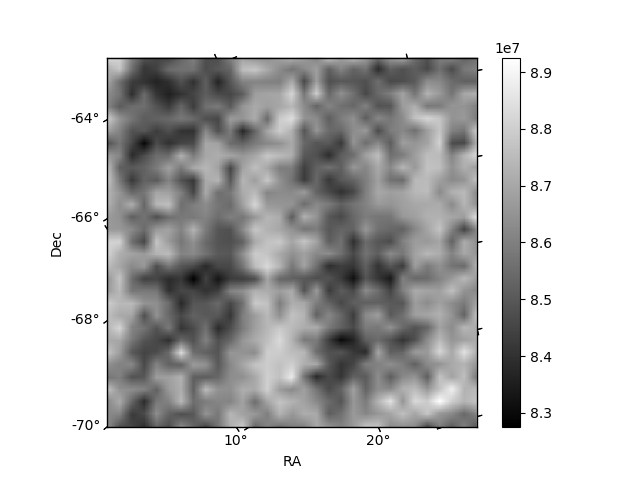
Histogram calculated using DETX and DETY for each event in the final _common_clean file
| Quadrant A | 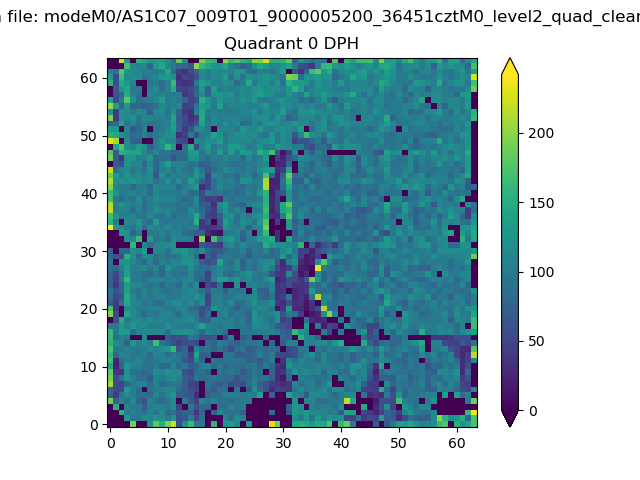 |
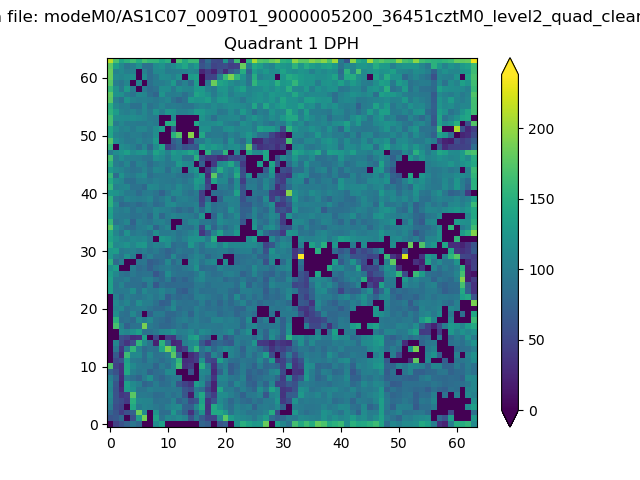 |
Quadrant B |
|---|---|---|---|
| Quadrant D | 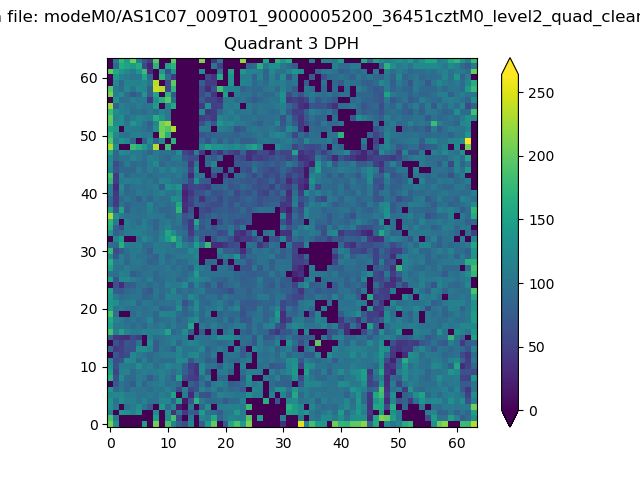 |
 |
Quadrant C |
| Plot type | Count rate plots | Images |
|---|---|---|
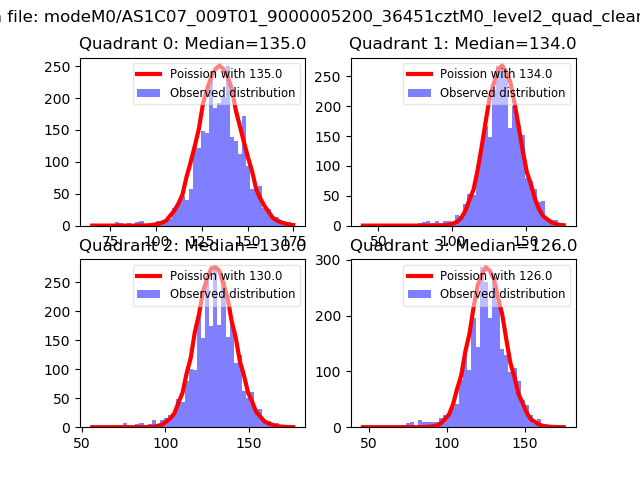
| Comparison with Poisson distribution Blue bars denote a histogram of data divided into 1 sec bins. Red curve is a Poisson curve with rate = median count rate of data. |
 |
 |
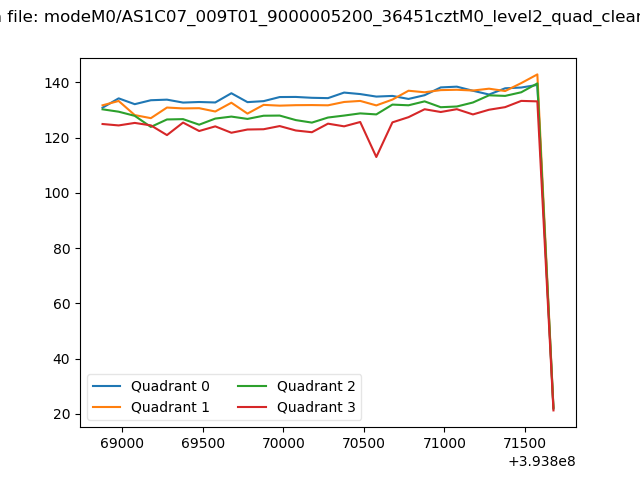
| Quadrant-wise count rates Data is divided into 100 sec bins |
 |
|
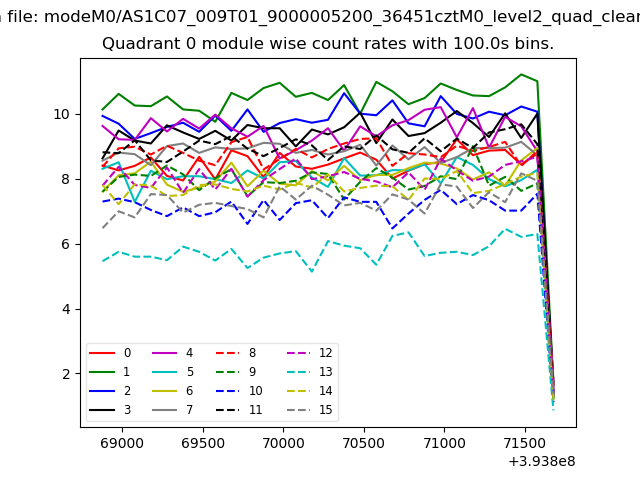
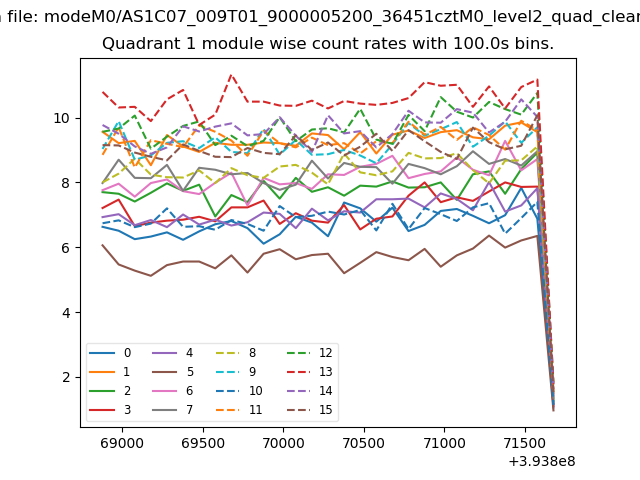
| Module-wise count rates for Quadrant A Data is divided into 100 sec bins |
 |
 |
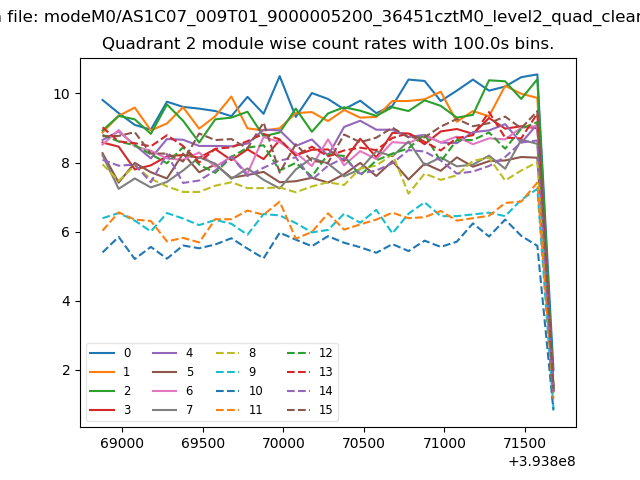
| Module-wise count rates for Quadrant B Data is divided into 100 sec bins |
 |
 |
| Module-wise count rates for Quadrant C Data is divided into 100 sec bins |
 |
 |
| Module-wise count rates for Quadrant D Data is divided into 100 sec bins |
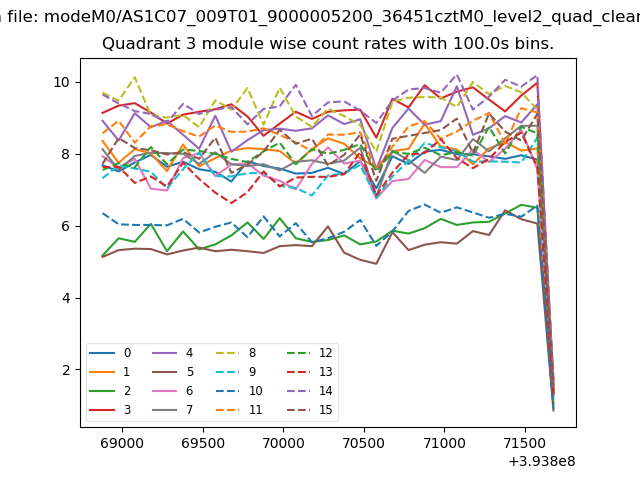 |
 |
| Parameter | Plot |
|---|---|
| CZT HV Monitor | 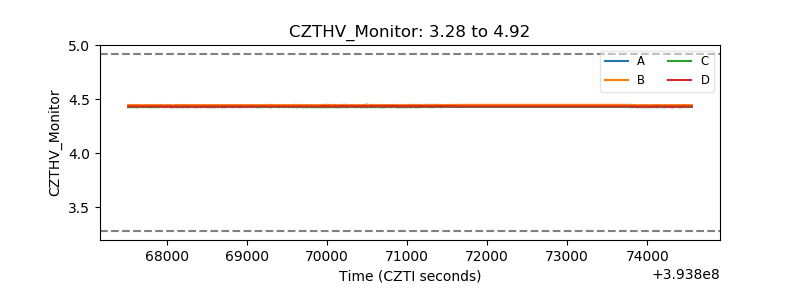 |
| D_VDD | 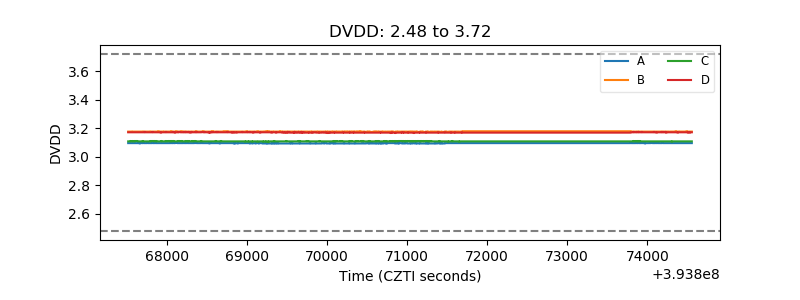 |
| Temperature 1 | 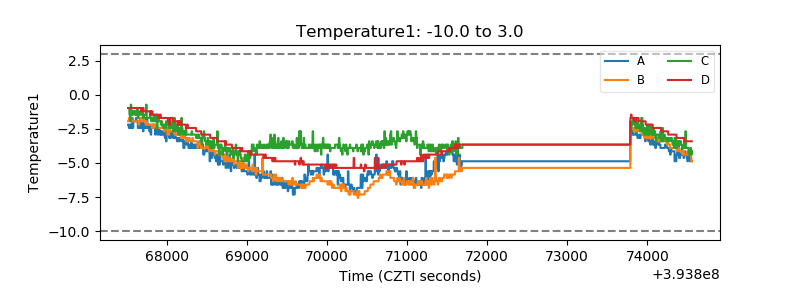 |
| Veto HV Monitor | 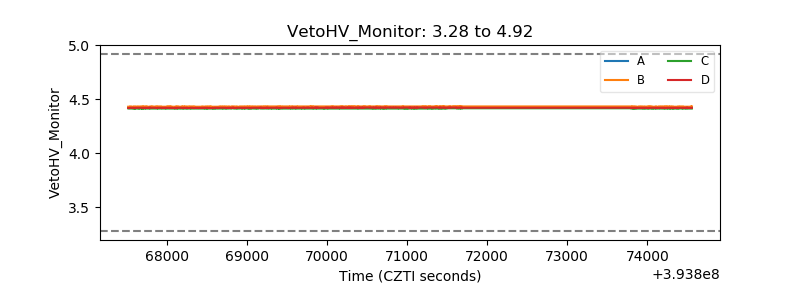 |
| Veto LLD | 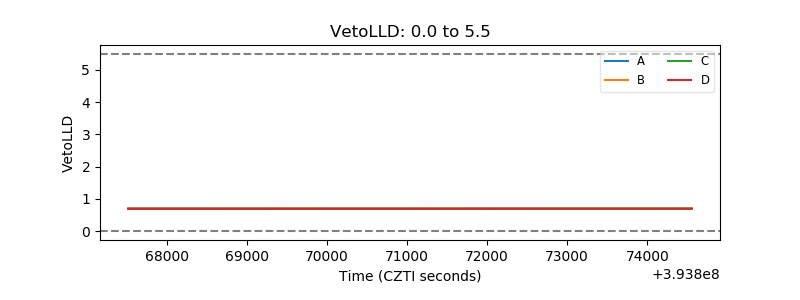 |
| Alpha Counter | 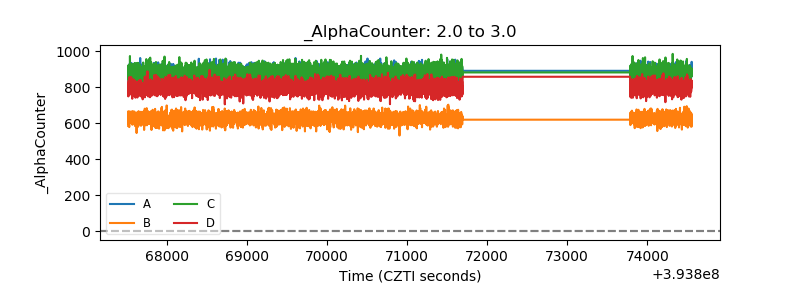 |
| _CPM_Rate | 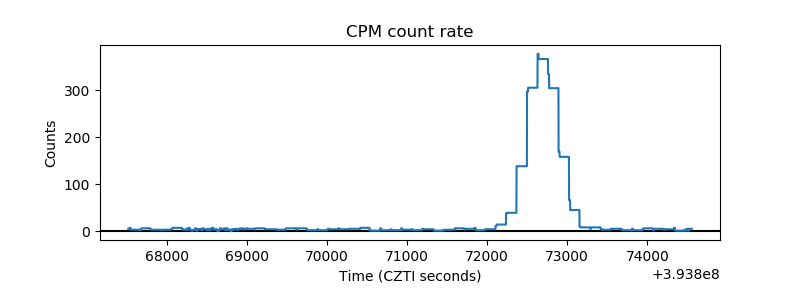 |
| CZT Counter | 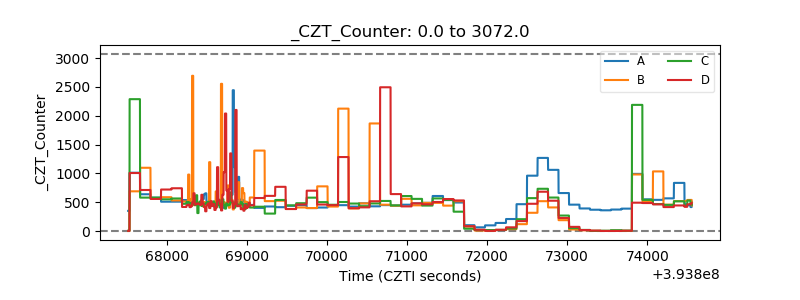 |
| +2.5 Volts monitor |  |
| +5 Volts monitor | 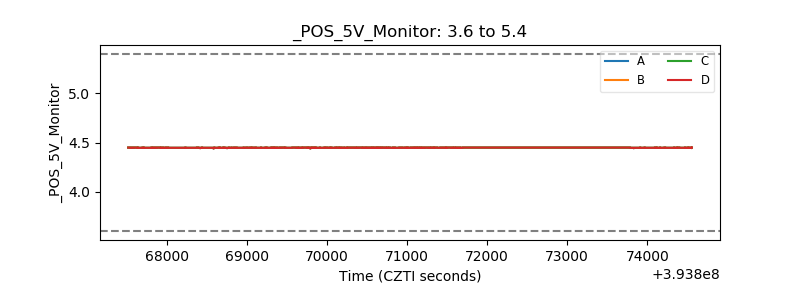 |
| _ROLL_ROT | 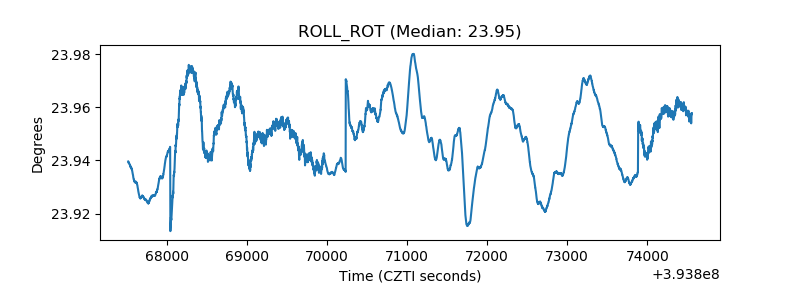 |
| _Roll_DEC | 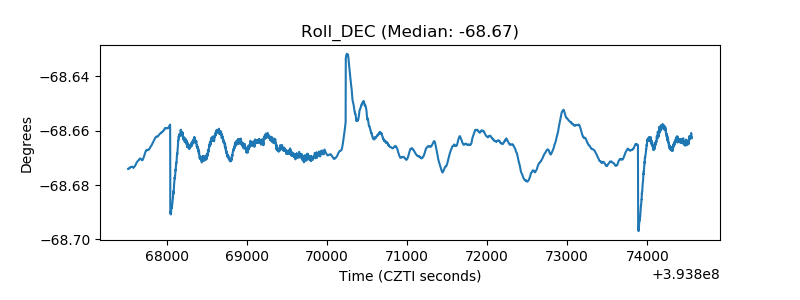 |
| _Roll_RA | 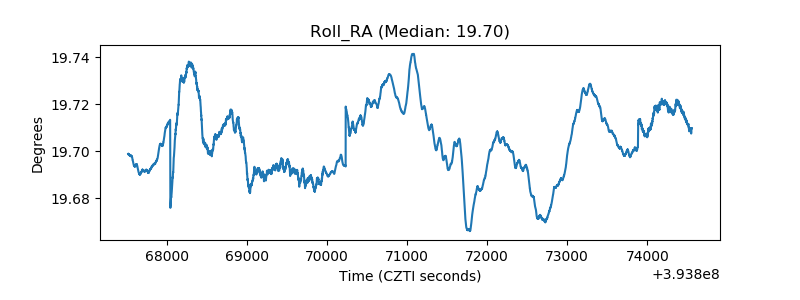 |
| Veto Counter | 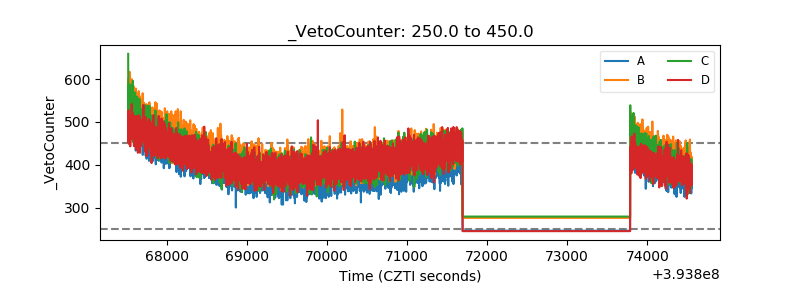 |