| Param | Original file | Final file |
|---|---|---|
| Filename | modeM0/AS1C07_009T01_9000005200_36422cztM0_level2.evt | modeM0/AS1C07_009T01_9000005200_36422cztM0_level2_quad_clean.evt |
| Size (bytes) | 171,391,680 | 27,334,080 |
| Size | 163.5 MB | 26.1 MB |
| Events in quadrant A | 1,029,359 | 173,778 |
| Events in quadrant B | 1,667,584 | 171,938 |
| Events in quadrant C | 1,203,238 | 170,615 |
| Events in quadrant D | 1,151,240 | 164,430 |
| Mode M0 | |||
|---|---|---|---|
| Quadrant | BADHDUFLAG | Total packets | Discarded packets |
| A | 0 | 4240 | 2 |
| B | 0 | 6207 | 1 |
| C | 0 | 4684 | 1 |
| D | 0 | 4734 | 1 |
| Mode SS | |||
|---|---|---|---|
| Quadrant | BADHDUFLAG | Total packets | Discarded packets |
| A | 0 | 42 | 0 |
| B | 0 | 42 | 0 |
| C | 0 | 42 | 0 |
| D | 0 | 42 | 0 |
| Mode M9 | |||
|---|---|---|---|
| Quadrant | BADHDUFLAG | Total packets | Discarded packets |
| A | 0 | 21 | 0 |
| B | 0 | 21 | 0 |
| C | 0 | 21 | 0 |
| D | 0 | 21 | 0 |
| Quadrant | Total seconds | Saturated seconds | Saturation percentage |
|---|---|---|---|
| A | 2015 | 4 | 0.198511% |
| B | 2015 | 208 | 10.322581% |
| C | 2015 | 74 | 3.672457% |
| D | 2015 | 27 | 1.339950% |
Noise dominated data is calculated using 1-second bins in cleaned event files. If a bin has >2000 counts, and if more than 50% of those come from <1% of pixels, then it is considered to be noise-dominated and hence unusable.
| Quadrant | # 1 sec bins | Bins with >0 counts | Bins with >2000 counts | High rate bins dominated by noise | Noise dominated (total time) | Noise dominated (detector-on time) | Marked lightcurve |
|---|---|---|---|---|---|---|---|
| A | 4108 | 2016 | 0 | 0 | 0.00% | 0.00% | 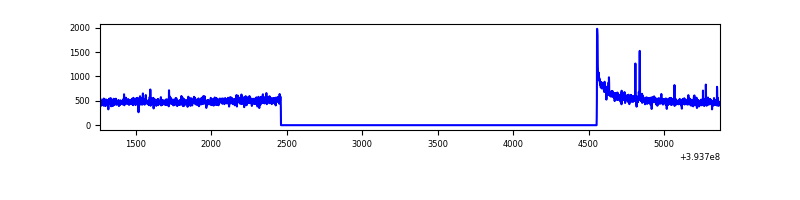 |
| B | 4108 | 2016 | 130 | 130 | 3.16% | 6.45% | 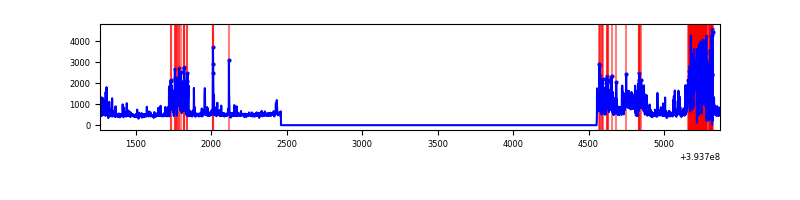 |
| C | 4108 | 2016 | 58 | 58 | 1.41% | 2.88% | 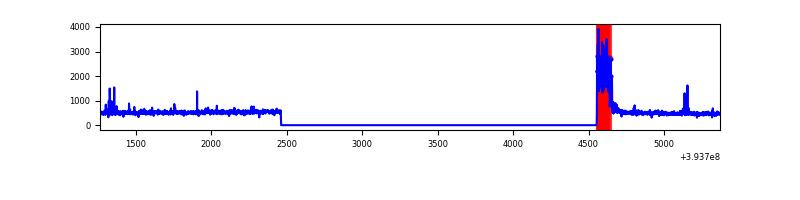 |
| D | 4108 | 2016 | 24 | 24 | 0.58% | 1.19% | 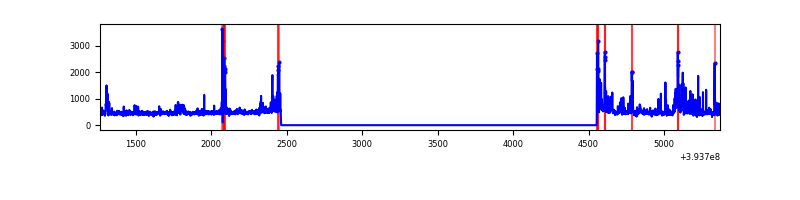 |
Top three noisy pixels from each quadrant. If the there are fewer than three noisy pixels in the level2.evt file, extra rows are filled as -1
| Pixel properties | Quadrant properties | ||||||
|---|---|---|---|---|---|---|---|
| Quadrant | DetID | PixID | Counts | Sigma | Mean | Median | Sigma |
| A | 10 | 83 | 83630 | 1675.18 | 241 | 235 | 49.8 |
| A | 9 | 143 | 6829 | 132.46 | 241 | 235 | 49.8 |
| A | 13 | 254 | 3376 | 63.09 | 241 | 235 | 49.8 |
| B | 5 | 172 | 595168 | 13207.19 | 228 | 222 | 45.0 |
| B | 5 | 255 | 96913 | 2146.44 | 228 | 222 | 45.0 |
| B | 4 | 232 | 29045 | 639.84 | 228 | 222 | 45.0 |
| C | 0 | 10 | 188150 | 3434.82 | 232 | 233 | 54.7 |
| C | 15 | 214 | 87697 | 1598.7 | 232 | 233 | 54.7 |
| C | 0 | 207 | 15020 | 270.27 | 232 | 233 | 54.7 |
| D | 2 | 250 | 103984 | 1816.25 | 235 | 229 | 57.1 |
| D | 2 | 137 | 42073 | 732.49 | 235 | 229 | 57.1 |
| D | 12 | 16 | 24480 | 424.52 | 235 | 229 | 57.1 |
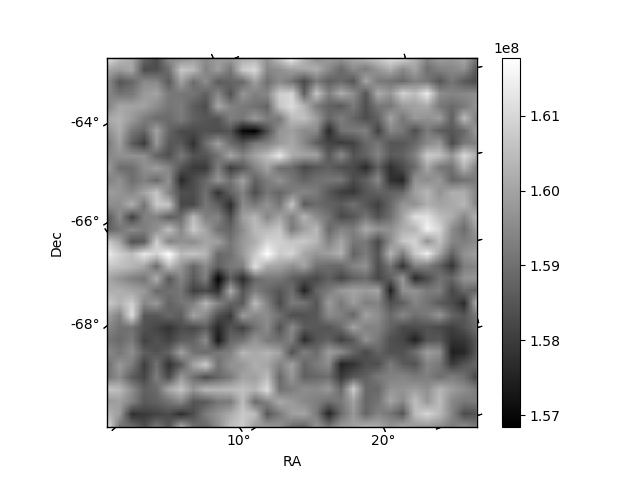
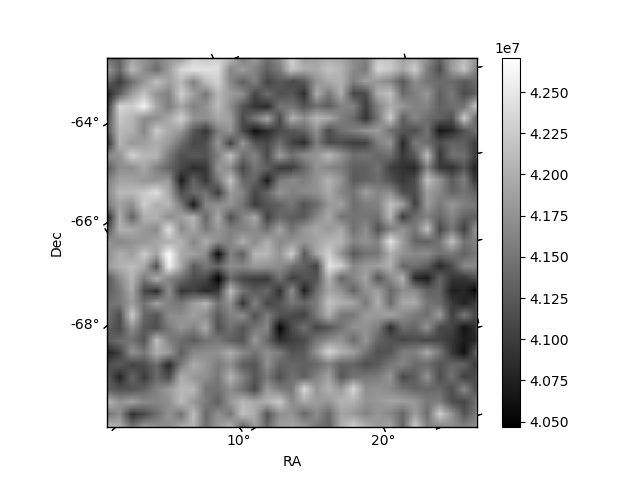
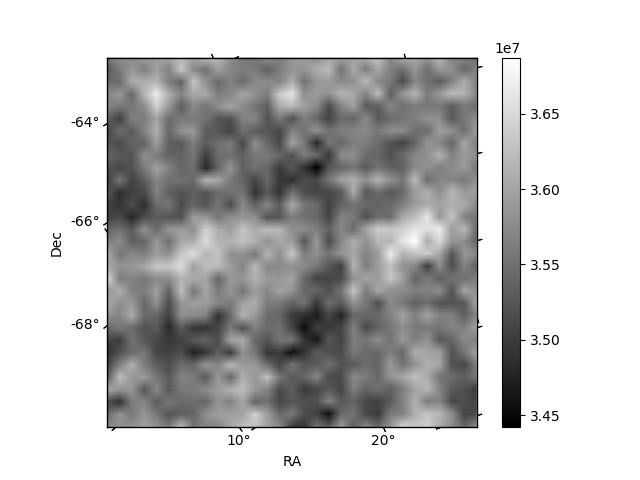
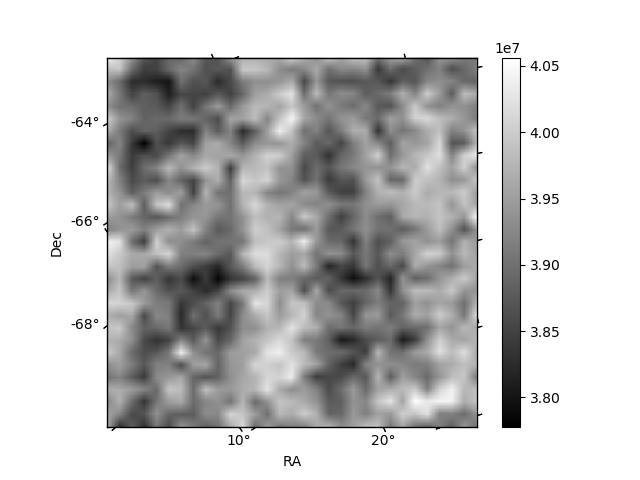
Histogram calculated using DETX and DETY for each event in the final _common_clean file
| Quadrant A | 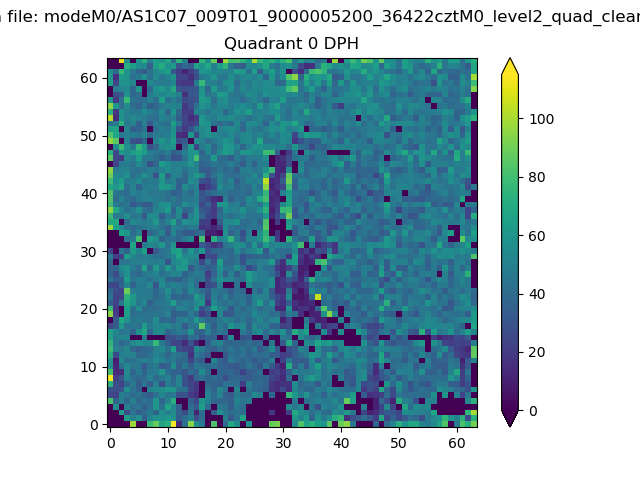 |
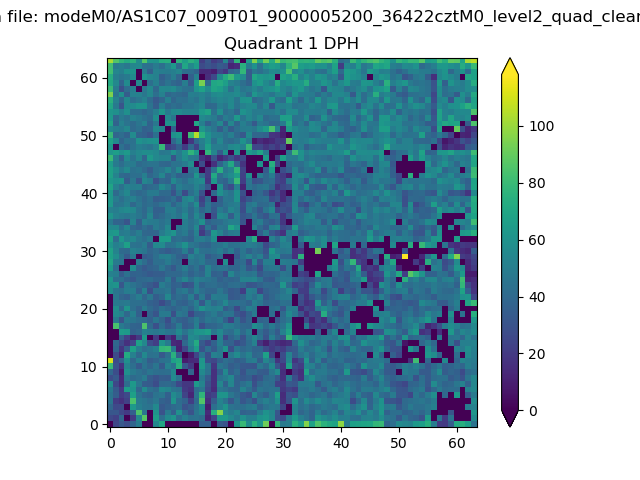 |
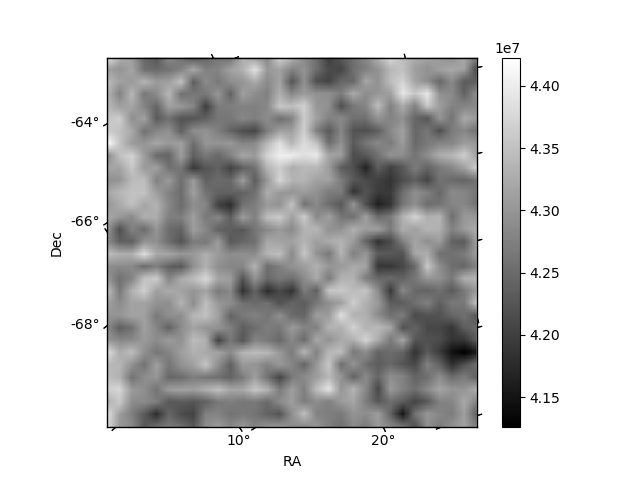
Quadrant B |
|---|---|---|---|
| Quadrant D | 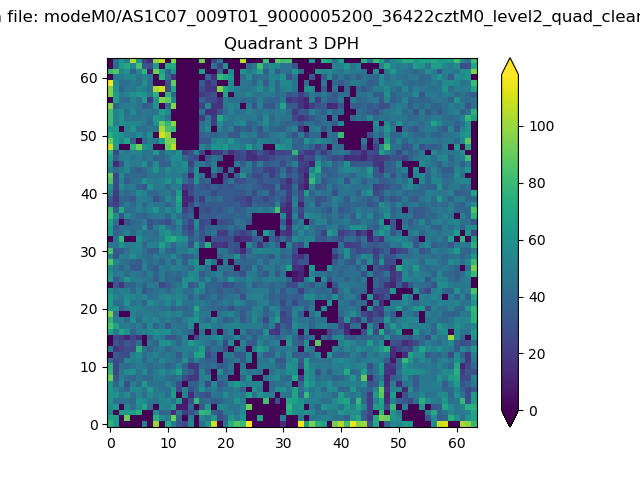 |
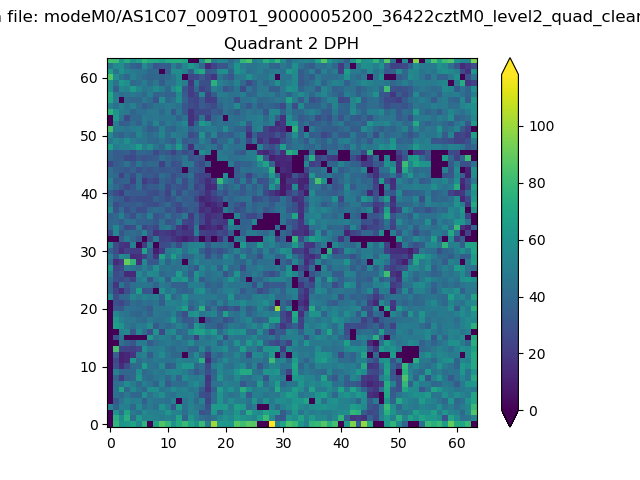 |
Quadrant C |
| Plot type | Count rate plots | Images |
|---|---|---|
| Comparison with Poisson distribution Blue bars denote a histogram of data divided into 1 sec bins. Red curve is a Poisson curve with rate = median count rate of data. |
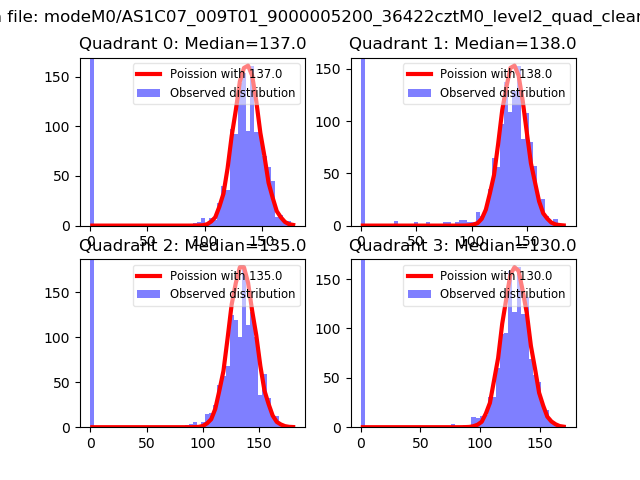 |
 |
| Quadrant-wise count rates Data is divided into 100 sec bins |
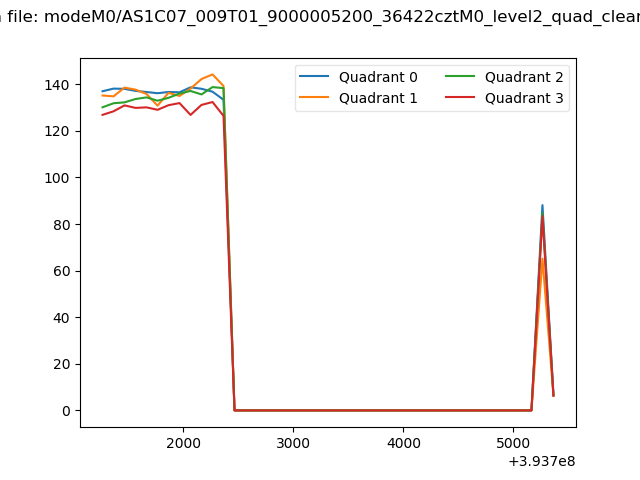 |
|
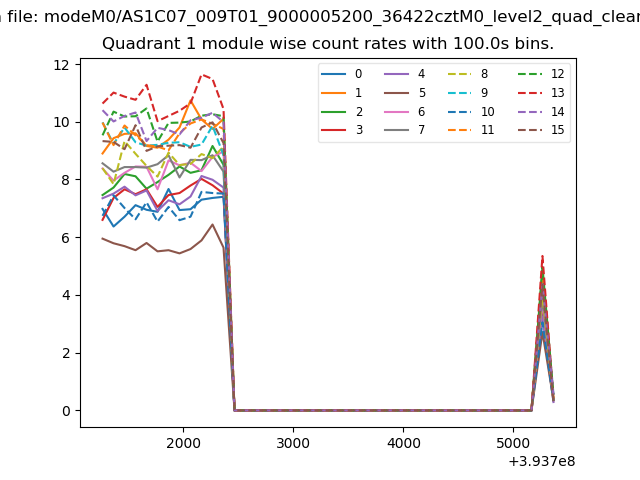
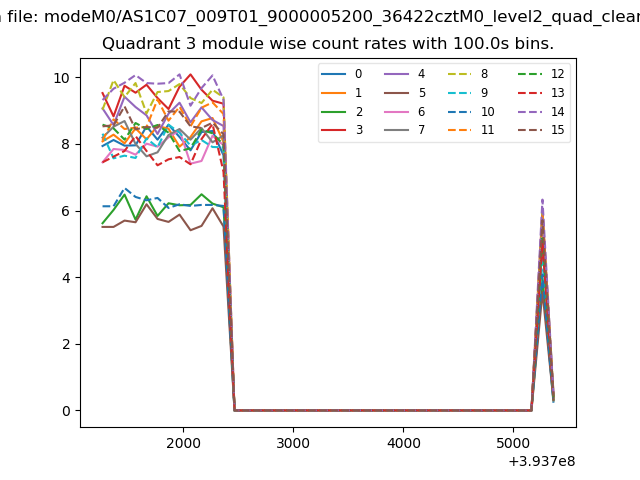
| Module-wise count rates for Quadrant A Data is divided into 100 sec bins |
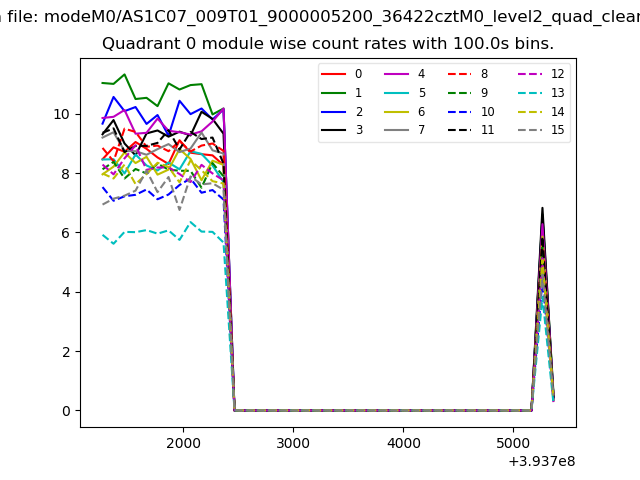 |
 |
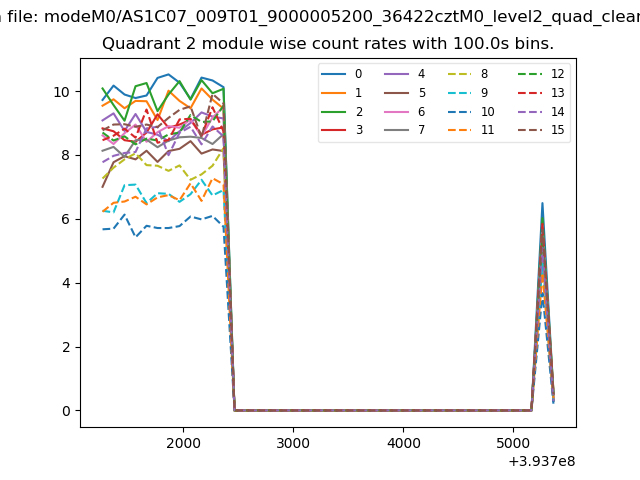
| Module-wise count rates for Quadrant B Data is divided into 100 sec bins |
 |
 |
| Module-wise count rates for Quadrant C Data is divided into 100 sec bins |
 |
 |
| Module-wise count rates for Quadrant D Data is divided into 100 sec bins |
 |
 |
| Parameter | Plot |
|---|---|
| CZT HV Monitor | 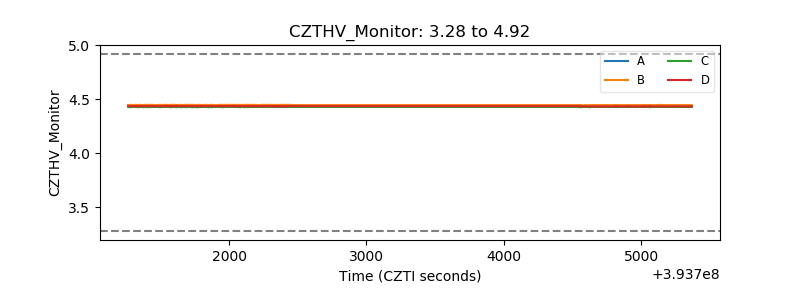 |
| D_VDD | 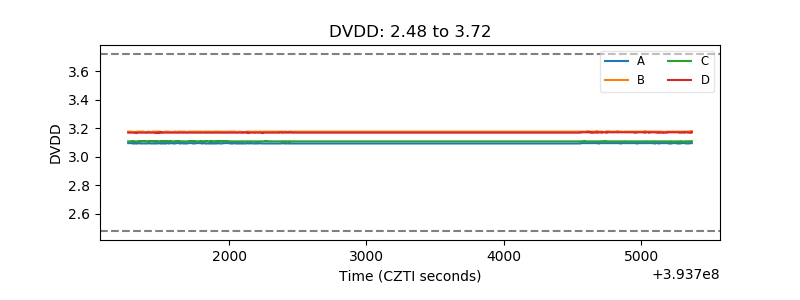 |
| Temperature 1 | 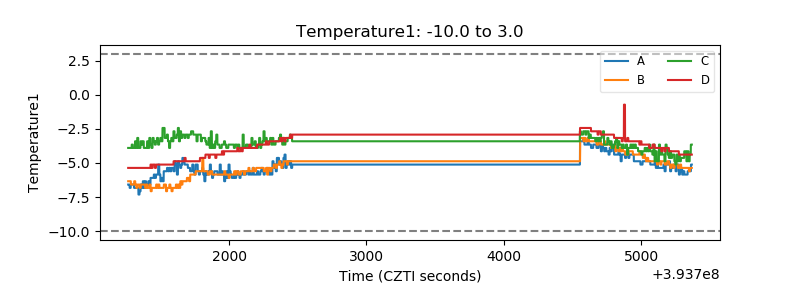 |
| Veto HV Monitor | 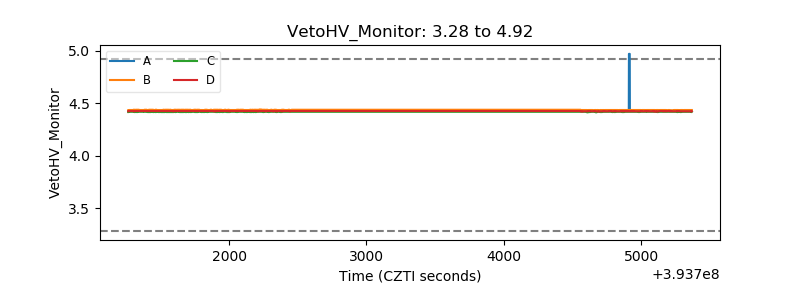 |
| Veto LLD | 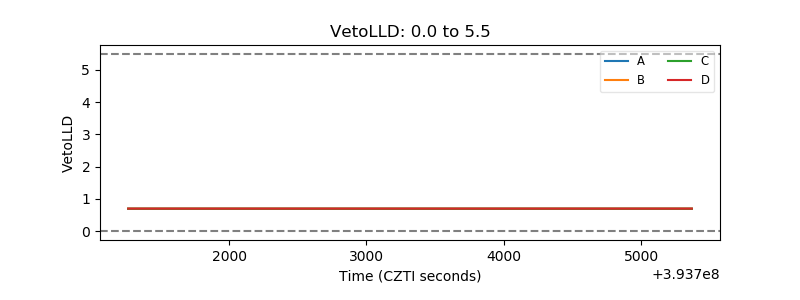 |
| Alpha Counter | 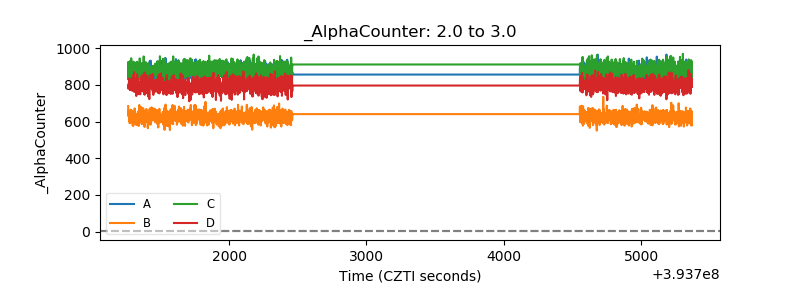 |
| _CPM_Rate | 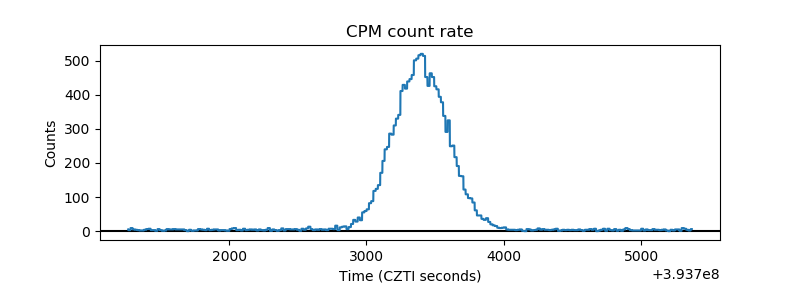 |
| CZT Counter | 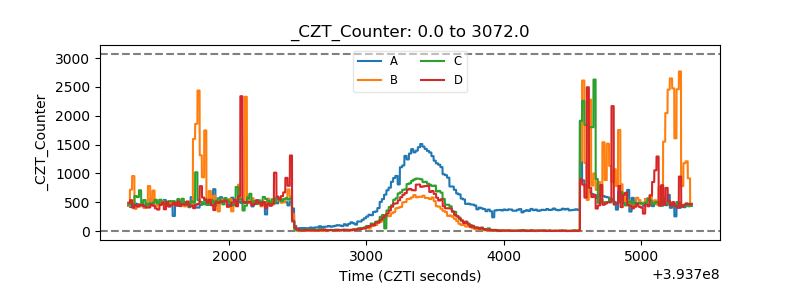 |
| +2.5 Volts monitor | 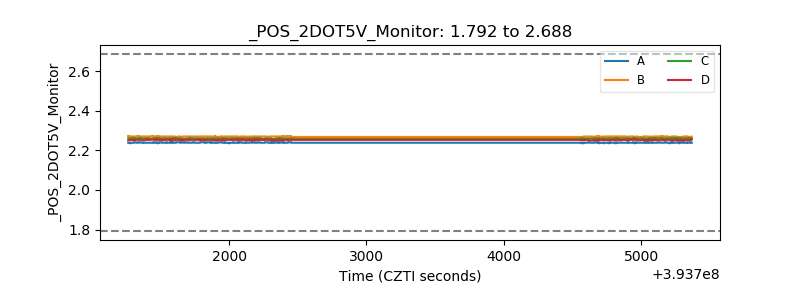 |
| +5 Volts monitor | 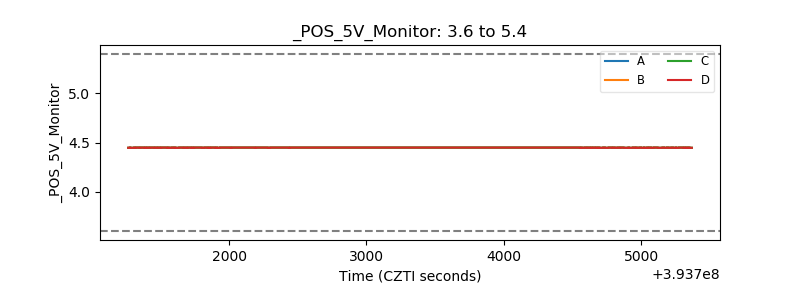 |
| _ROLL_ROT | 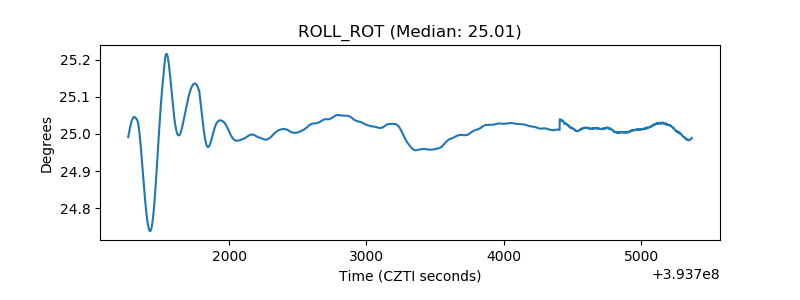 |
| _Roll_DEC | 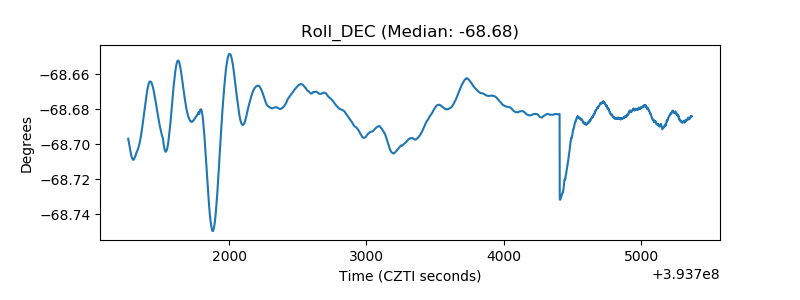 |
| _Roll_RA | 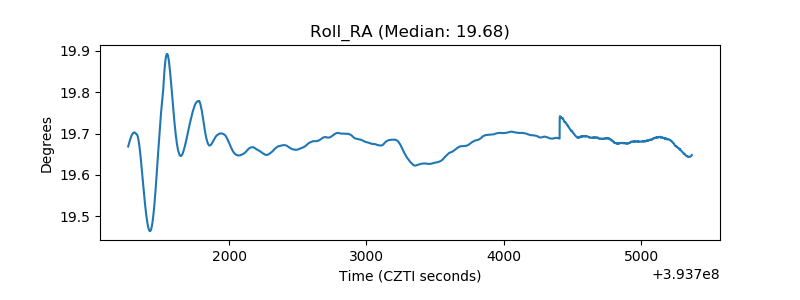 |
| Veto Counter | 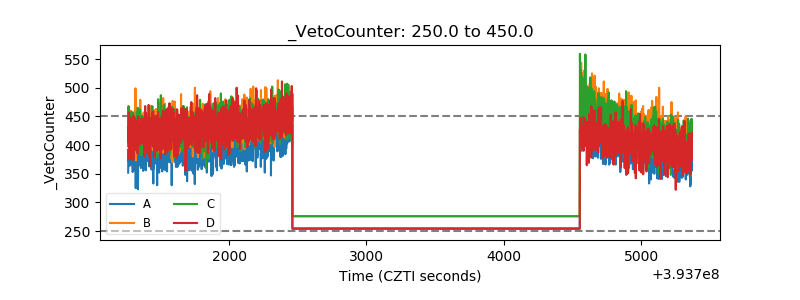 |