| Param | Original file | Final file |
|---|---|---|
| Filename | modeM0/AS1T04_084T01_9000005198_36420cztM0_level2.evt | modeM0/AS1T04_084T01_9000005198_36420cztM0_level2_quad_clean.evt |
| Size (bytes) | 449,464,320 | 47,229,120 |
| Size | 428.6 MB | 45.0 MB |
| Events in quadrant A | 2,851,928 | 278,267 |
| Events in quadrant B | 4,349,407 | 270,776 |
| Events in quadrant C | 2,987,751 | 266,442 |
| Events in quadrant D | 3,078,622 | 258,273 |
| Mode M0 | |||
|---|---|---|---|
| Quadrant | BADHDUFLAG | Total packets | Discarded packets |
| A | 0 | 11493 | 3 |
| B | 0 | 16303 | 2 |
| C | 0 | 11639 | 2 |
| D | 0 | 12327 | 2 |
| Mode SS | |||
|---|---|---|---|
| Quadrant | BADHDUFLAG | Total packets | Discarded packets |
| A | 0 | 104 | 0 |
| B | 0 | 104 | 0 |
| C | 0 | 104 | 0 |
| D | 0 | 104 | 0 |
| Mode M9 | |||
|---|---|---|---|
| Quadrant | BADHDUFLAG | Total packets | Discarded packets |
| A | 0 | 30 | 0 |
| B | 0 | 30 | 0 |
| C | 0 | 30 | 0 |
| D | 0 | 31 | 0 |
| Quadrant | Total seconds | Saturated seconds | Saturation percentage |
|---|---|---|---|
| A | 5075 | 10 | 0.197044% |
| B | 5075 | 441 | 8.689655% |
| C | 5075 | 83 | 1.635468% |
| D | 5075 | 80 | 1.576355% |
Noise dominated data is calculated using 1-second bins in cleaned event files. If a bin has >2000 counts, and if more than 50% of those come from <1% of pixels, then it is considered to be noise-dominated and hence unusable.
| Quadrant | # 1 sec bins | Bins with >0 counts | Bins with >2000 counts | High rate bins dominated by noise | Noise dominated (total time) | Noise dominated (detector-on time) | Marked lightcurve |
|---|---|---|---|---|---|---|---|
| A | 7169 | 5076 | 1 | 1 | 0.01% | 0.02% | 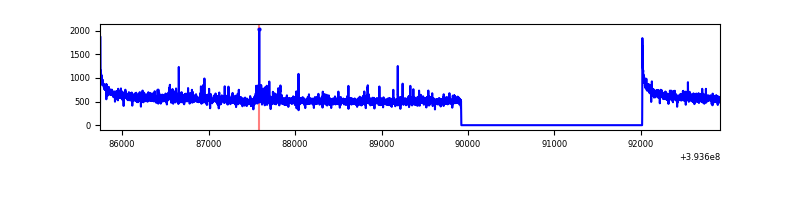 |
| B | 7169 | 5076 | 277 | 277 | 3.86% | 5.46% | 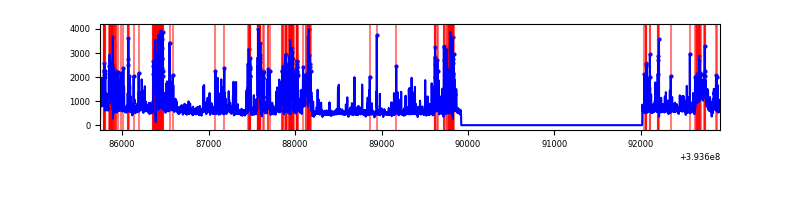 |
| C | 7169 | 5076 | 66 | 66 | 0.92% | 1.30% | 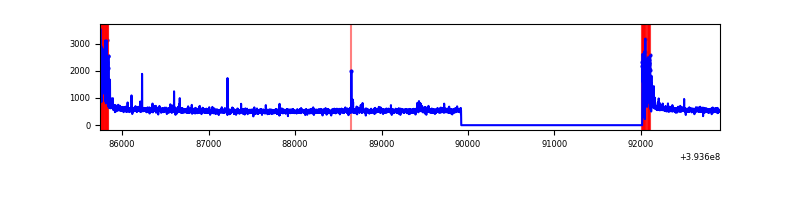 |
| D | 7169 | 5076 | 60 | 60 | 0.84% | 1.18% | 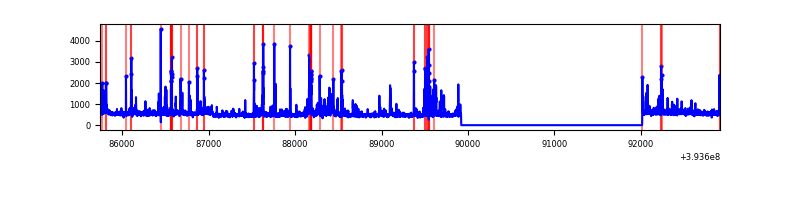 |
Top three noisy pixels from each quadrant. If the there are fewer than three noisy pixels in the level2.evt file, extra rows are filled as -1
| Pixel properties | Quadrant properties | ||||||
|---|---|---|---|---|---|---|---|
| Quadrant | DetID | PixID | Counts | Sigma | Mean | Median | Sigma |
| A | 10 | 83 | 185065 | 1389.16 | 664 | 654 | 132.8 |
| A | 15 | 223 | 96288 | 720.41 | 664 | 654 | 132.8 |
| A | 13 | 254 | 9003 | 62.89 | 664 | 654 | 132.8 |
| B | 5 | 172 | 1211197 | 10066.66 | 636 | 621 | 120.3 |
| B | 0 | 190 | 160369 | 1328.4 | 636 | 621 | 120.3 |
| B | 0 | 189 | 145685 | 1206.29 | 636 | 621 | 120.3 |
| C | 0 | 10 | 287043 | 1969.35 | 629 | 633 | 145.4 |
| C | 15 | 214 | 218485 | 1497.94 | 629 | 633 | 145.4 |
| C | 12 | 249 | 18546 | 123.17 | 629 | 633 | 145.4 |
| D | 2 | 250 | 139959 | 906.93 | 638 | 622 | 153.6 |
| D | 12 | 6 | 124988 | 809.48 | 638 | 622 | 153.6 |
| D | 10 | 199 | 97488 | 630.49 | 638 | 622 | 153.6 |
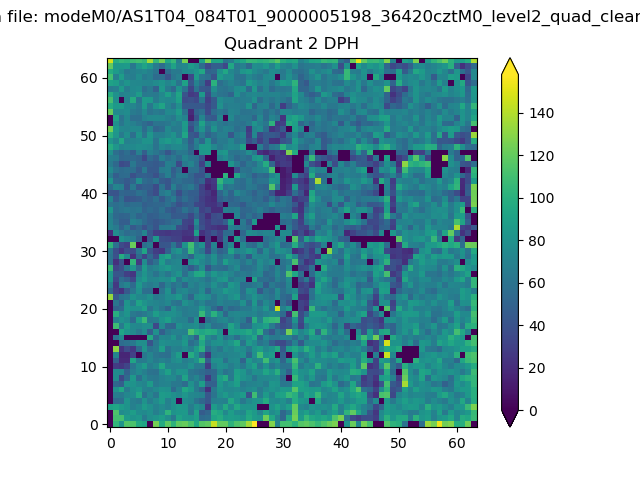
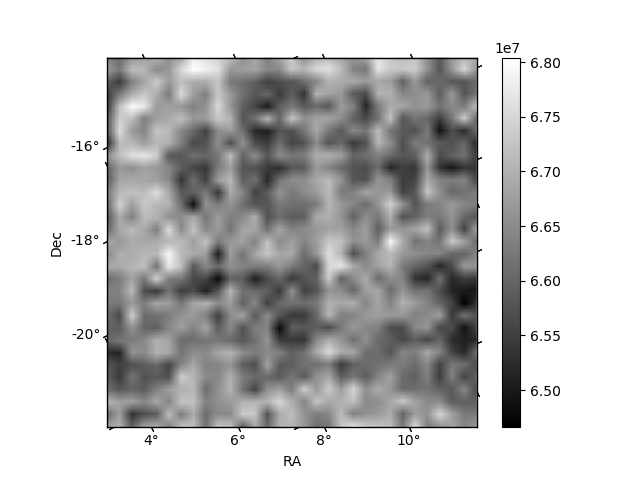
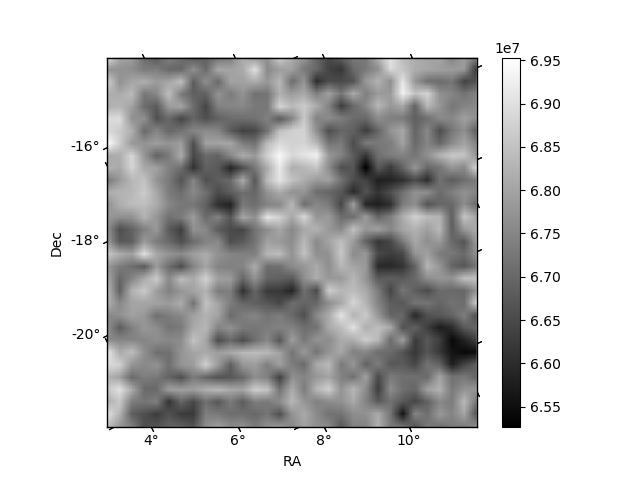
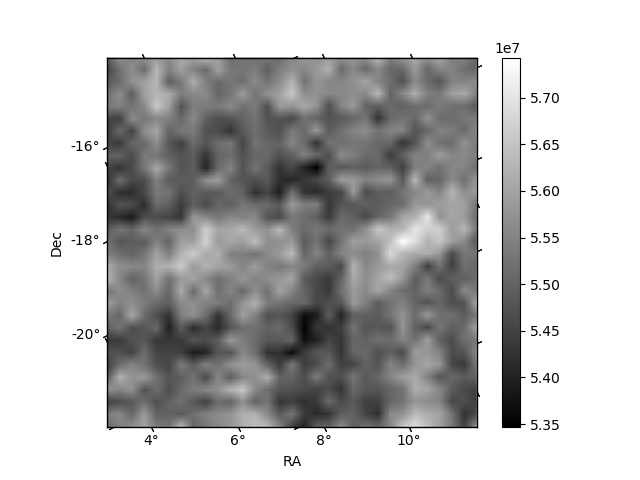
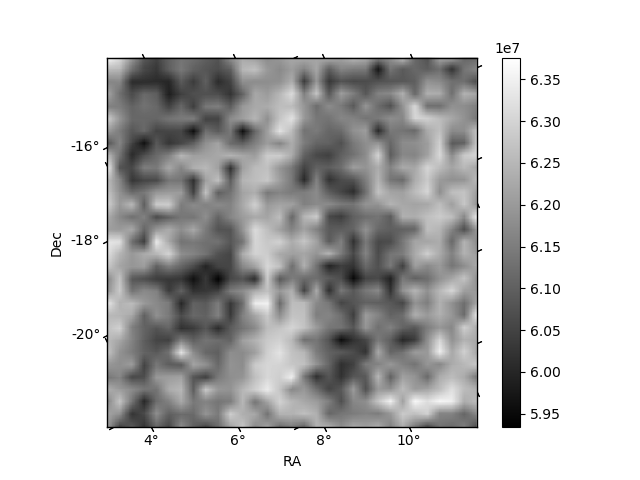
Histogram calculated using DETX and DETY for each event in the final _common_clean file
| Quadrant A | 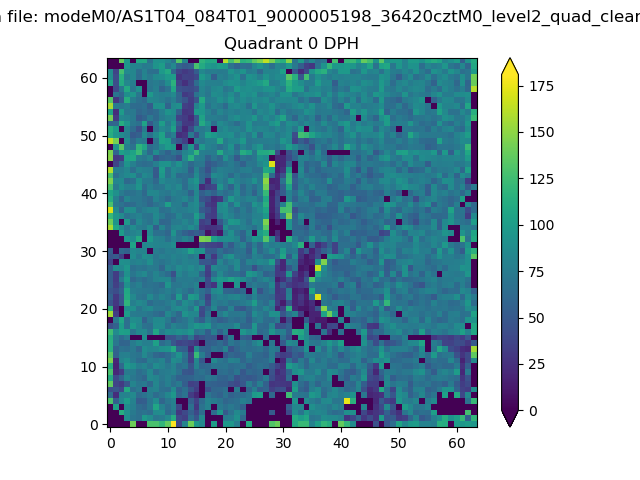 |
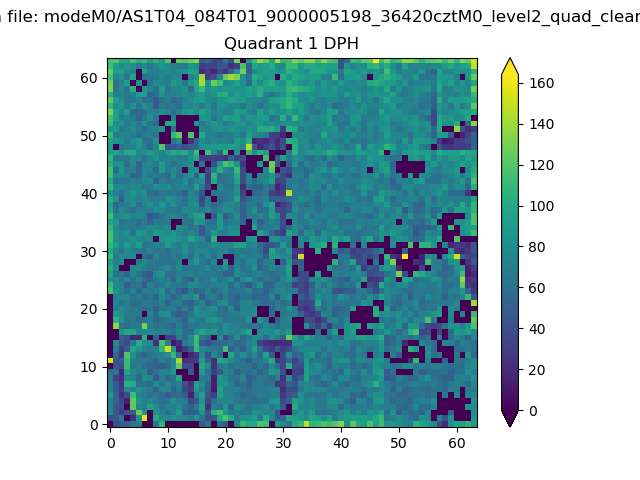 |
Quadrant B |
|---|---|---|---|
| Quadrant D | 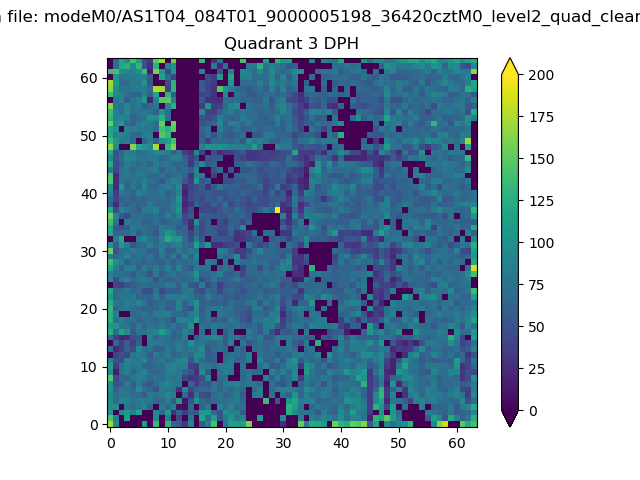 |
 |
Quadrant C |
| Plot type | Count rate plots | Images |
|---|---|---|
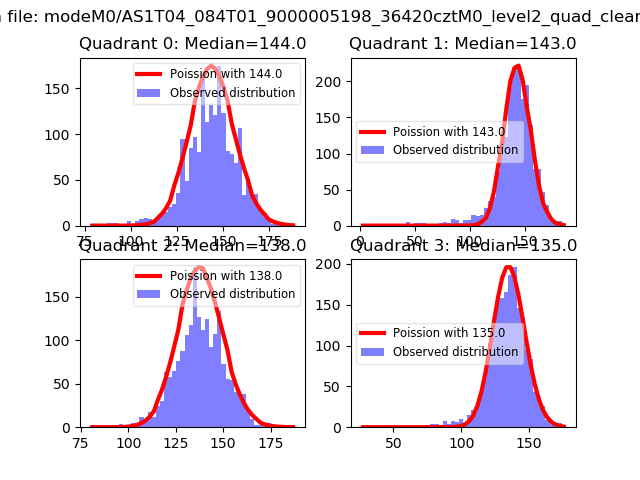
| Comparison with Poisson distribution Blue bars denote a histogram of data divided into 1 sec bins. Red curve is a Poisson curve with rate = median count rate of data. |
 |
 |
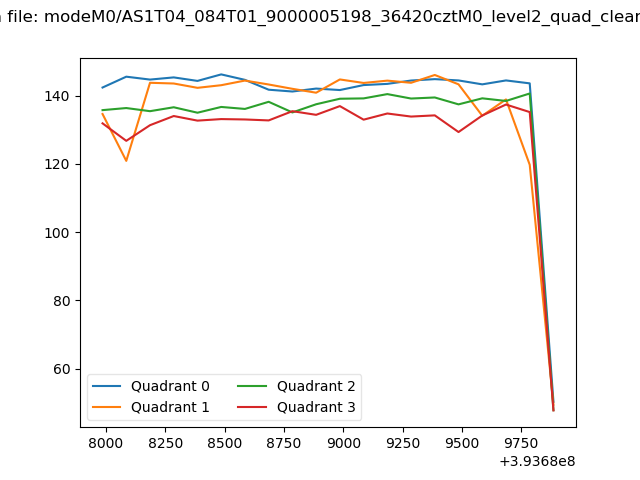
| Quadrant-wise count rates Data is divided into 100 sec bins |
 |
|
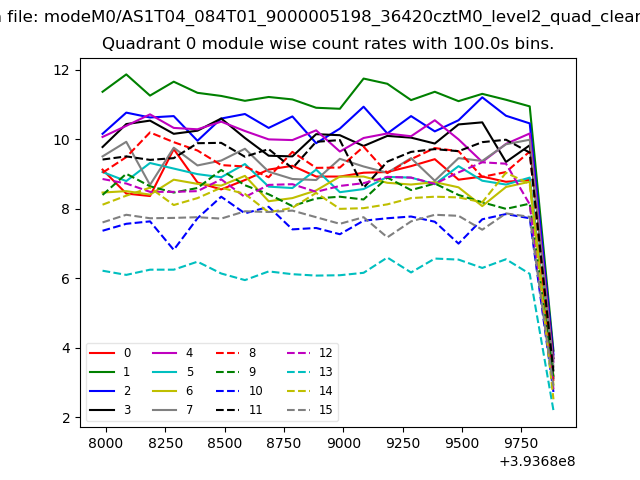
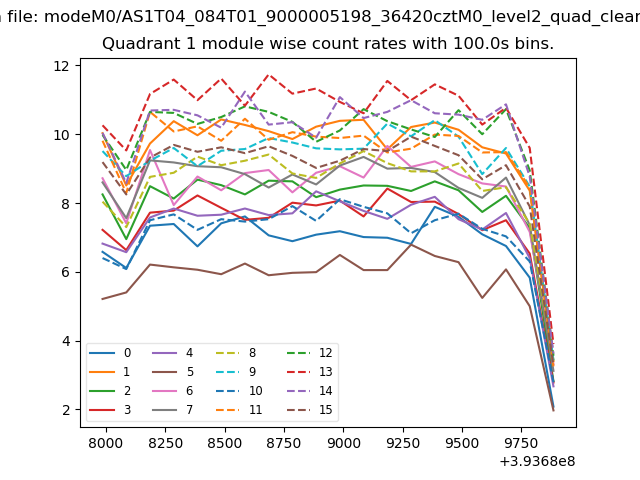
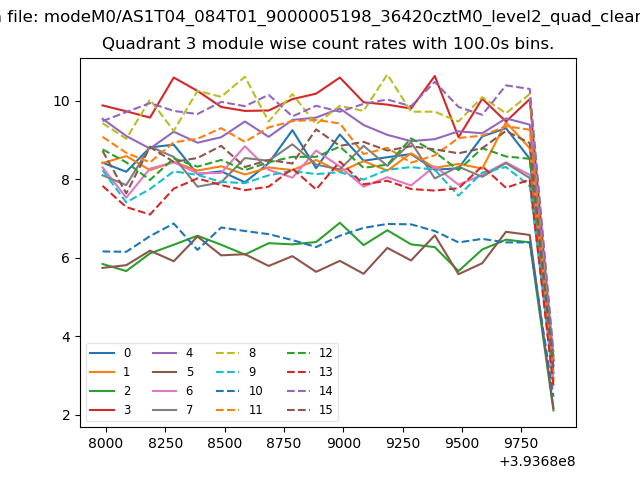
| Module-wise count rates for Quadrant A Data is divided into 100 sec bins |
 |
 |
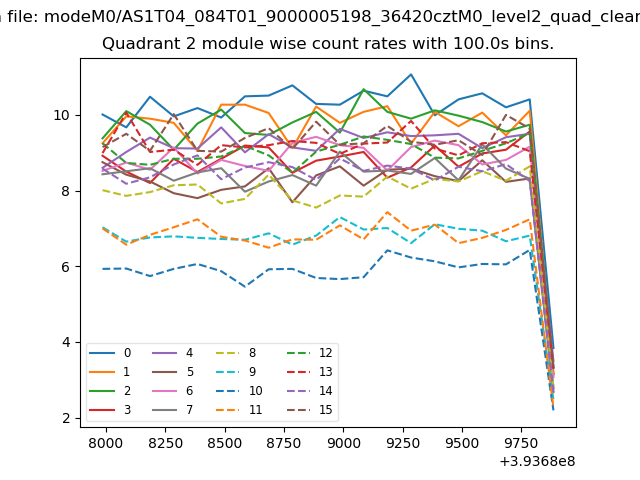
| Module-wise count rates for Quadrant B Data is divided into 100 sec bins |
 |
 |
| Module-wise count rates for Quadrant C Data is divided into 100 sec bins |
 |
 |
| Module-wise count rates for Quadrant D Data is divided into 100 sec bins |
 |
 |
| Parameter | Plot |
|---|---|
| CZT HV Monitor | 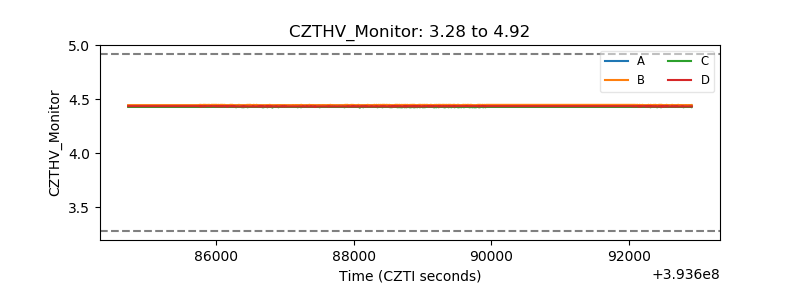 |
| D_VDD | 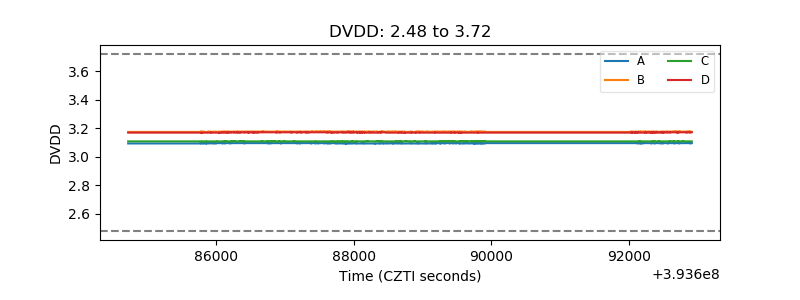 |
| Temperature 1 | 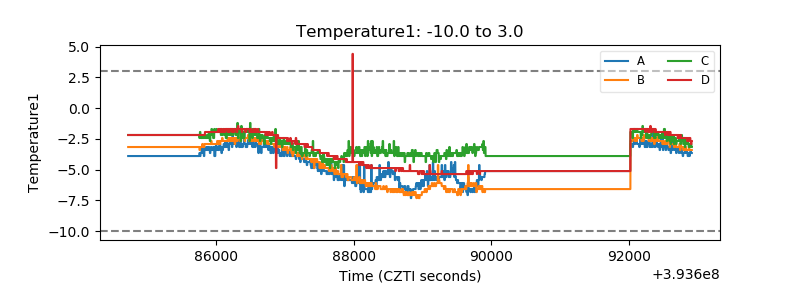 |
| Veto HV Monitor | 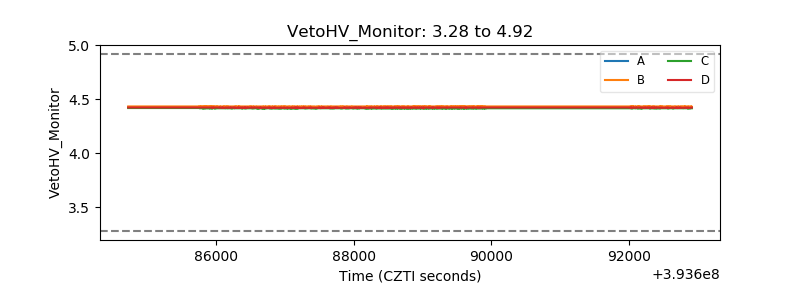 |
| Veto LLD | 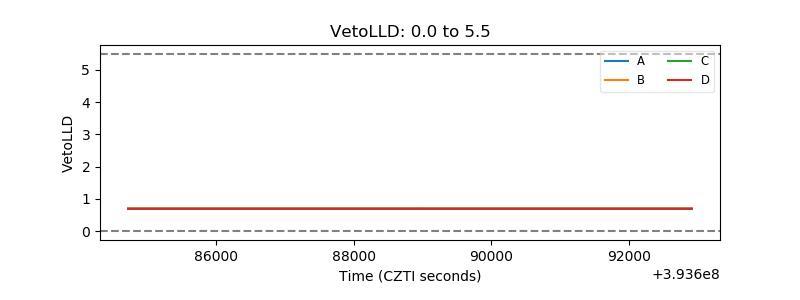 |
| Alpha Counter | 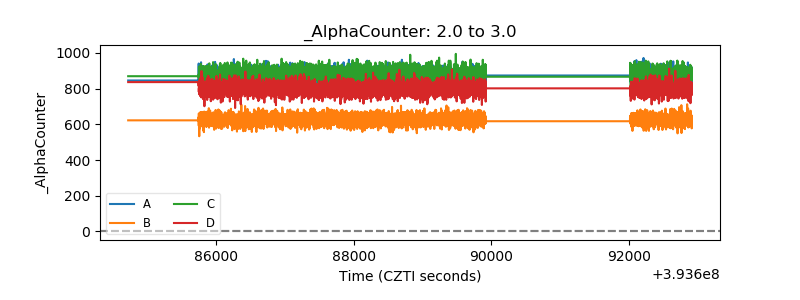 |
| _CPM_Rate | 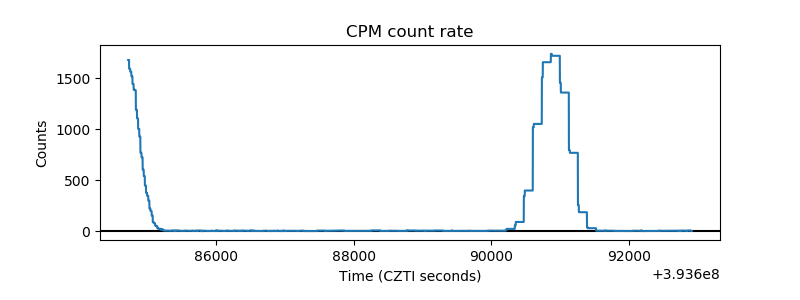 |
| CZT Counter | 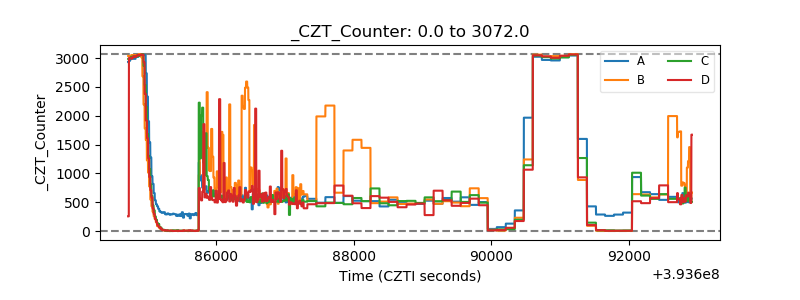 |
| +2.5 Volts monitor | 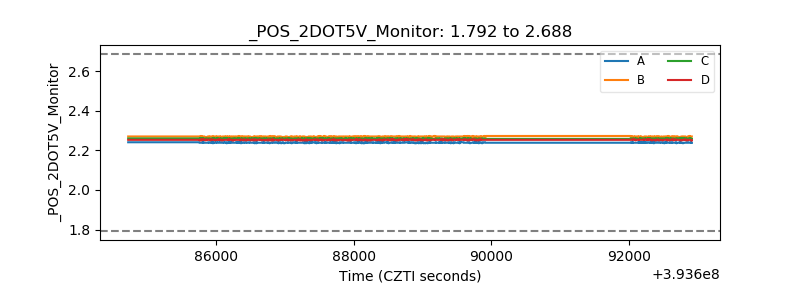 |
| +5 Volts monitor | 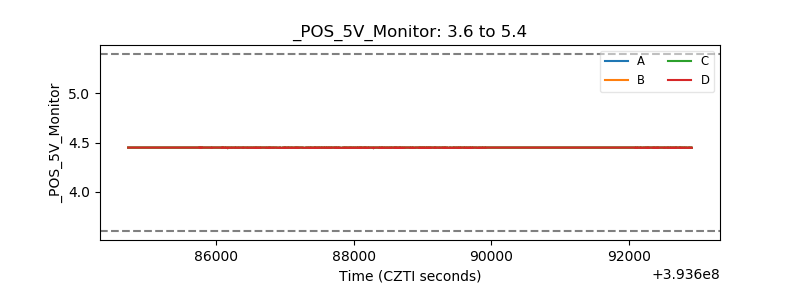 |
| _ROLL_ROT | 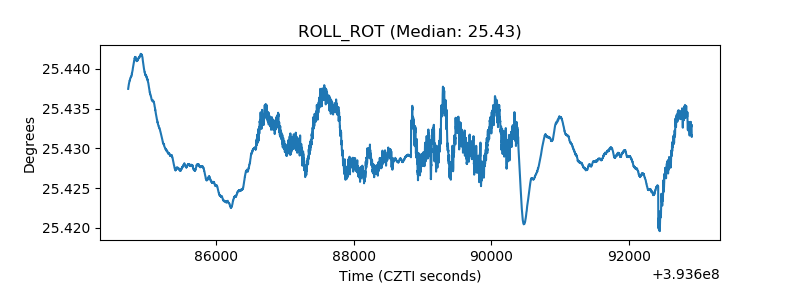 |
| _Roll_DEC | 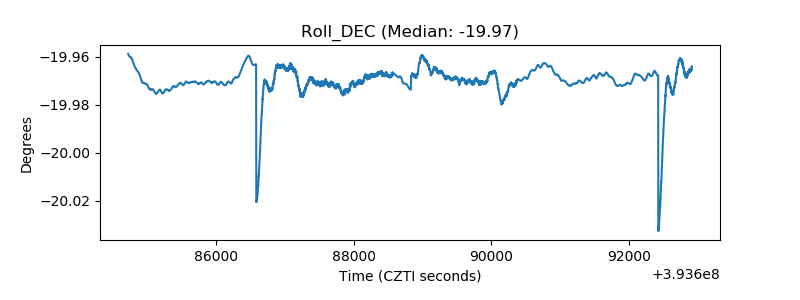 |
| _Roll_RA | 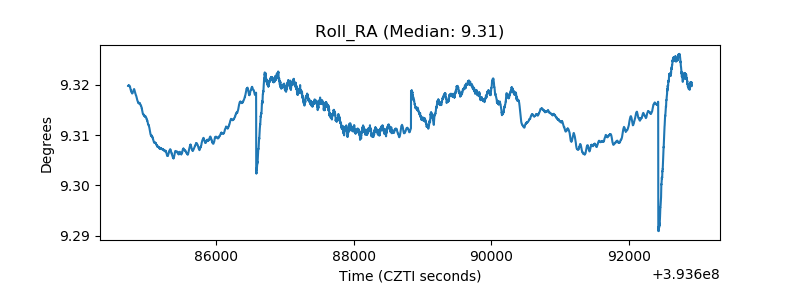 |
| Veto Counter | 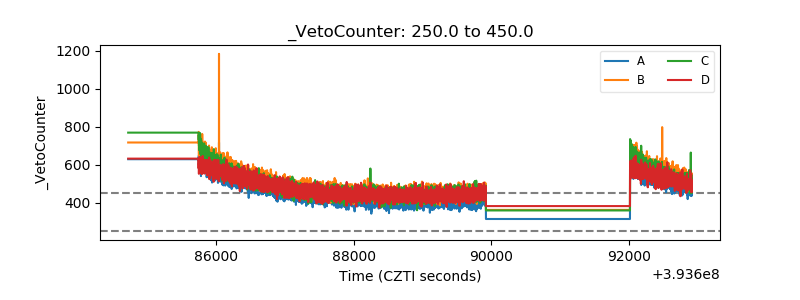 |