| Param | Original file | Final file |
|---|---|---|
| Filename | modeM0/AS1T04_084T01_9000005198_36415cztM0_level2.evt | modeM0/AS1T04_084T01_9000005198_36415cztM0_level2_quad_clean.evt |
| Size (bytes) | 443,759,040 | 69,200,640 |
| Size | 423.2 MB | 66.0 MB |
| Events in quadrant A | 2,787,014 | 431,559 |
| Events in quadrant B | 3,404,721 | 434,227 |
| Events in quadrant C | 3,144,112 | 423,016 |
| Events in quadrant D | 3,713,193 | 405,019 |
| Mode M0 | |||
|---|---|---|---|
| Quadrant | BADHDUFLAG | Total packets | Discarded packets |
| A | 0 | 11864 | 3 |
| B | 0 | 13859 | 2 |
| C | 0 | 12715 | 2 |
| D | 0 | 14984 | 2 |
| Mode SS | |||
|---|---|---|---|
| Quadrant | BADHDUFLAG | Total packets | Discarded packets |
| A | 0 | 118 | 0 |
| B | 0 | 118 | 0 |
| C | 0 | 118 | 0 |
| D | 0 | 118 | 0 |
| Mode M9 | |||
|---|---|---|---|
| Quadrant | BADHDUFLAG | Total packets | Discarded packets |
| A | 0 | 31 | 0 |
| B | 0 | 31 | 0 |
| C | 0 | 31 | 0 |
| D | 0 | 31 | 0 |
| Quadrant | Total seconds | Saturated seconds | Saturation percentage |
|---|---|---|---|
| A | 5746 | 3 | 0.052210% |
| B | 5746 | 122 | 2.123216% |
| C | 5746 | 110 | 1.914375% |
| D | 5746 | 217 | 3.776540% |
Noise dominated data is calculated using 1-second bins in cleaned event files. If a bin has >2000 counts, and if more than 50% of those come from <1% of pixels, then it is considered to be noise-dominated and hence unusable.
| Quadrant | # 1 sec bins | Bins with >0 counts | Bins with >2000 counts | High rate bins dominated by noise | Noise dominated (total time) | Noise dominated (detector-on time) | Marked lightcurve |
|---|---|---|---|---|---|---|---|
| A | 8852 | 5748 | 0 | 0 | 0.00% | 0.00% | 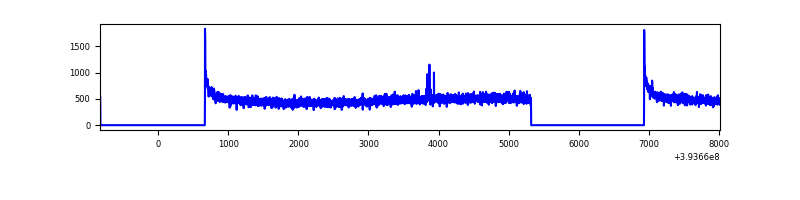 |
| B | 8852 | 5748 | 66 | 66 | 0.75% | 1.15% | 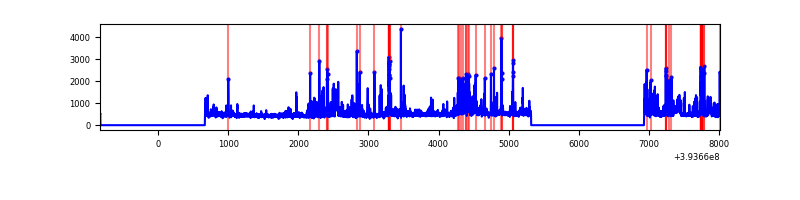 |
| C | 8852 | 5748 | 72 | 72 | 0.81% | 1.25% | 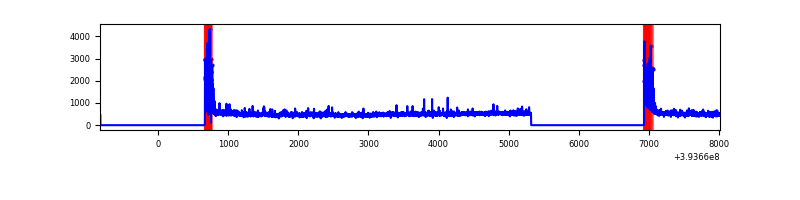 |
| D | 8852 | 5748 | 169 | 169 | 1.91% | 2.94% | 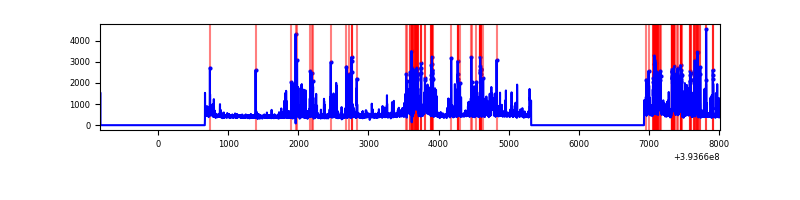 |
Top three noisy pixels from each quadrant. If the there are fewer than three noisy pixels in the level2.evt file, extra rows are filled as -1
| Pixel properties | Quadrant properties | ||||||
|---|---|---|---|---|---|---|---|
| Quadrant | DetID | PixID | Counts | Sigma | Mean | Median | Sigma |
| A | 10 | 83 | 195309 | 1444.75 | 664 | 651 | 134.7 |
| A | 15 | 223 | 15498 | 110.19 | 664 | 651 | 134.7 |
| A | 13 | 254 | 10087 | 70.03 | 664 | 651 | 134.7 |
| B | 5 | 255 | 343656 | 2718.69 | 651 | 635 | 126.2 |
| B | 5 | 172 | 223299 | 1764.77 | 651 | 635 | 126.2 |
| B | 0 | 189 | 86813 | 683.02 | 651 | 635 | 126.2 |
| C | 0 | 10 | 408391 | 2731.0 | 637 | 641 | 149.3 |
| C | 15 | 214 | 246734 | 1648.27 | 637 | 641 | 149.3 |
| C | 13 | 61 | 4207 | 23.88 | 637 | 641 | 149.3 |
| D | 2 | 249 | 576795 | 3689.85 | 639 | 623 | 156.2 |
| D | 2 | 250 | 249831 | 1595.95 | 639 | 623 | 156.2 |
| D | 10 | 199 | 103510 | 658.9 | 639 | 623 | 156.2 |
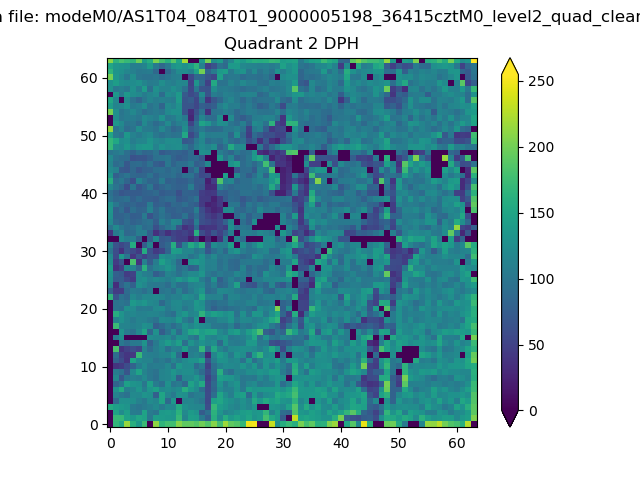
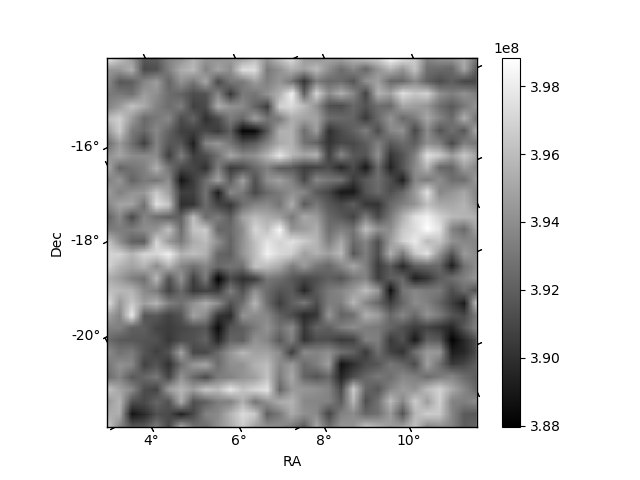
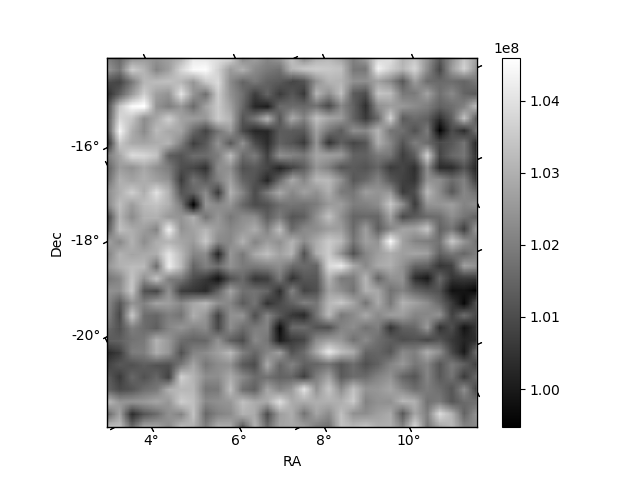
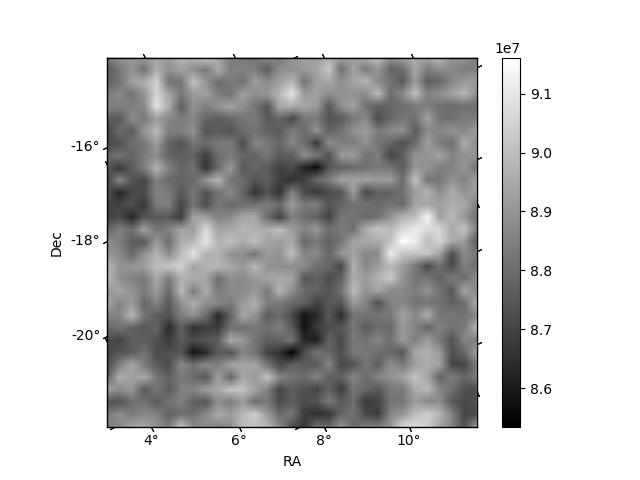
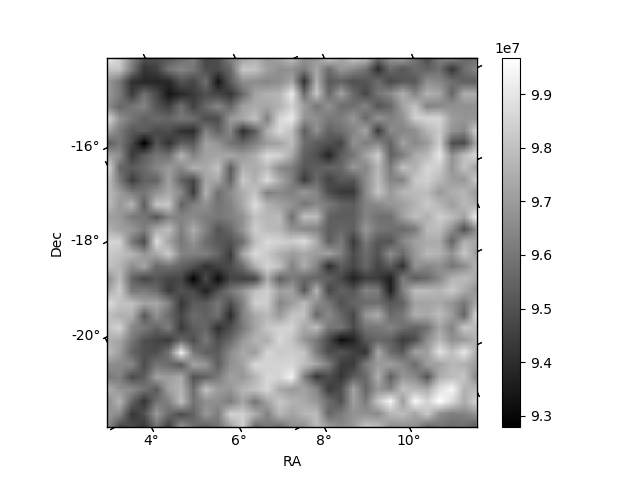
Histogram calculated using DETX and DETY for each event in the final _common_clean file
| Quadrant A | 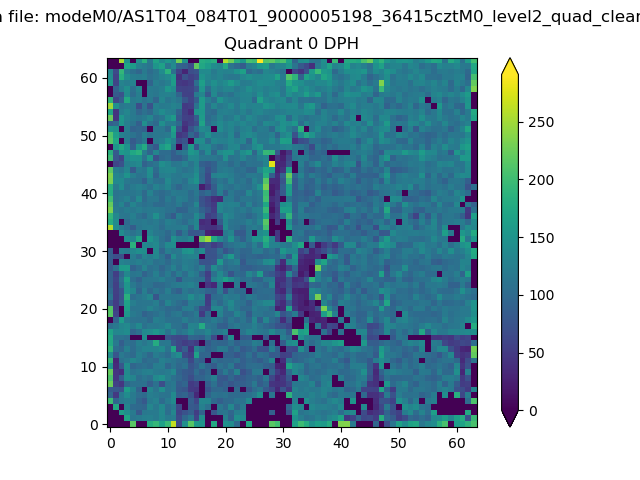 |
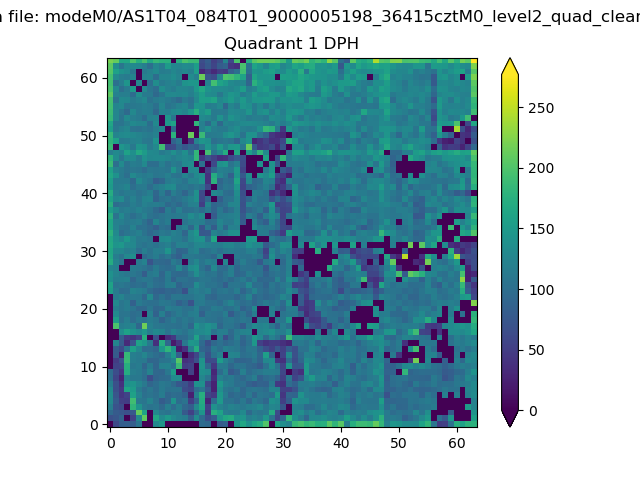 |
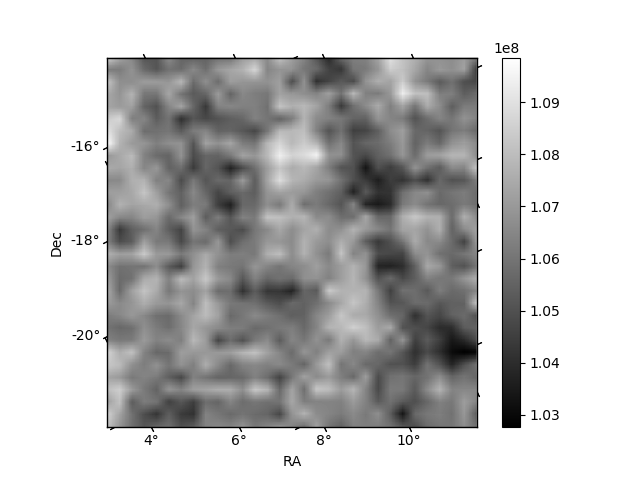
Quadrant B |
|---|---|---|---|
| Quadrant D | 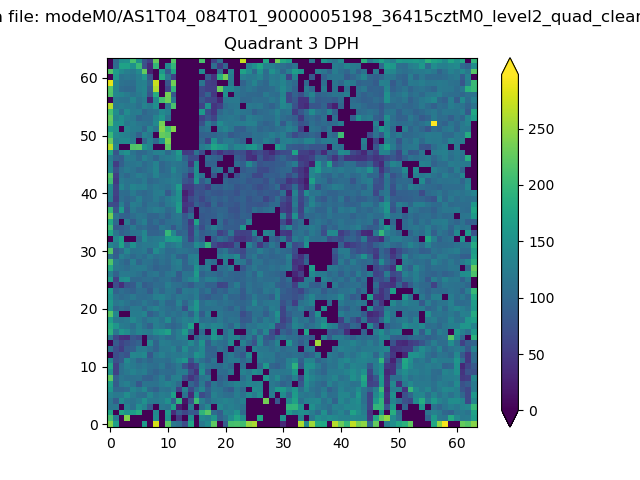 |
 |
Quadrant C |
| Plot type | Count rate plots | Images |
|---|---|---|
| Comparison with Poisson distribution Blue bars denote a histogram of data divided into 1 sec bins. Red curve is a Poisson curve with rate = median count rate of data. |
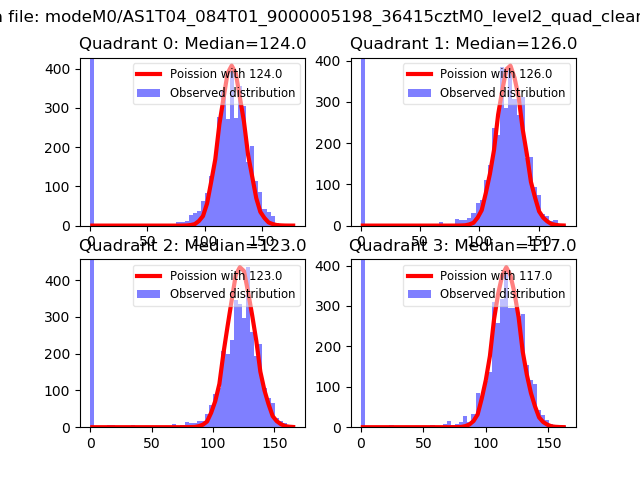 |
 |
| Quadrant-wise count rates Data is divided into 100 sec bins |
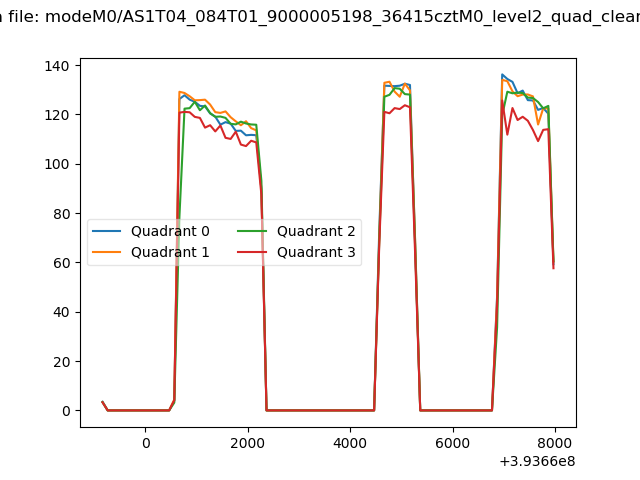 |
|
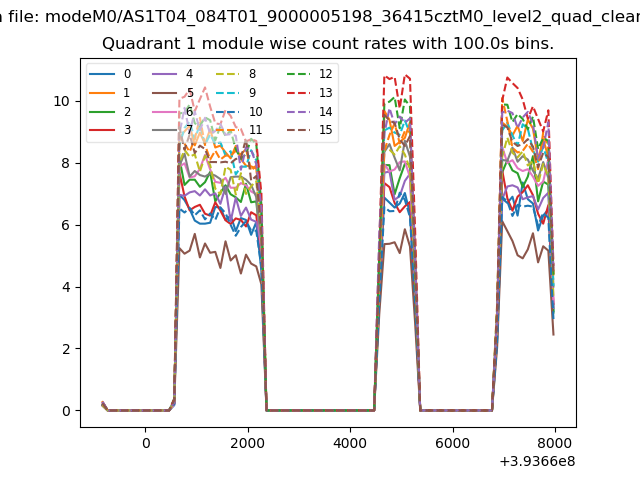
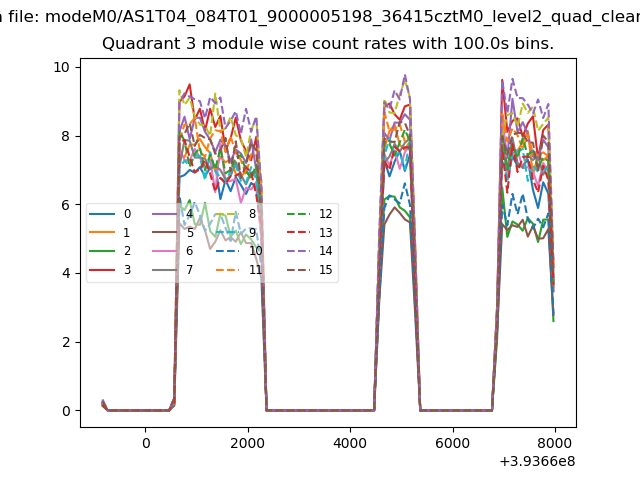
| Module-wise count rates for Quadrant A Data is divided into 100 sec bins |
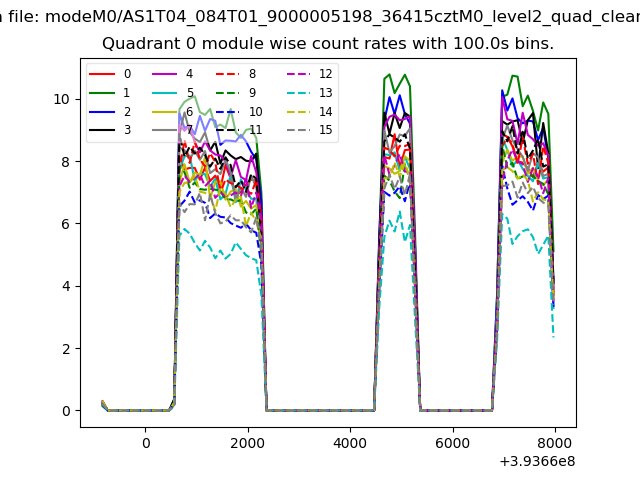 |
 |
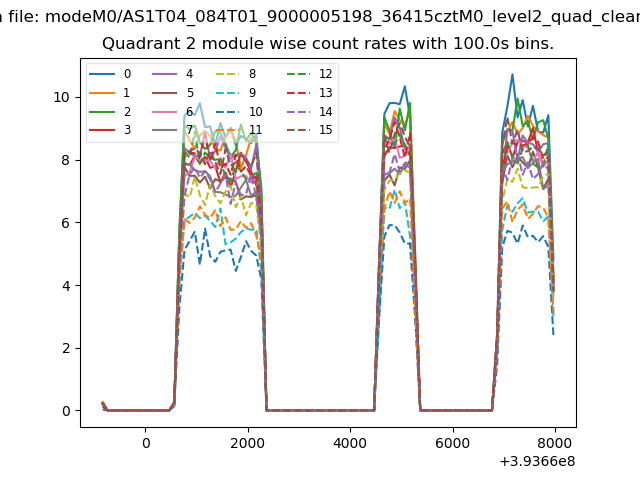
| Module-wise count rates for Quadrant B Data is divided into 100 sec bins |
 |
 |
| Module-wise count rates for Quadrant C Data is divided into 100 sec bins |
 |
 |
| Module-wise count rates for Quadrant D Data is divided into 100 sec bins |
 |
 |
| Parameter | Plot |
|---|---|
| CZT HV Monitor | 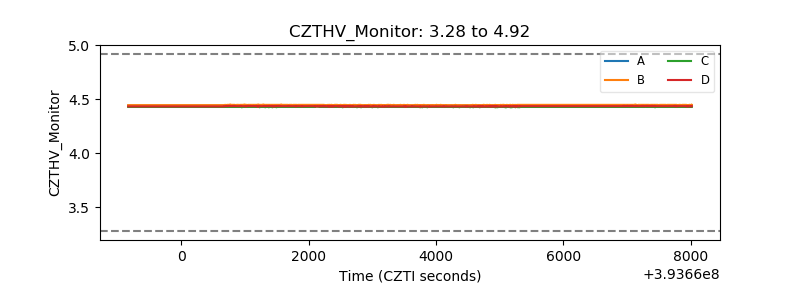 |
| D_VDD | 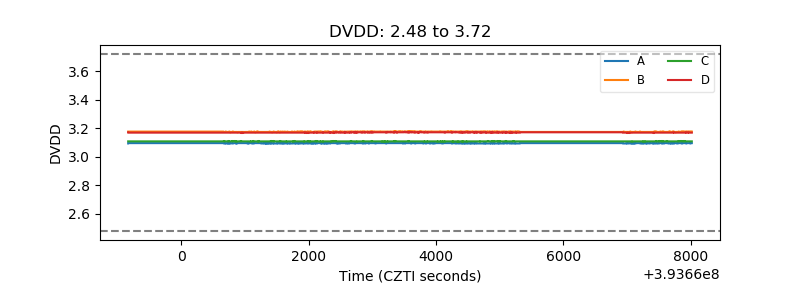 |
| Temperature 1 | 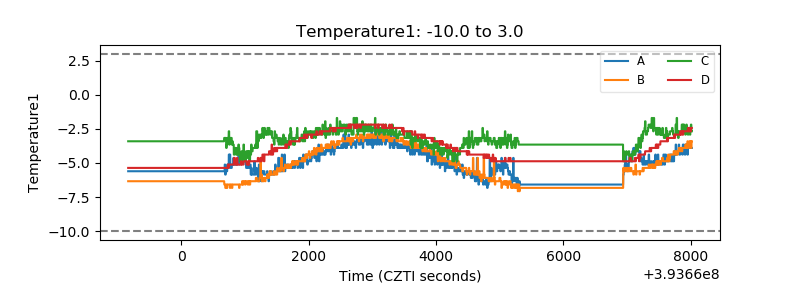 |
| Veto HV Monitor | 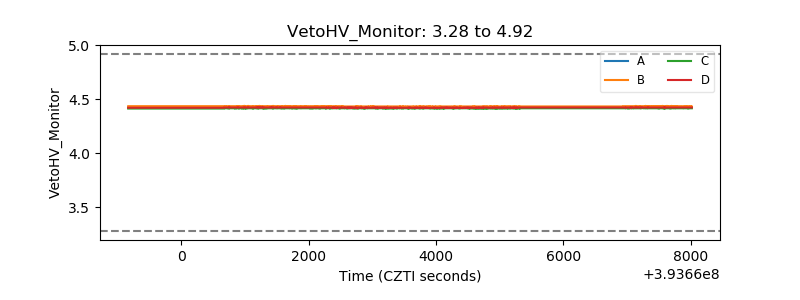 |
| Veto LLD | 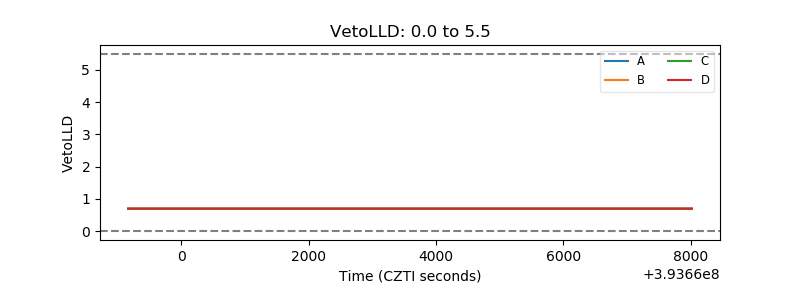 |
| Alpha Counter | 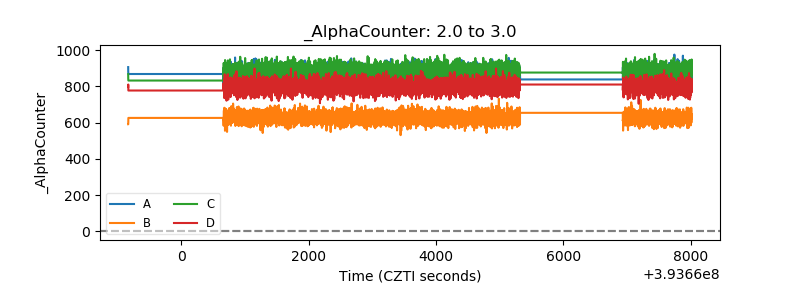 |
| _CPM_Rate | 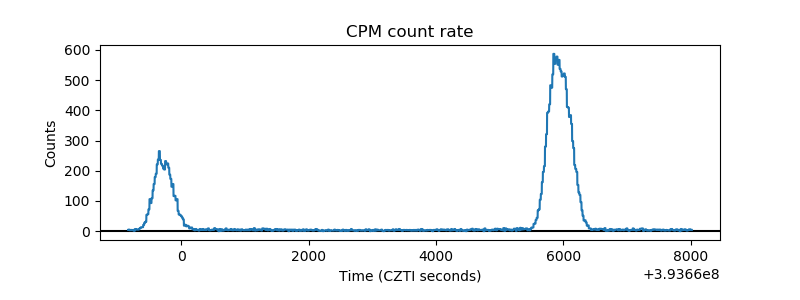 |
| CZT Counter | 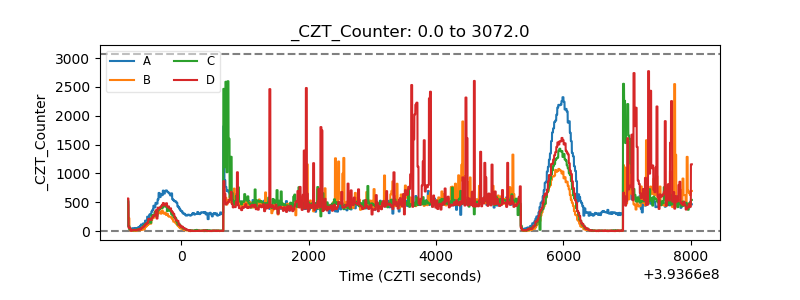 |
| +2.5 Volts monitor | 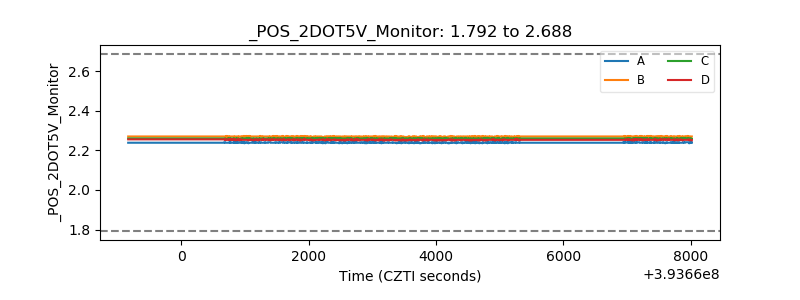 |
| +5 Volts monitor | 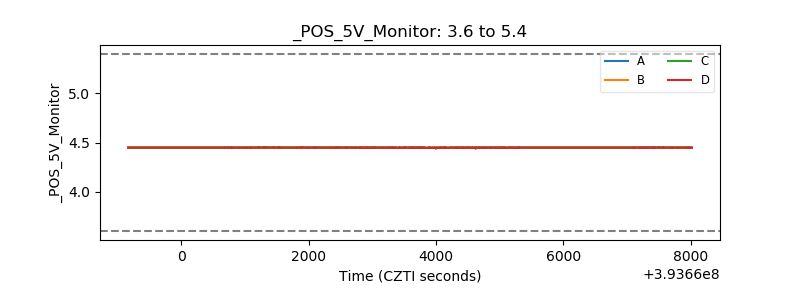 |
| _ROLL_ROT | 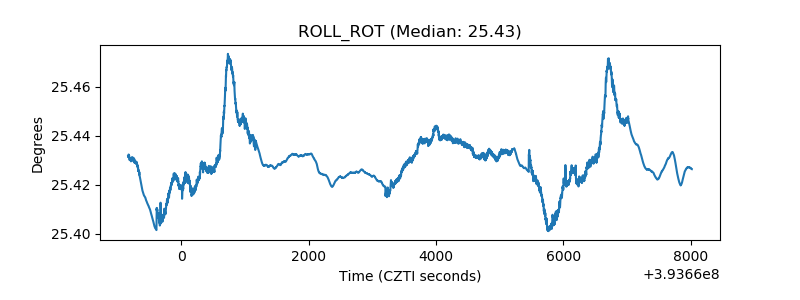 |
| _Roll_DEC | 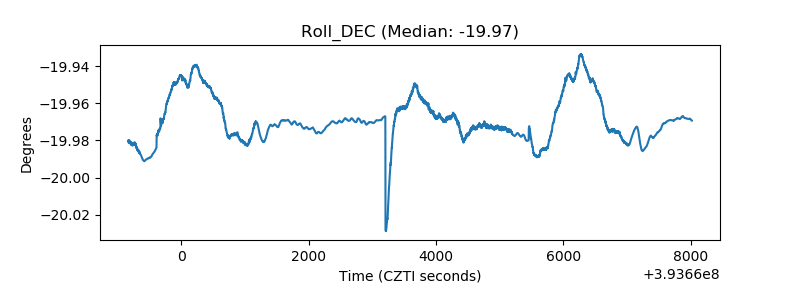 |
| _Roll_RA | 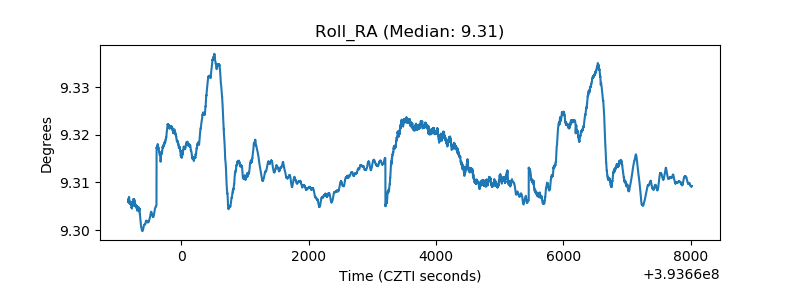 |
| Veto Counter | 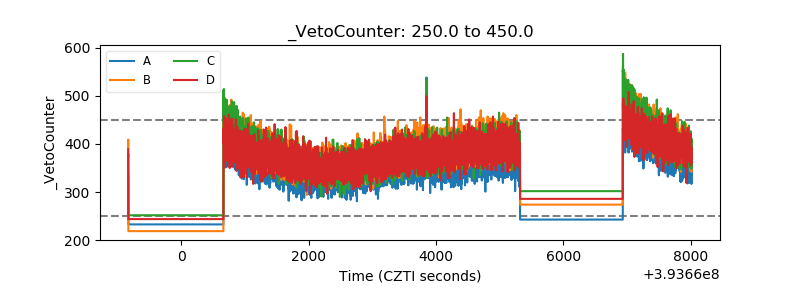 |