| Param | Original file | Final file |
|---|---|---|
| Filename | modeM0/AS1T04_084T01_9000005198_36410cztM0_level2.evt | modeM0/AS1T04_084T01_9000005198_36410cztM0_level2_quad_clean.evt |
| Size (bytes) | 494,297,280 | 85,095,360 |
| Size | 471.4 MB | 81.2 MB |
| Events in quadrant A | 2,917,754 | 554,015 |
| Events in quadrant B | 4,193,408 | 551,874 |
| Events in quadrant C | 3,144,863 | 544,250 |
| Events in quadrant D | 4,303,364 | 504,303 |
| Mode M0 | |||
|---|---|---|---|
| Quadrant | BADHDUFLAG | Total packets | Discarded packets |
| A | 0 | 12519 | 3 |
| B | 0 | 16517 | 2 |
| C | 0 | 12919 | 2 |
| D | 0 | 16838 | 2 |
| Mode SS | |||
|---|---|---|---|
| Quadrant | BADHDUFLAG | Total packets | Discarded packets |
| A | 0 | 124 | 0 |
| B | 0 | 124 | 0 |
| C | 0 | 124 | 0 |
| D | 0 | 124 | 0 |
| Mode M9 | |||
|---|---|---|---|
| Quadrant | BADHDUFLAG | Total packets | Discarded packets |
| A | 0 | 31 | 0 |
| B | 0 | 31 | 0 |
| C | 0 | 31 | 0 |
| D | 0 | 31 | 0 |
| Quadrant | Total seconds | Saturated seconds | Saturation percentage |
|---|---|---|---|
| A | 6051 | 8 | 0.132210% |
| B | 6051 | 303 | 5.007437% |
| C | 6051 | 52 | 0.859362% |
| D | 6051 | 354 | 5.850273% |
Noise dominated data is calculated using 1-second bins in cleaned event files. If a bin has >2000 counts, and if more than 50% of those come from <1% of pixels, then it is considered to be noise-dominated and hence unusable.
| Quadrant | # 1 sec bins | Bins with >0 counts | Bins with >2000 counts | High rate bins dominated by noise | Noise dominated (total time) | Noise dominated (detector-on time) | Marked lightcurve |
|---|---|---|---|---|---|---|---|
| A | 9155 | 6053 | 0 | 0 | 0.00% | 0.00% | 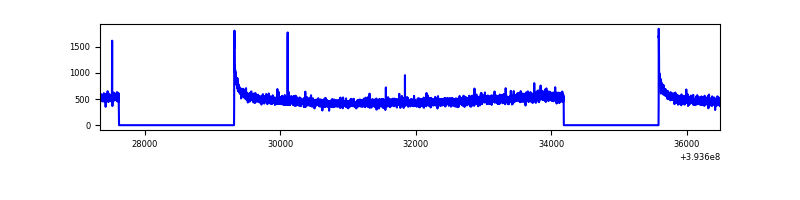 |
| B | 9155 | 6053 | 157 | 157 | 1.71% | 2.59% | 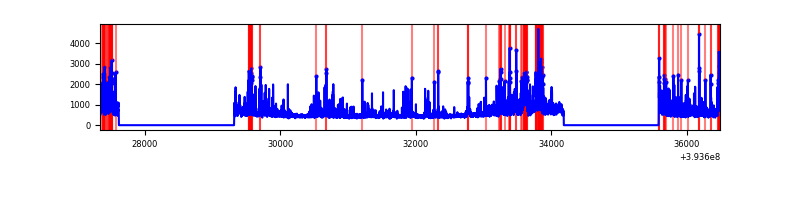 |
| C | 9155 | 6053 | 36 | 36 | 0.39% | 0.59% | 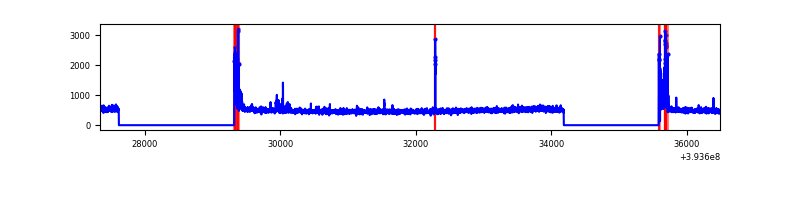 |
| D | 9155 | 6053 | 317 | 317 | 3.46% | 5.24% | 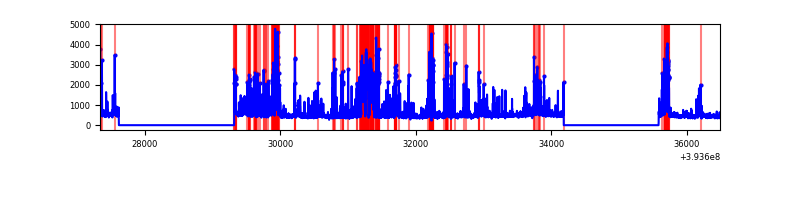 |
Top three noisy pixels from each quadrant. If the there are fewer than three noisy pixels in the level2.evt file, extra rows are filled as -1
| Pixel properties | Quadrant properties | ||||||
|---|---|---|---|---|---|---|---|
| Quadrant | DetID | PixID | Counts | Sigma | Mean | Median | Sigma |
| A | 10 | 83 | 194325 | 1372.99 | 699 | 685 | 141.0 |
| A | 13 | 254 | 12266 | 82.11 | 699 | 685 | 141.0 |
| A | 3 | 137 | 7392 | 47.56 | 699 | 685 | 141.0 |
| B | 5 | 172 | 608544 | 4592.21 | 683 | 664 | 132.4 |
| B | 5 | 255 | 409381 | 3087.64 | 683 | 664 | 132.4 |
| B | 0 | 189 | 310841 | 2343.22 | 683 | 664 | 132.4 |
| C | 15 | 214 | 260828 | 1631.65 | 681 | 687 | 159.4 |
| C | 0 | 10 | 212212 | 1326.72 | 681 | 687 | 159.4 |
| C | 6 | 252 | 10151 | 59.36 | 681 | 687 | 159.4 |
| D | 12 | 6 | 752206 | 4574.06 | 669 | 650 | 164.3 |
| D | 2 | 249 | 295346 | 1793.55 | 669 | 650 | 164.3 |
| D | 13 | 249 | 236594 | 1435.98 | 669 | 650 | 164.3 |
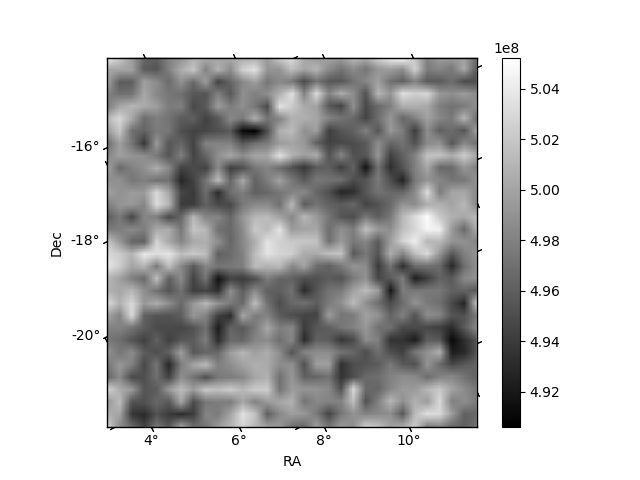
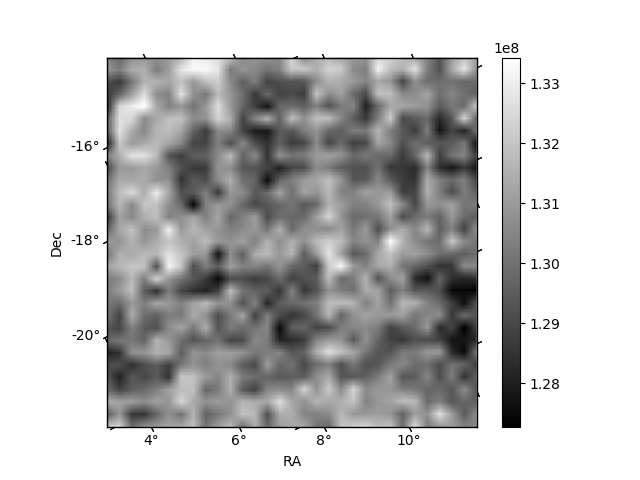
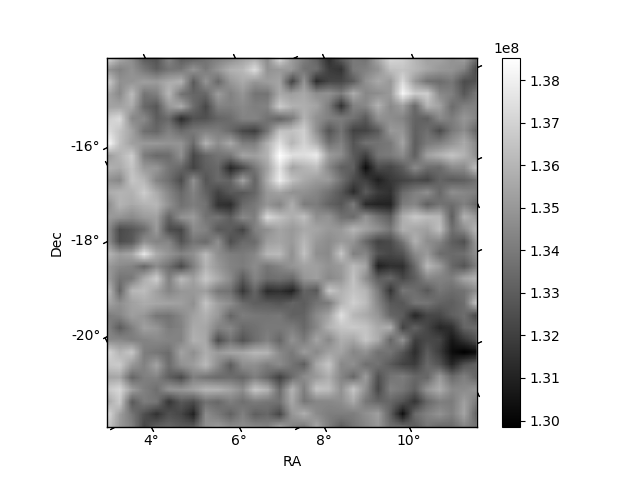
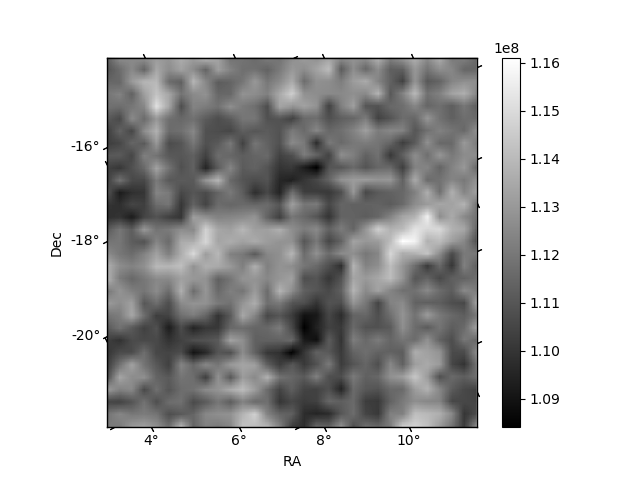
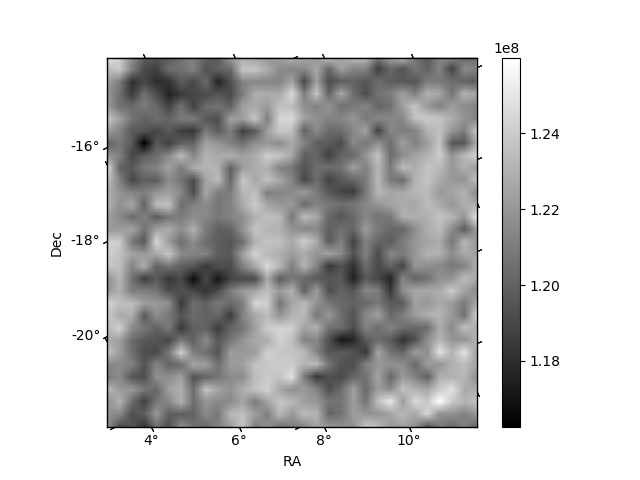
Histogram calculated using DETX and DETY for each event in the final _common_clean file
| Quadrant A | 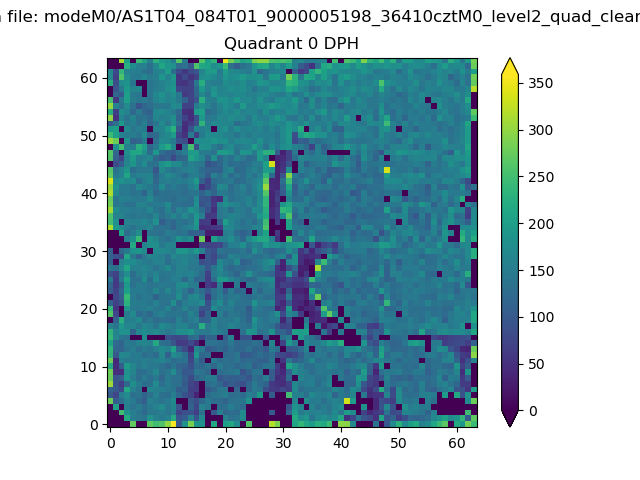 |
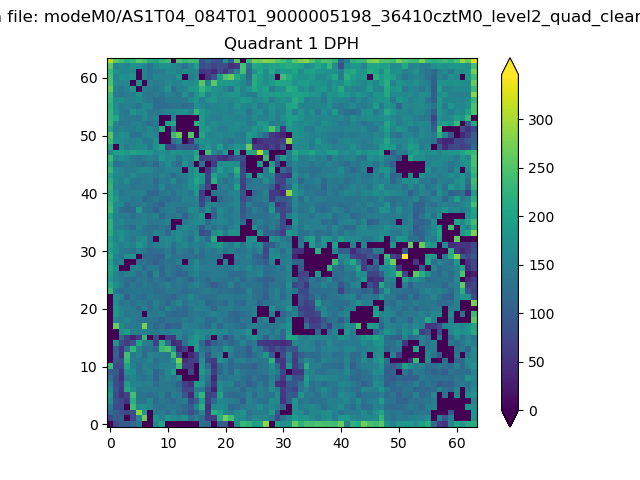 |
Quadrant B |
|---|---|---|---|
| Quadrant D | 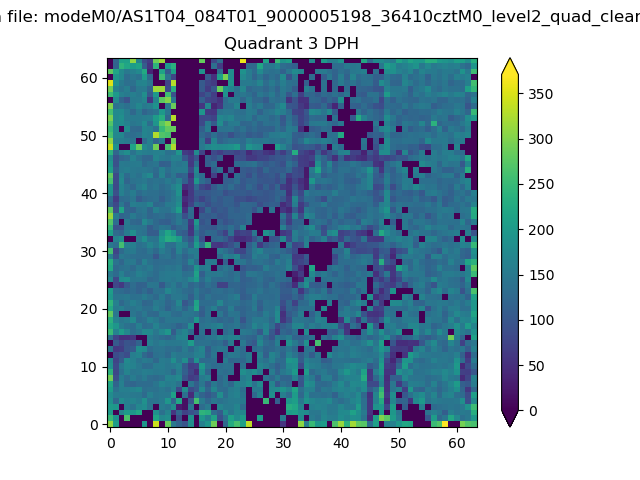 |
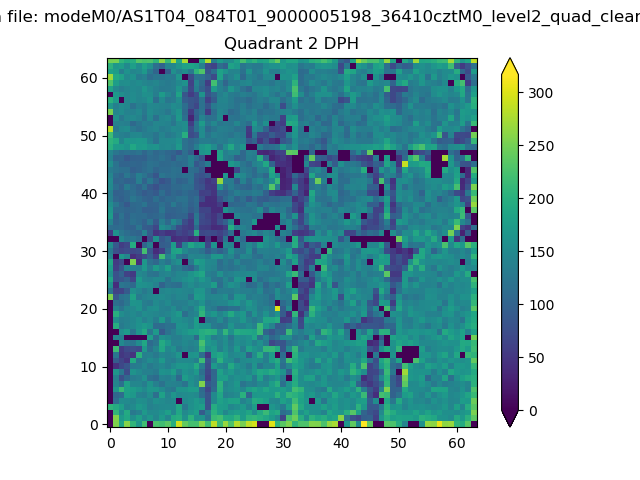 |
Quadrant C |
| Plot type | Count rate plots | Images |
|---|---|---|
| Comparison with Poisson distribution Blue bars denote a histogram of data divided into 1 sec bins. Red curve is a Poisson curve with rate = median count rate of data. |
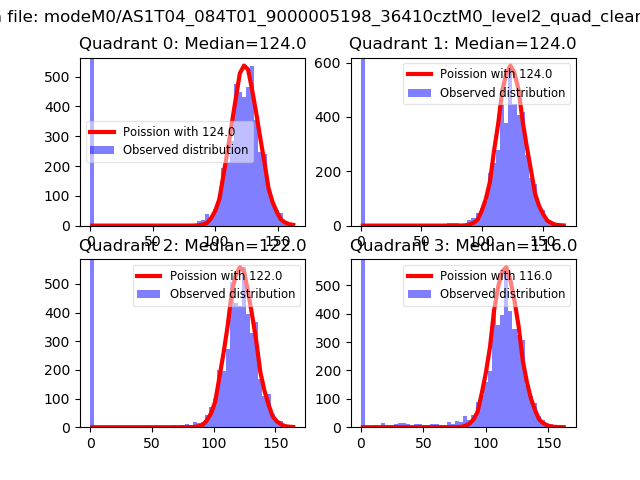 |
 |
| Quadrant-wise count rates Data is divided into 100 sec bins |
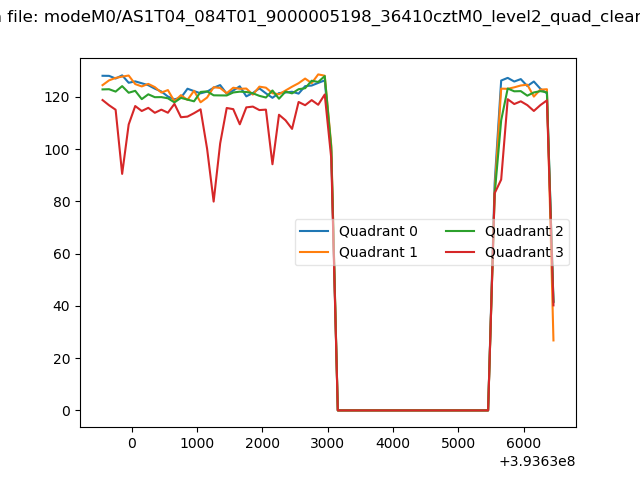 |
|
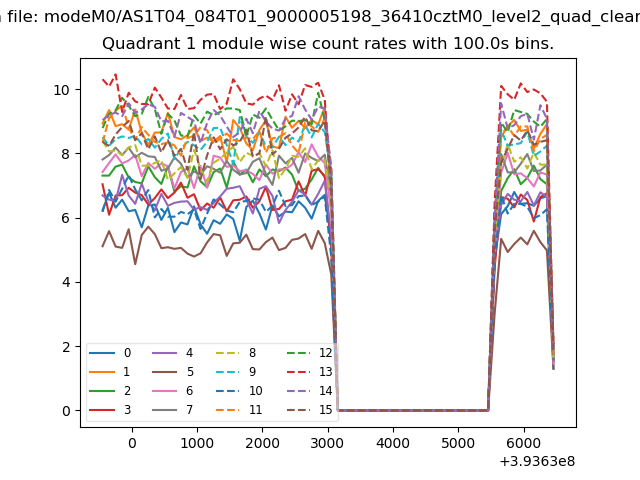
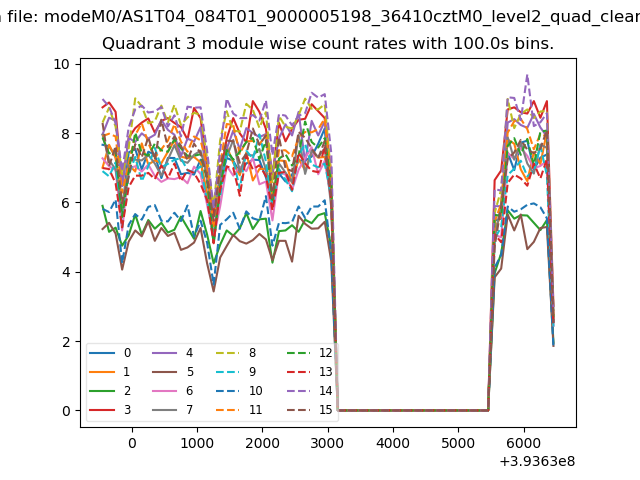
| Module-wise count rates for Quadrant A Data is divided into 100 sec bins |
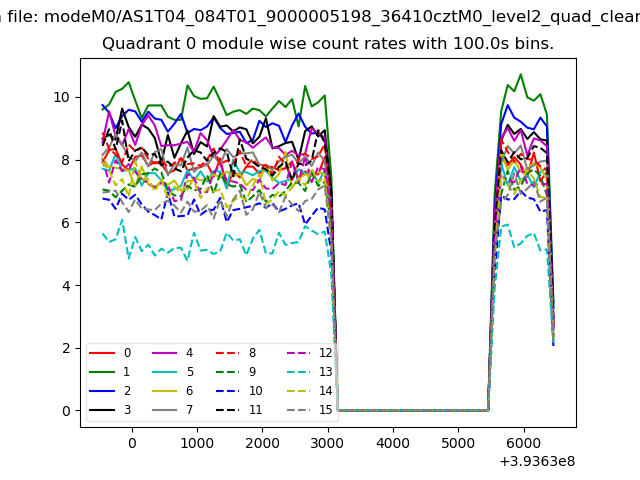 |
 |
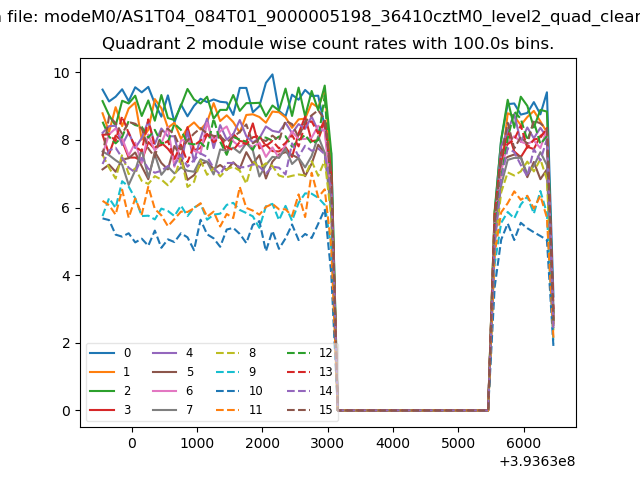
| Module-wise count rates for Quadrant B Data is divided into 100 sec bins |
 |
 |
| Module-wise count rates for Quadrant C Data is divided into 100 sec bins |
 |
 |
| Module-wise count rates for Quadrant D Data is divided into 100 sec bins |
 |
 |
| Parameter | Plot |
|---|---|
| CZT HV Monitor | 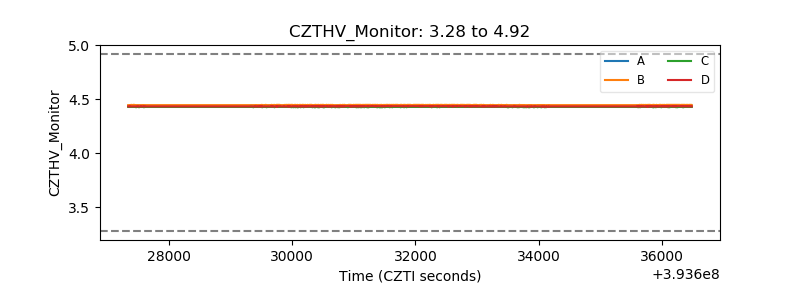 |
| D_VDD | 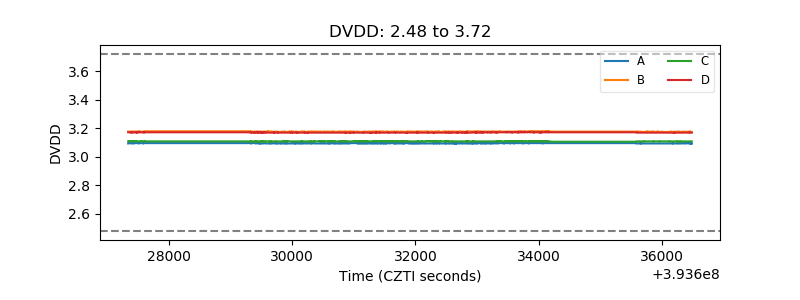 |
| Temperature 1 | 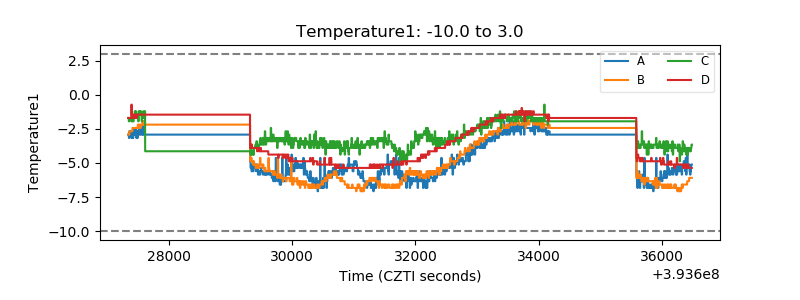 |
| Veto HV Monitor | 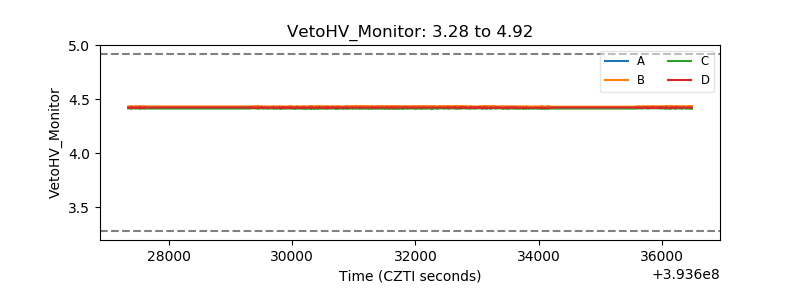 |
| Veto LLD | 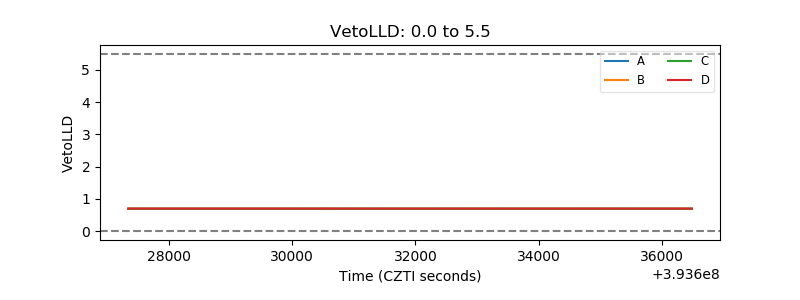 |
| Alpha Counter | 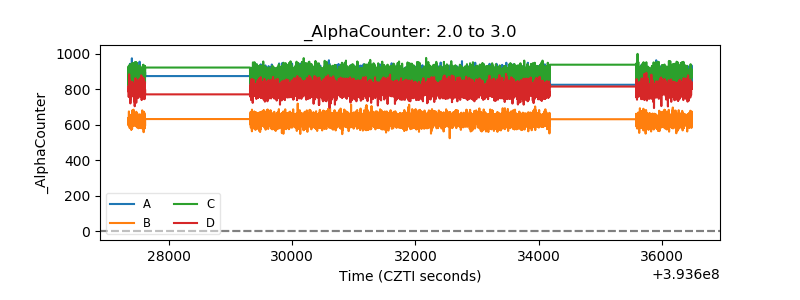 |
| _CPM_Rate | 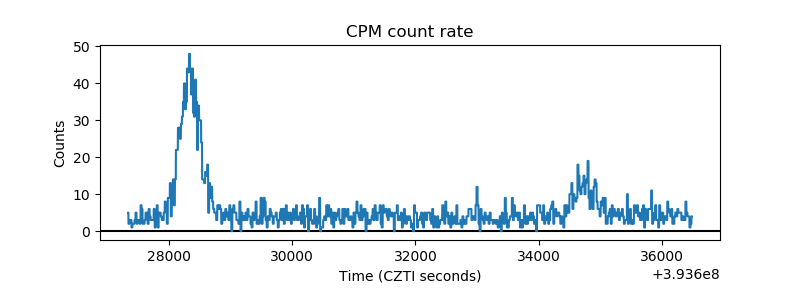 |
| CZT Counter | 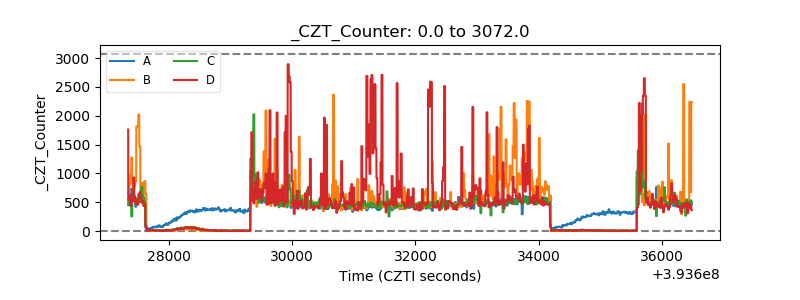 |
| +2.5 Volts monitor | 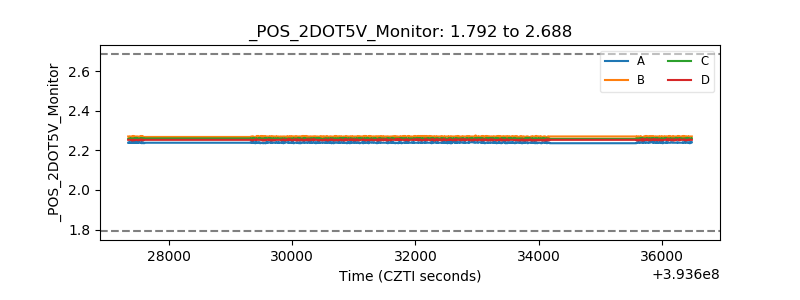 |
| +5 Volts monitor | 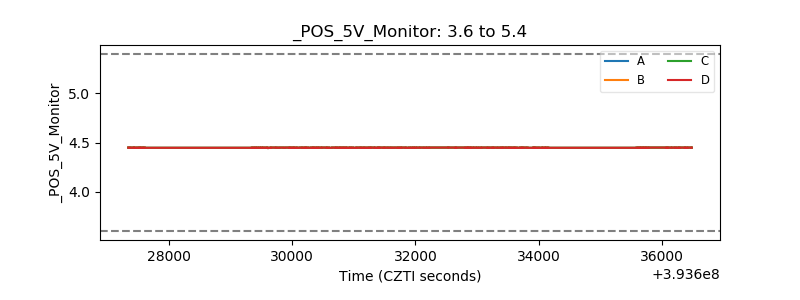 |
| _ROLL_ROT |  |
| _Roll_DEC | 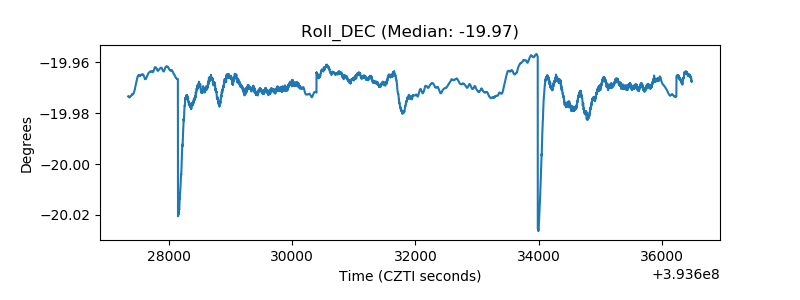 |
| _Roll_RA | 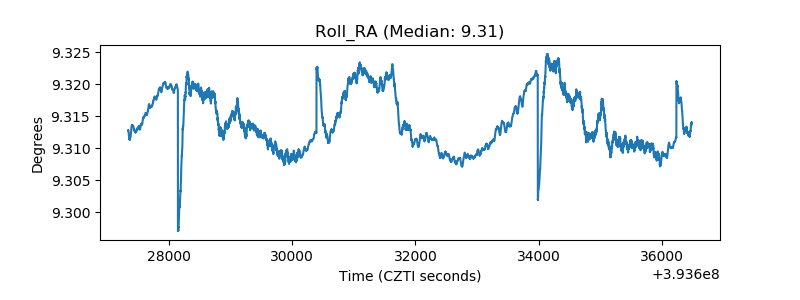 |
| Veto Counter | 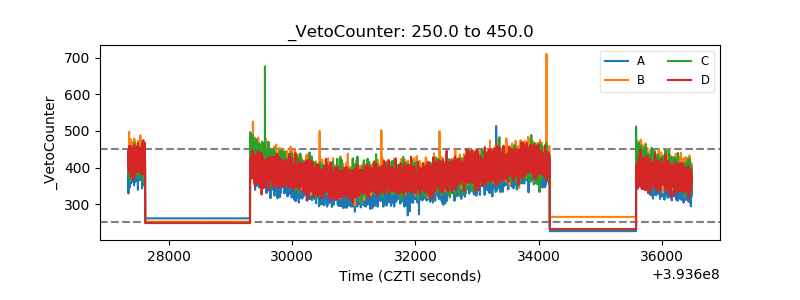 |