| Param | Original file | Final file |
|---|---|---|
| Filename | modeM0/AS1T04_084T01_9000005198_36403cztM0_level2.evt | modeM0/AS1T04_084T01_9000005198_36403cztM0_level2_quad_clean.evt |
| Size (bytes) | 506,393,280 | 59,152,320 |
| Size | 482.9 MB | 56.4 MB |
| Events in quadrant A | 2,803,077 | 363,687 |
| Events in quadrant B | 4,618,368 | 366,368 |
| Events in quadrant C | 3,019,996 | 353,327 |
| Events in quadrant D | 4,522,467 | 323,397 |
| Mode M0 | |||
|---|---|---|---|
| Quadrant | BADHDUFLAG | Total packets | Discarded packets |
| A | 0 | 11568 | 3 |
| B | 0 | 17183 | 2 |
| C | 0 | 12163 | 2 |
| D | 0 | 17058 | 2 |
| Mode SS | |||
|---|---|---|---|
| Quadrant | BADHDUFLAG | Total packets | Discarded packets |
| A | 0 | 110 | 0 |
| B | 0 | 110 | 0 |
| C | 0 | 110 | 0 |
| D | 0 | 110 | 0 |
| Mode M9 | |||
|---|---|---|---|
| Quadrant | BADHDUFLAG | Total packets | Discarded packets |
| A | 0 | 21 | 0 |
| B | 0 | 21 | 0 |
| C | 0 | 21 | 0 |
| D | 0 | 22 | 0 |
| Quadrant | Total seconds | Saturated seconds | Saturation percentage |
|---|---|---|---|
| A | 5493 | 12 | 0.218460% |
| B | 5493 | 641 | 11.669397% |
| C | 5493 | 89 | 1.620244% |
| D | 5493 | 572 | 10.413253% |
Noise dominated data is calculated using 1-second bins in cleaned event files. If a bin has >2000 counts, and if more than 50% of those come from <1% of pixels, then it is considered to be noise-dominated and hence unusable.
| Quadrant | # 1 sec bins | Bins with >0 counts | Bins with >2000 counts | High rate bins dominated by noise | Noise dominated (total time) | Noise dominated (detector-on time) | Marked lightcurve |
|---|---|---|---|---|---|---|---|
| A | 7315 | 5494 | 0 | 0 | 0.00% | 0.00% | 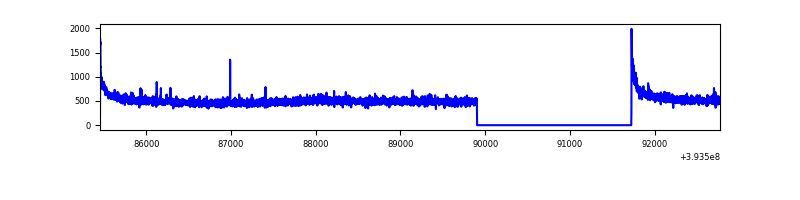 |
| B | 7315 | 5494 | 491 | 491 | 6.71% | 8.94% | 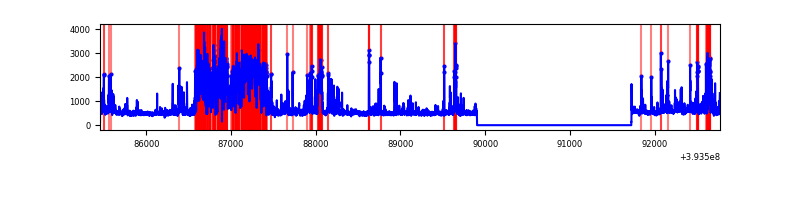 |
| C | 7315 | 5494 | 72 | 72 | 0.98% | 1.31% | 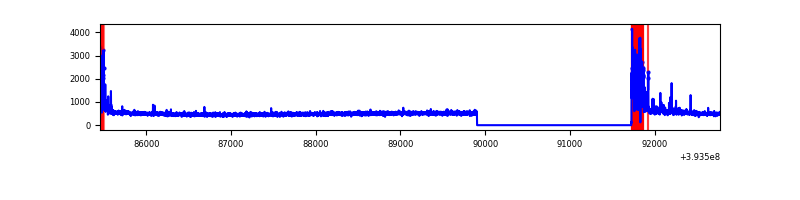 |
| D | 7315 | 5494 | 463 | 463 | 6.33% | 8.43% | 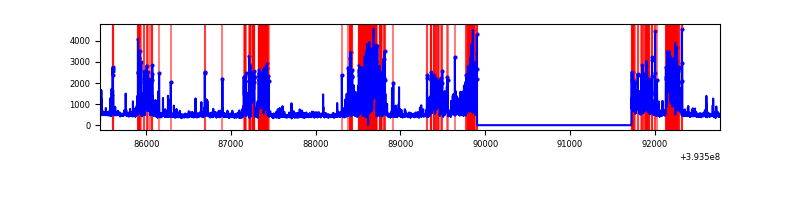 |
Top three noisy pixels from each quadrant. If the there are fewer than three noisy pixels in the level2.evt file, extra rows are filled as -1
| Pixel properties | Quadrant properties | ||||||
|---|---|---|---|---|---|---|---|
| Quadrant | DetID | PixID | Counts | Sigma | Mean | Median | Sigma |
| A | 10 | 83 | 192304 | 1431.8 | 663 | 650 | 133.9 |
| A | 15 | 223 | 21648 | 156.87 | 663 | 650 | 133.9 |
| A | 13 | 6 | 12458 | 88.21 | 663 | 650 | 133.9 |
| B | 5 | 172 | 1741178 | 14477.73 | 628 | 610 | 120.2 |
| B | 0 | 189 | 129285 | 1070.3 | 628 | 610 | 120.2 |
| B | 5 | 255 | 118549 | 981.0 | 628 | 610 | 120.2 |
| C | 0 | 10 | 319070 | 2149.37 | 633 | 635 | 148.2 |
| C | 15 | 214 | 232586 | 1565.62 | 633 | 635 | 148.2 |
| C | 13 | 61 | 4246 | 24.37 | 633 | 635 | 148.2 |
| D | 12 | 6 | 1419028 | 9347.7 | 615 | 598 | 151.7 |
| D | 12 | 233 | 194880 | 1280.35 | 615 | 598 | 151.7 |
| D | 13 | 171 | 160611 | 1054.51 | 615 | 598 | 151.7 |
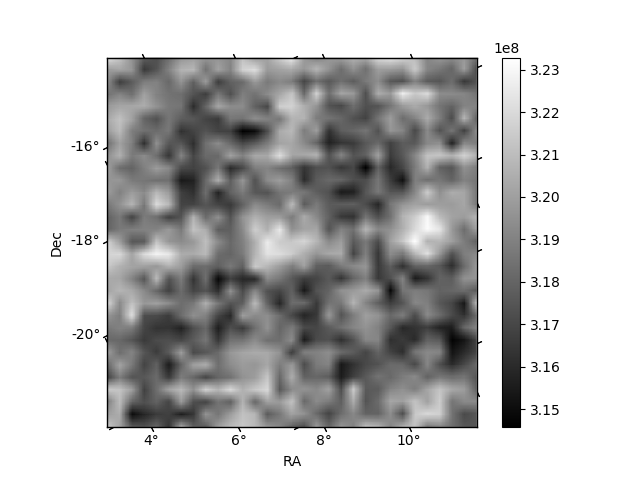
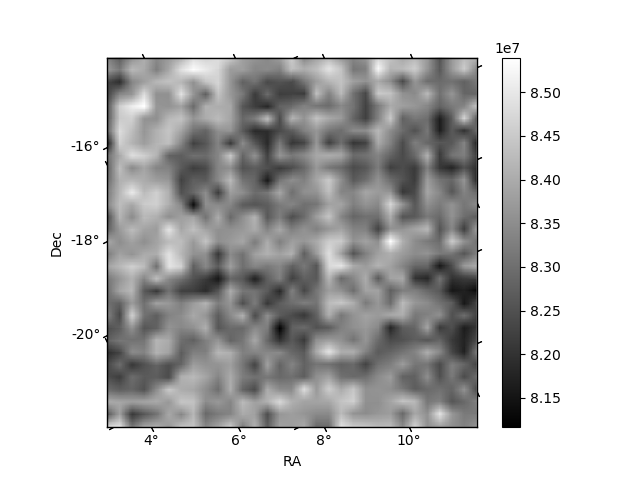
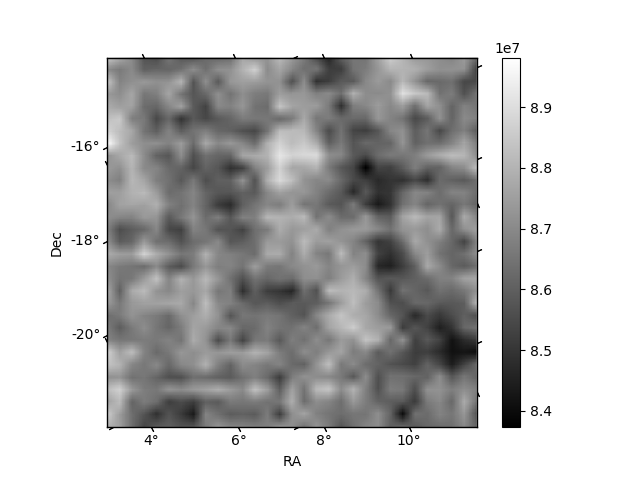
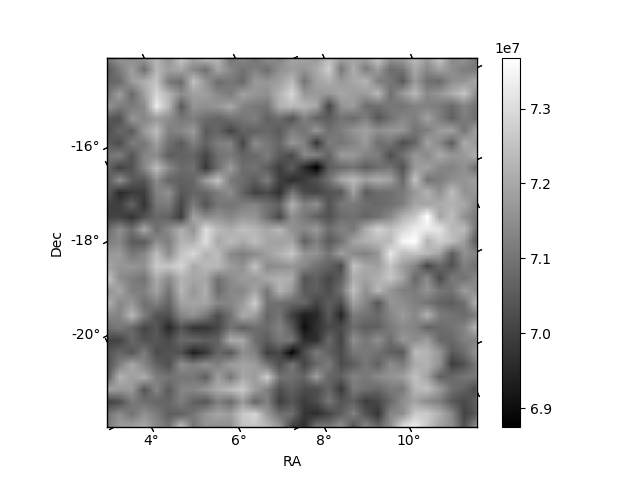
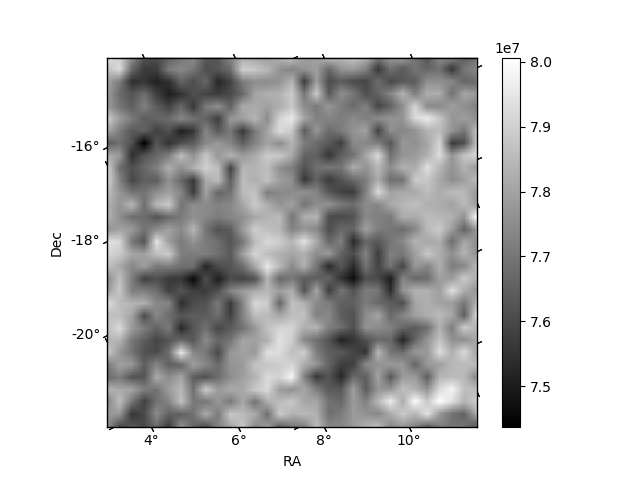
Histogram calculated using DETX and DETY for each event in the final _common_clean file
| Quadrant A | 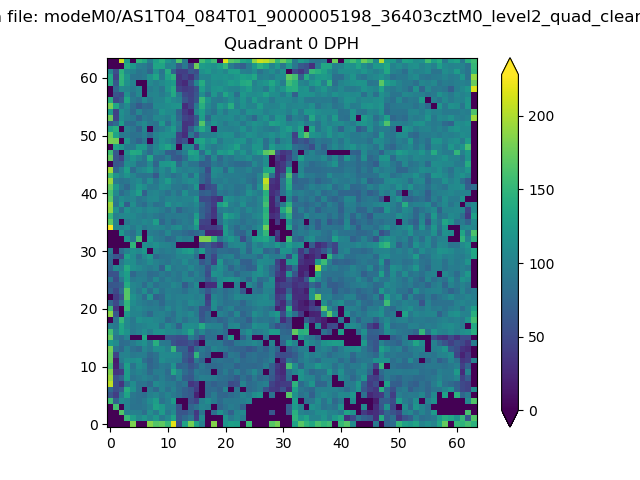 |
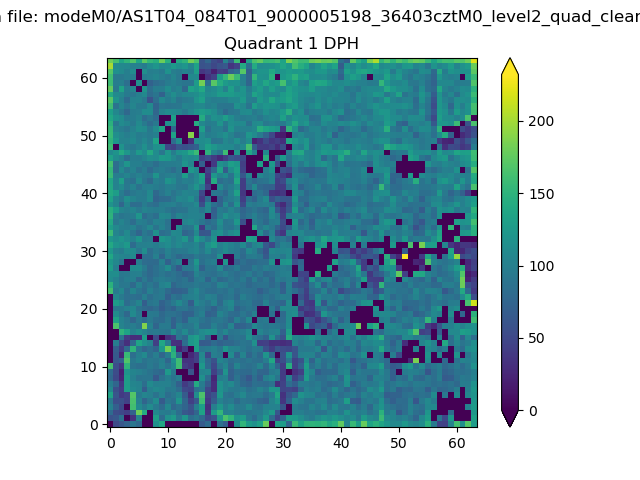 |
Quadrant B |
|---|---|---|---|
| Quadrant D | 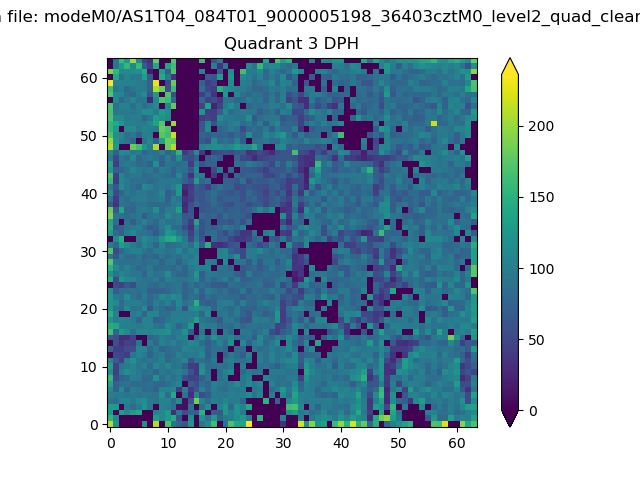 |
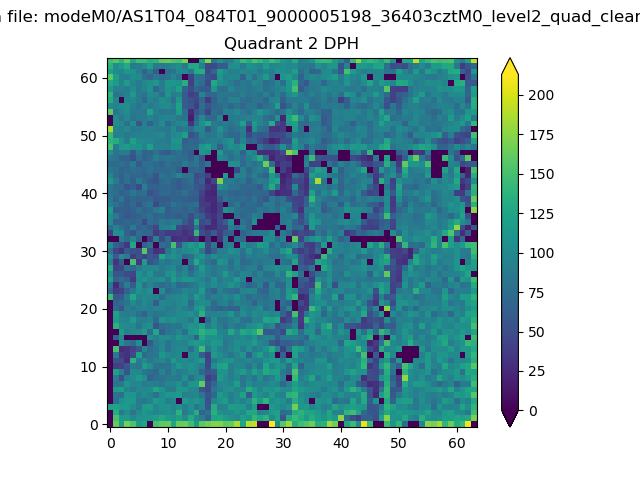 |
Quadrant C |
| Plot type | Count rate plots | Images |
|---|---|---|
| Comparison with Poisson distribution Blue bars denote a histogram of data divided into 1 sec bins. Red curve is a Poisson curve with rate = median count rate of data. |
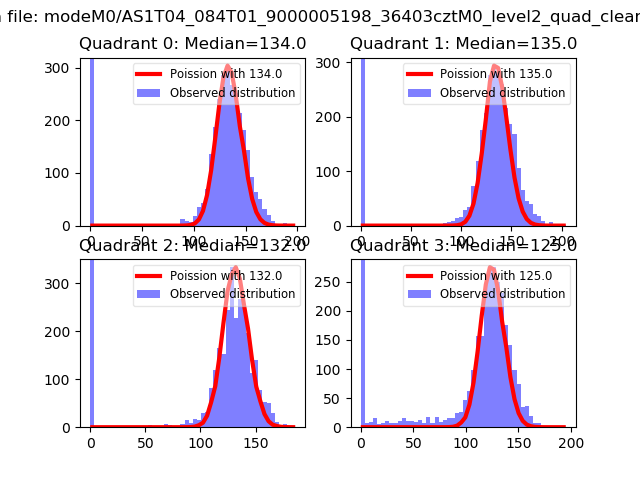 |
 |
| Quadrant-wise count rates Data is divided into 100 sec bins |
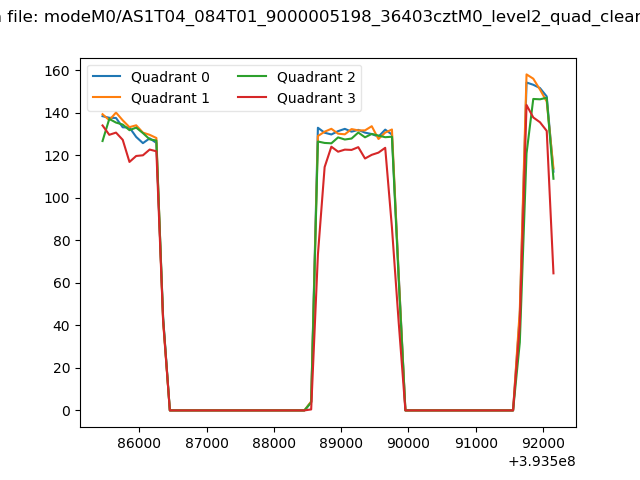 |
|
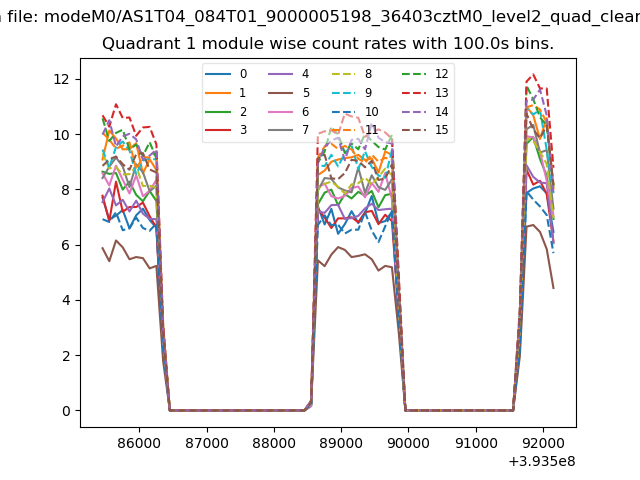
| Module-wise count rates for Quadrant A Data is divided into 100 sec bins |
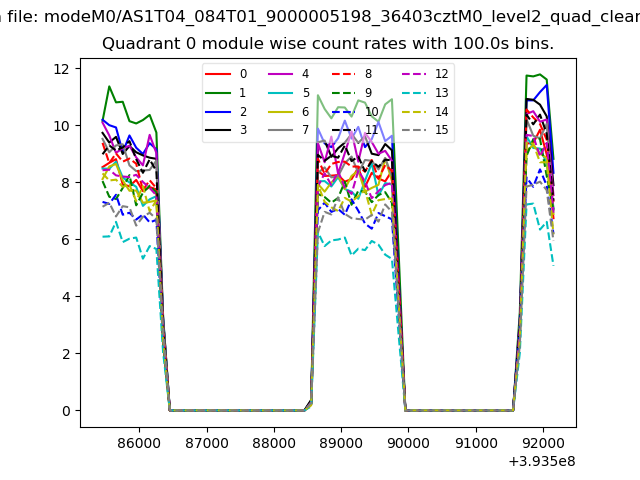 |
 |
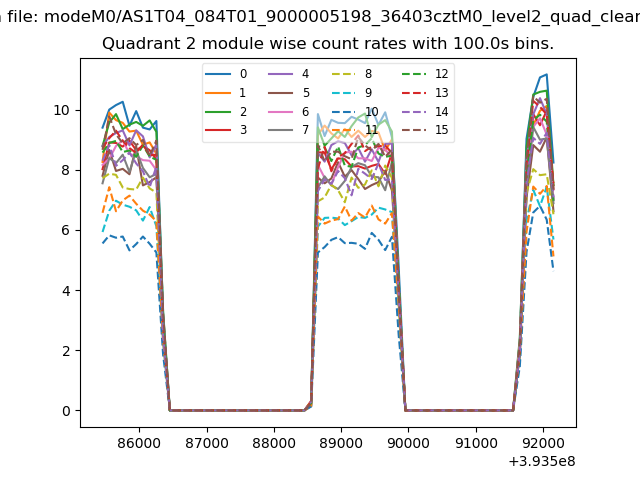
| Module-wise count rates for Quadrant B Data is divided into 100 sec bins |
 |
 |
| Module-wise count rates for Quadrant C Data is divided into 100 sec bins |
 |
 |
| Module-wise count rates for Quadrant D Data is divided into 100 sec bins |
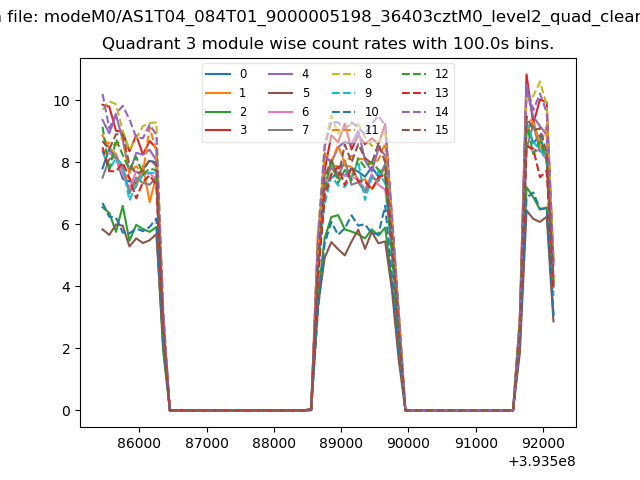 |
 |
| Parameter | Plot |
|---|---|
| CZT HV Monitor | 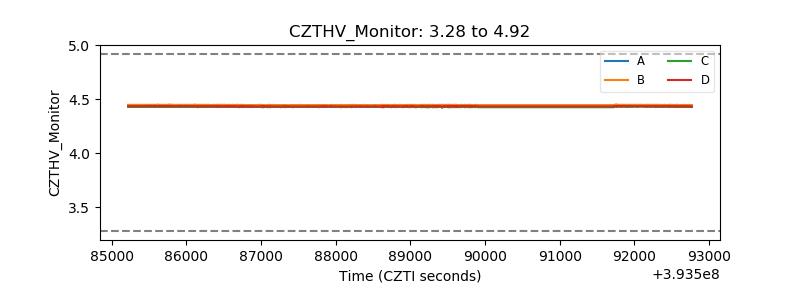 |
| D_VDD | 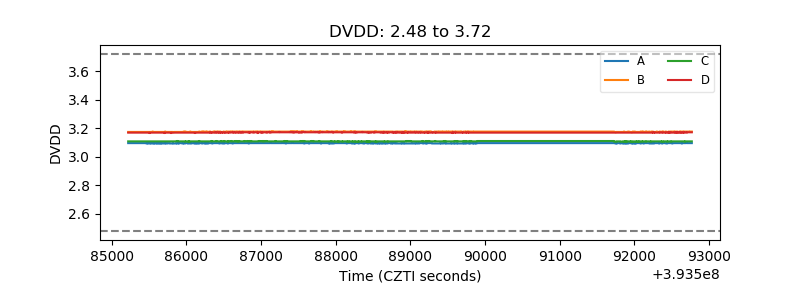 |
| Temperature 1 | 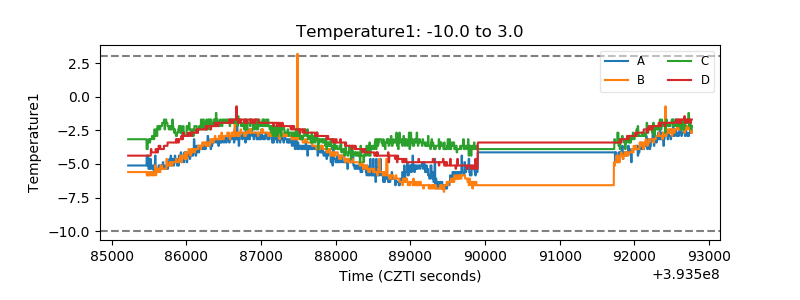 |
| Veto HV Monitor | 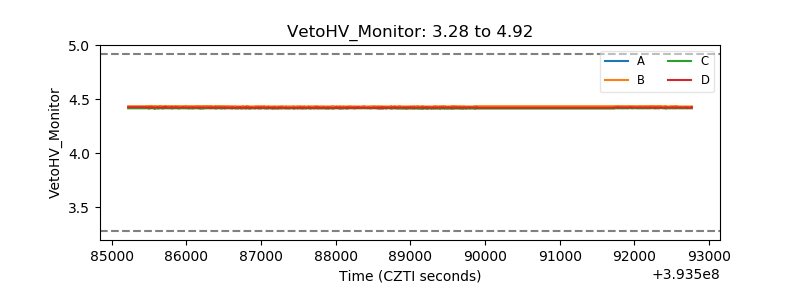 |
| Veto LLD | 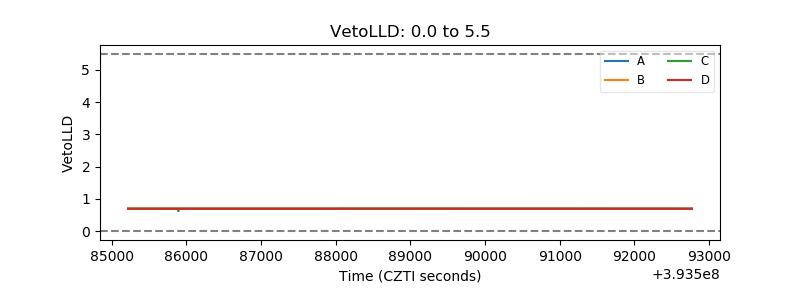 |
| Alpha Counter | 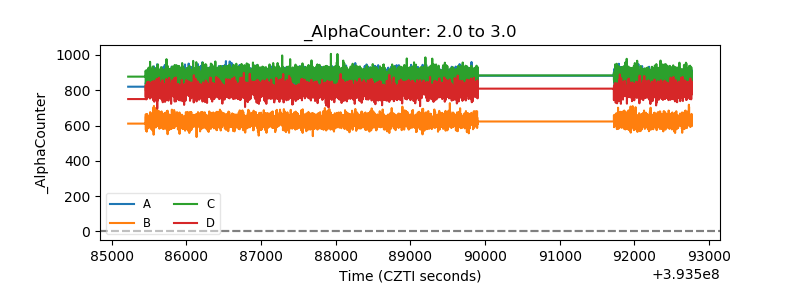 |
| _CPM_Rate | 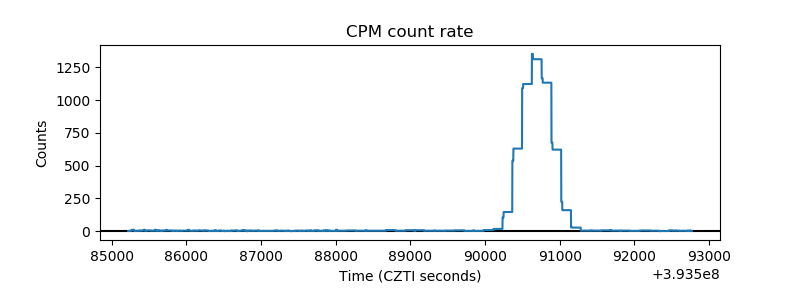 |
| CZT Counter | 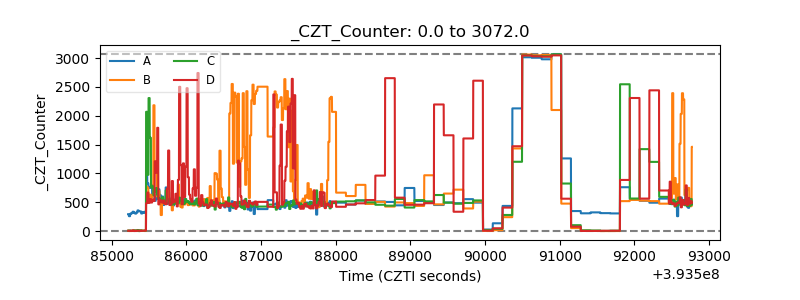 |
| +2.5 Volts monitor |  |
| +5 Volts monitor | 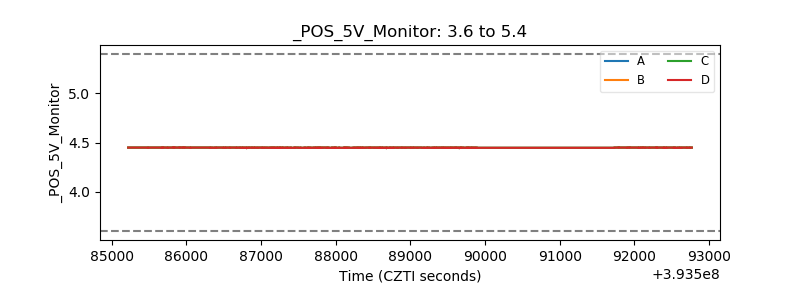 |
| _ROLL_ROT | 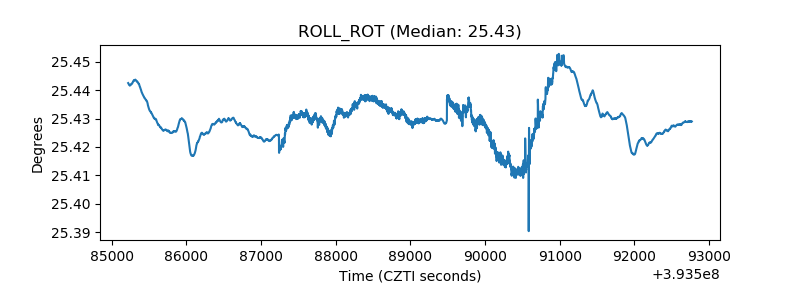 |
| _Roll_DEC | 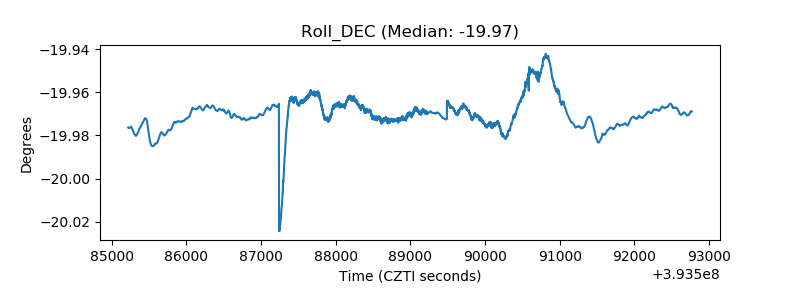 |
| _Roll_RA | 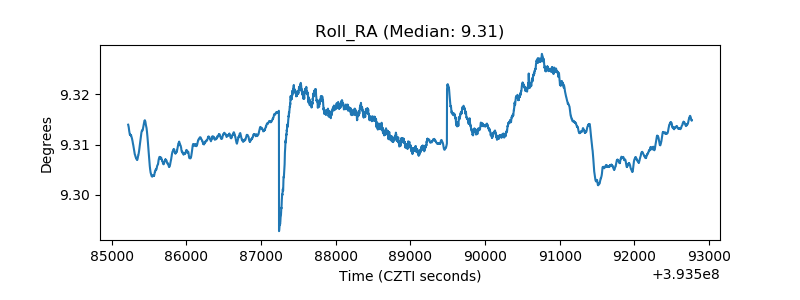 |
| Veto Counter |  |