| Param | Original file | Final file |
|---|---|---|
| Filename | modeM0/AS1T04_084T01_9000005198_36395cztM0_level2.evt | modeM0/AS1T04_084T01_9000005198_36395cztM0_level2_quad_clean.evt |
| Size (bytes) | 507,430,080 | 91,612,800 |
| Size | 483.9 MB | 87.4 MB |
| Events in quadrant A | 3,150,817 | 601,980 |
| Events in quadrant B | 4,292,429 | 598,609 |
| Events in quadrant C | 3,035,296 | 596,066 |
| Events in quadrant D | 4,485,336 | 561,810 |
| Mode M0 | |||
|---|---|---|---|
| Quadrant | BADHDUFLAG | Total packets | Discarded packets |
| A | 0 | 13148 | 3 |
| B | 0 | 16749 | 2 |
| C | 0 | 12461 | 2 |
| D | 0 | 17318 | 2 |
| Mode SS | |||
|---|---|---|---|
| Quadrant | BADHDUFLAG | Total packets | Discarded packets |
| A | 0 | 124 | 0 |
| B | 0 | 124 | 0 |
| C | 0 | 124 | 0 |
| D | 0 | 124 | 0 |
| Mode M9 | |||
|---|---|---|---|
| Quadrant | BADHDUFLAG | Total packets | Discarded packets |
| A | 0 | 35 | 0 |
| B | 0 | 35 | 0 |
| C | 0 | 35 | 0 |
| D | 0 | 35 | 0 |
| Quadrant | Total seconds | Saturated seconds | Saturation percentage |
|---|---|---|---|
| A | 5949 | 101 | 1.697764% |
| B | 5949 | 241 | 4.051101% |
| C | 5949 | 36 | 0.605144% |
| D | 5949 | 395 | 6.639771% |
Noise dominated data is calculated using 1-second bins in cleaned event files. If a bin has >2000 counts, and if more than 50% of those come from <1% of pixels, then it is considered to be noise-dominated and hence unusable.
| Quadrant | # 1 sec bins | Bins with >0 counts | Bins with >2000 counts | High rate bins dominated by noise | Noise dominated (total time) | Noise dominated (detector-on time) | Marked lightcurve |
|---|---|---|---|---|---|---|---|
| A | 9415 | 5951 | 35 | 35 | 0.37% | 0.59% | 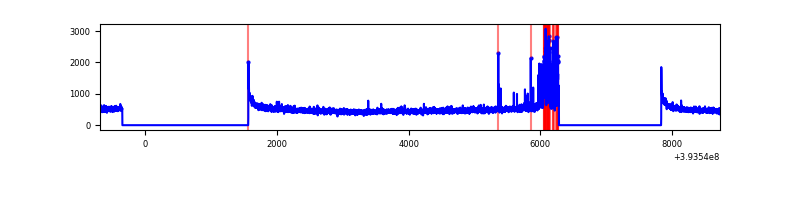 |
| B | 9415 | 5951 | 146 | 146 | 1.55% | 2.45% | 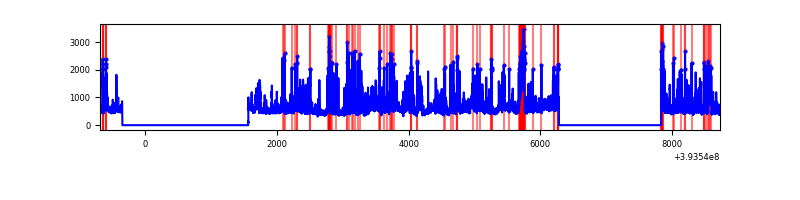 |
| C | 9415 | 5951 | 24 | 24 | 0.25% | 0.40% | 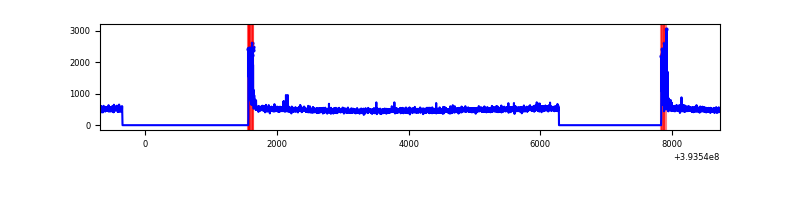 |
| D | 9415 | 5951 | 402 | 402 | 4.27% | 6.76% | 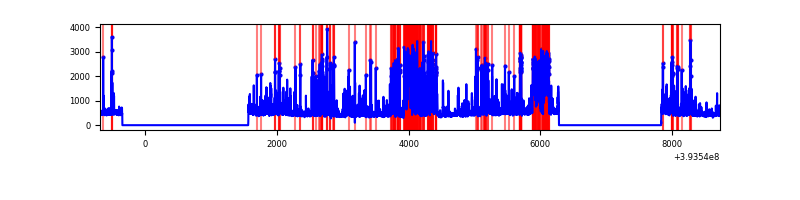 |
Top three noisy pixels from each quadrant. If the there are fewer than three noisy pixels in the level2.evt file, extra rows are filled as -1
| Pixel properties | Quadrant properties | ||||||
|---|---|---|---|---|---|---|---|
| Quadrant | DetID | PixID | Counts | Sigma | Mean | Median | Sigma |
| A | 15 | 223 | 298867 | 2152.31 | 684 | 670 | 138.5 |
| A | 10 | 83 | 190618 | 1371.0 | 684 | 670 | 138.5 |
| A | 13 | 254 | 9950 | 66.98 | 684 | 670 | 138.5 |
| B | 5 | 172 | 539201 | 4103.99 | 676 | 659 | 131.2 |
| B | 5 | 255 | 381390 | 2901.39 | 676 | 659 | 131.2 |
| B | 4 | 171 | 169553 | 1287.07 | 676 | 659 | 131.2 |
| C | 15 | 214 | 252770 | 1605.7 | 674 | 682 | 157.0 |
| C | 0 | 10 | 146766 | 930.5 | 674 | 682 | 157.0 |
| C | 0 | 207 | 5965 | 33.65 | 674 | 682 | 157.0 |
| D | 12 | 6 | 1164211 | 7169.91 | 661 | 646 | 162.3 |
| D | 12 | 227 | 403262 | 2480.93 | 661 | 646 | 162.3 |
| D | 2 | 249 | 123852 | 759.2 | 661 | 646 | 162.3 |
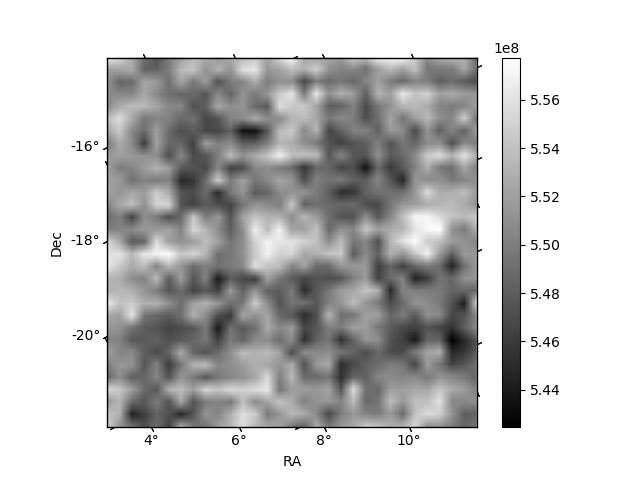
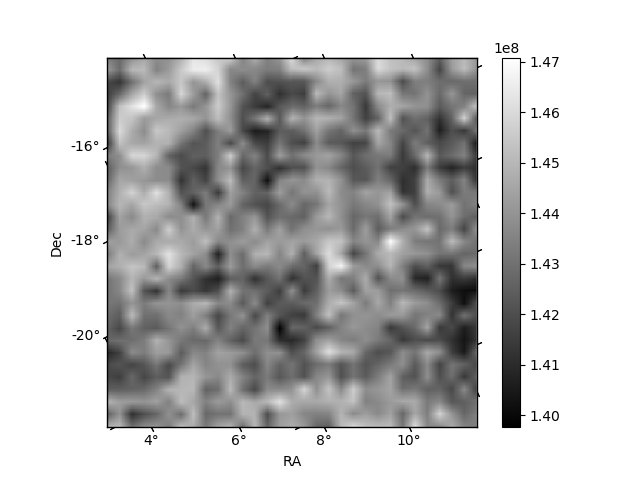
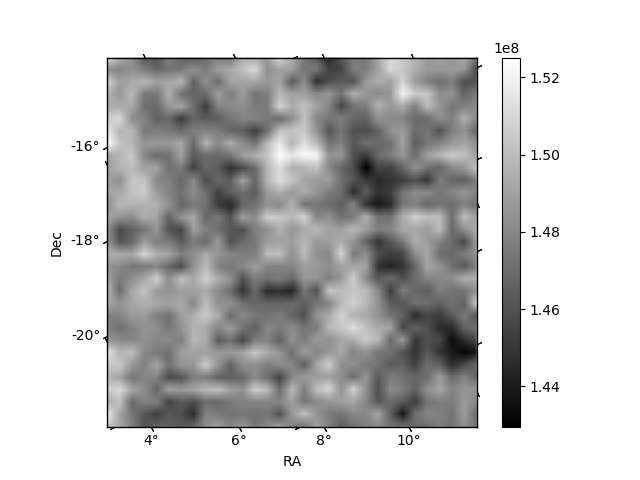
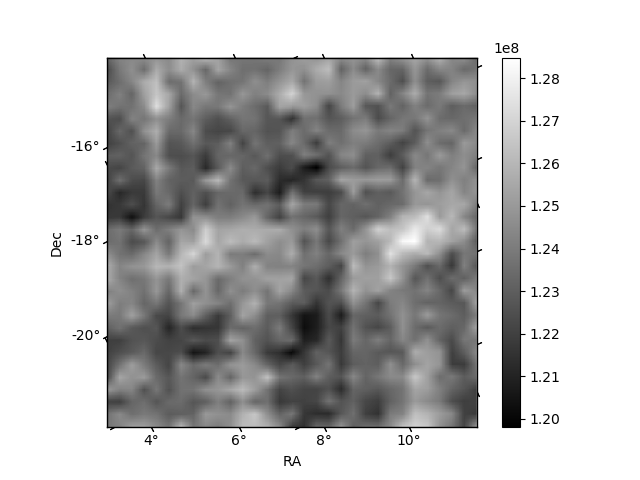
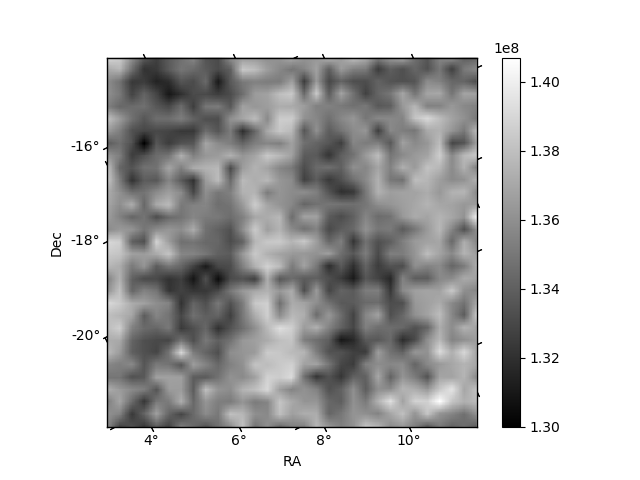
Histogram calculated using DETX and DETY for each event in the final _common_clean file
| Quadrant A | 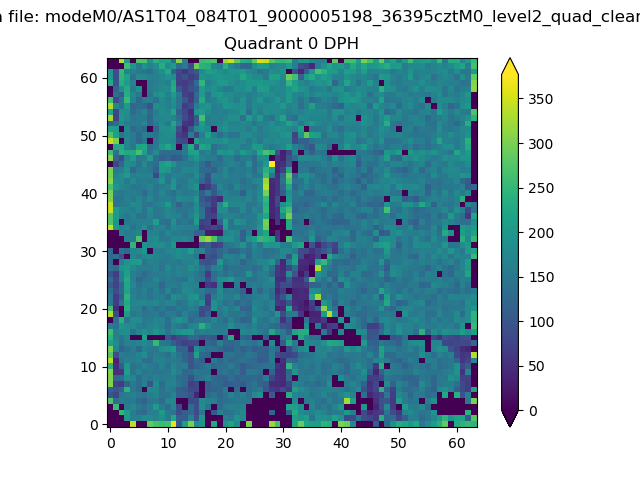 |
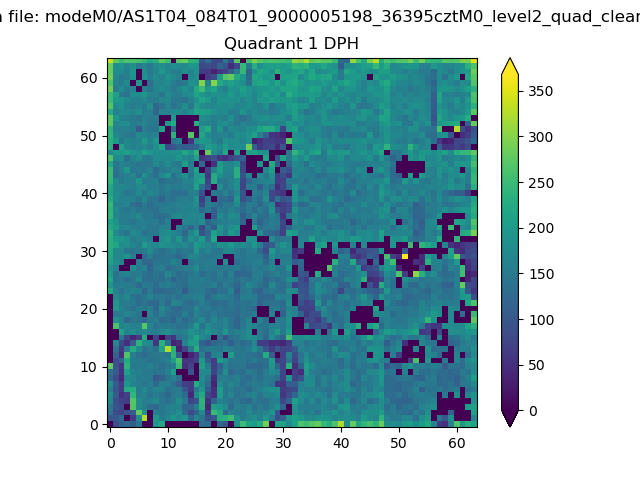 |
Quadrant B |
|---|---|---|---|
| Quadrant D | 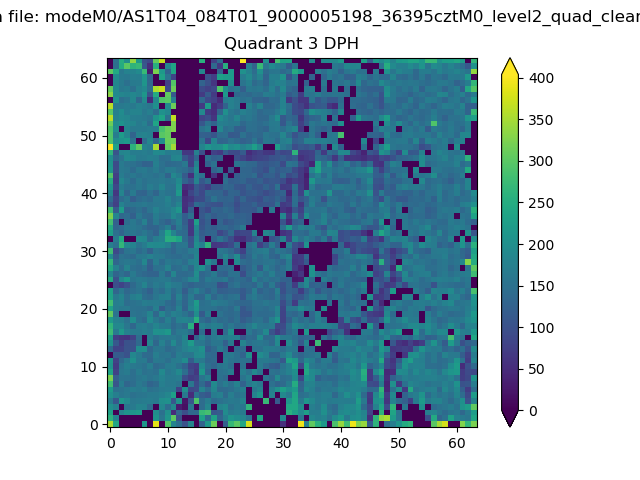 |
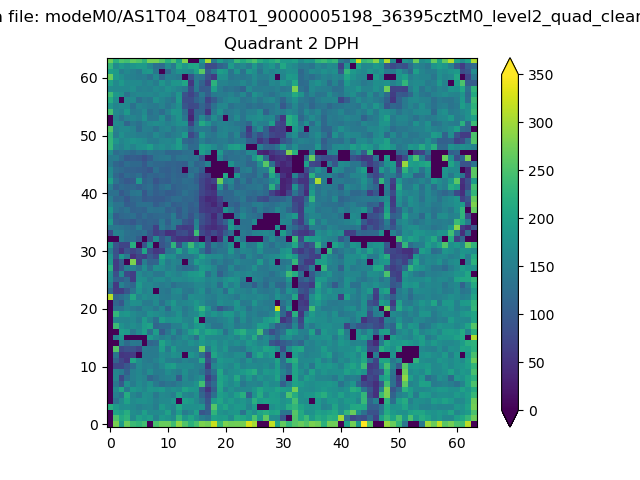 |
Quadrant C |
| Plot type | Count rate plots | Images |
|---|---|---|
| Comparison with Poisson distribution Blue bars denote a histogram of data divided into 1 sec bins. Red curve is a Poisson curve with rate = median count rate of data. |
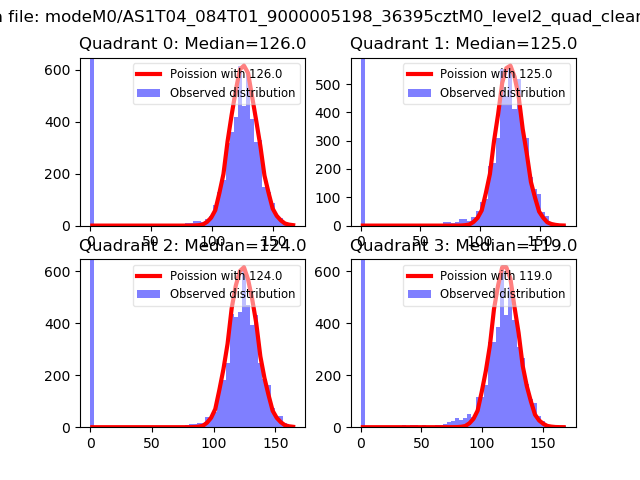 |
 |
| Quadrant-wise count rates Data is divided into 100 sec bins |
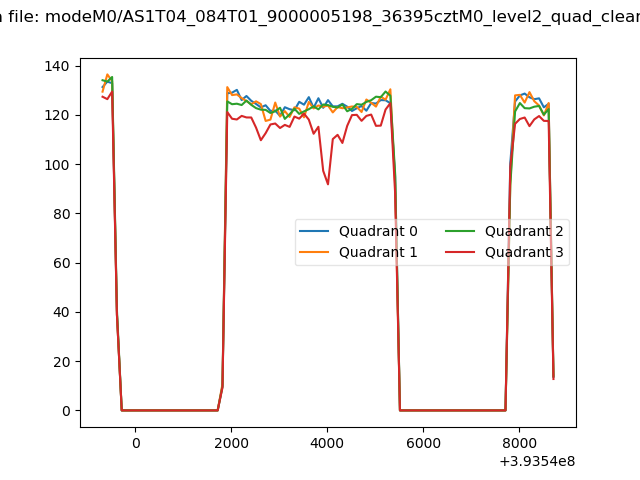 |
|
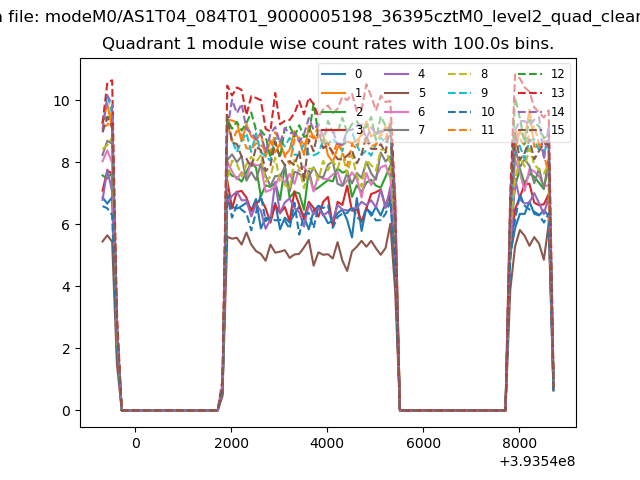
| Module-wise count rates for Quadrant A Data is divided into 100 sec bins |
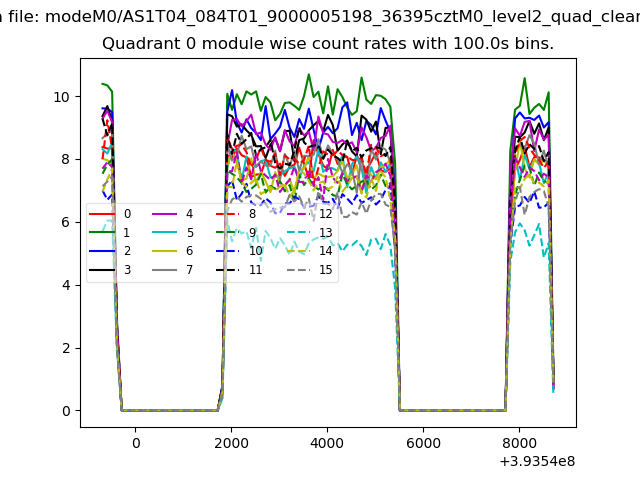 |
 |
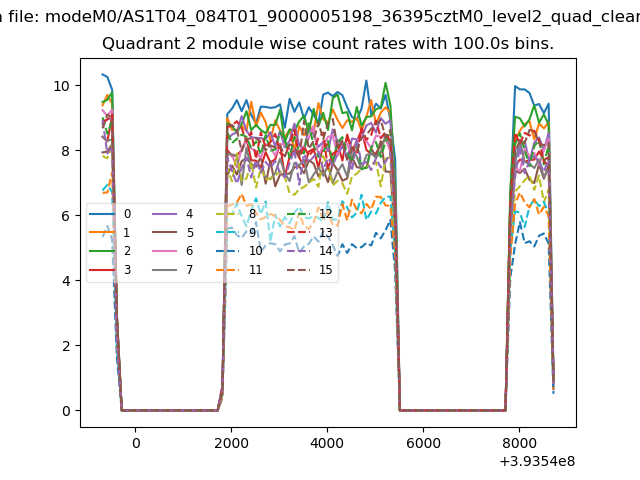
| Module-wise count rates for Quadrant B Data is divided into 100 sec bins |
 |
 |
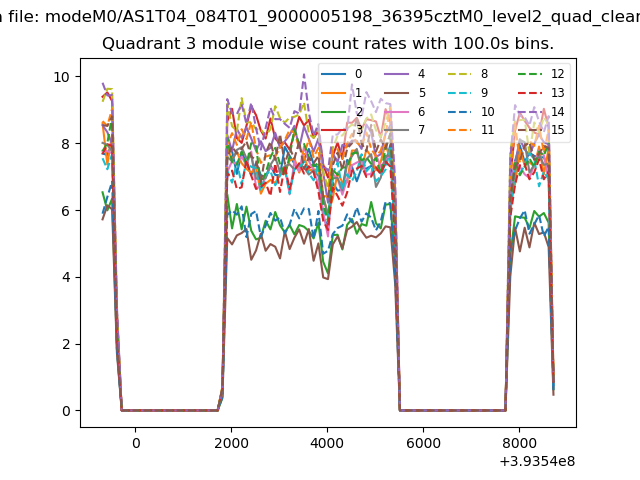
| Module-wise count rates for Quadrant C Data is divided into 100 sec bins |
 |
 |
| Module-wise count rates for Quadrant D Data is divided into 100 sec bins |
 |
 |
| Parameter | Plot |
|---|---|
| CZT HV Monitor | 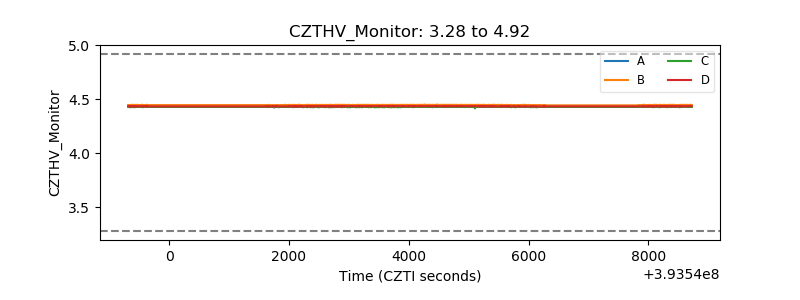 |
| D_VDD | 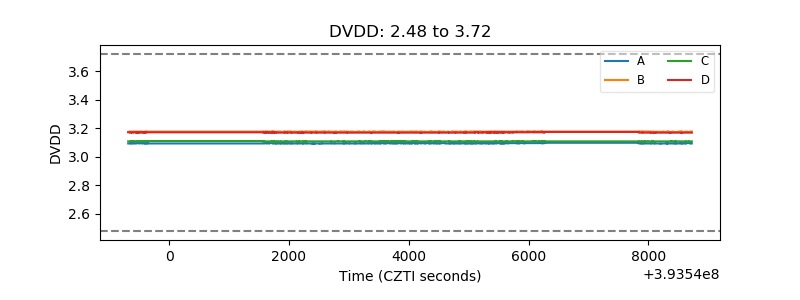 |
| Temperature 1 | 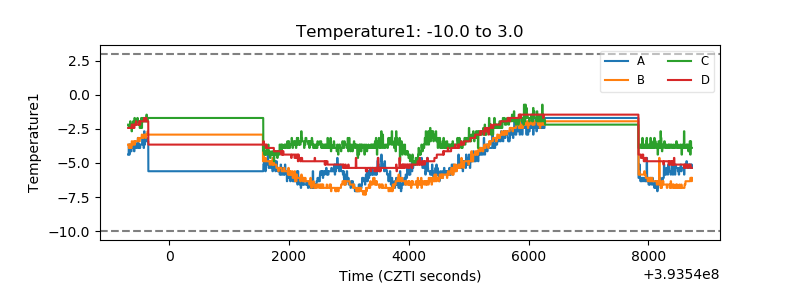 |
| Veto HV Monitor | 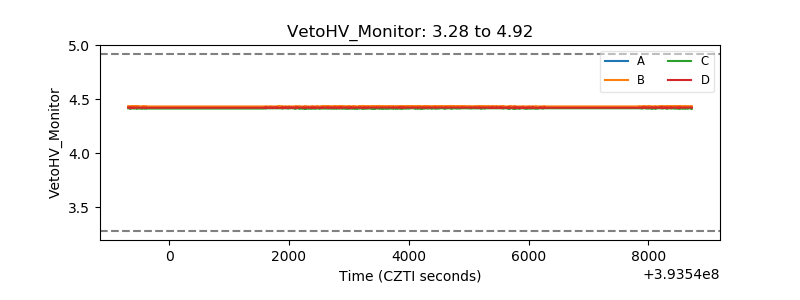 |
| Veto LLD | 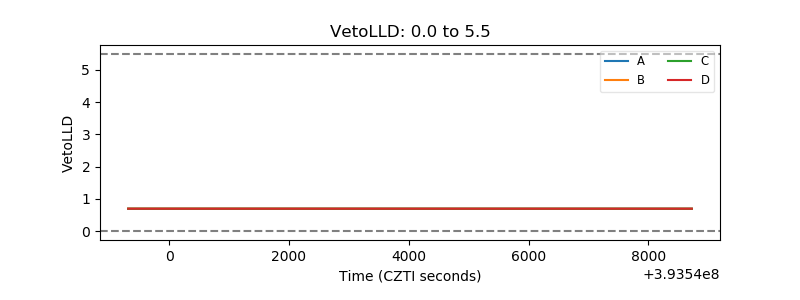 |
| Alpha Counter | 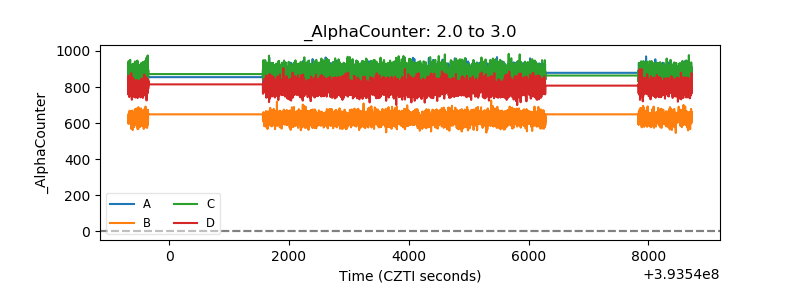 |
| _CPM_Rate | 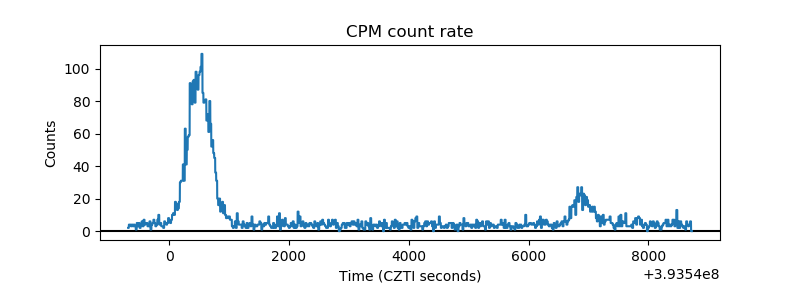 |
| CZT Counter | 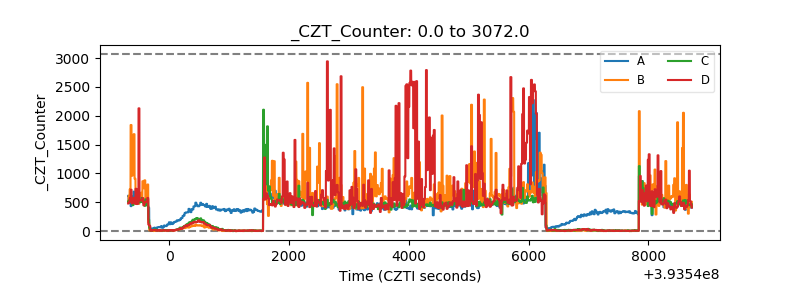 |
| +2.5 Volts monitor | 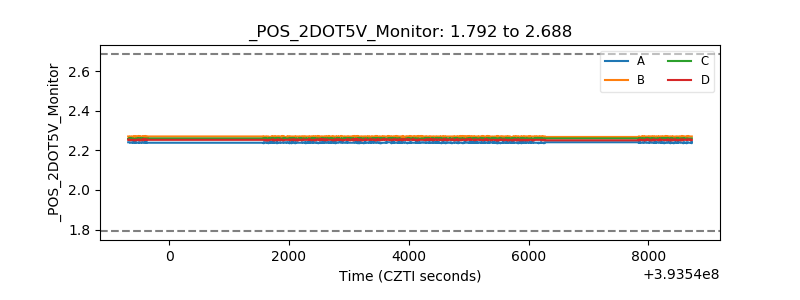 |
| +5 Volts monitor | 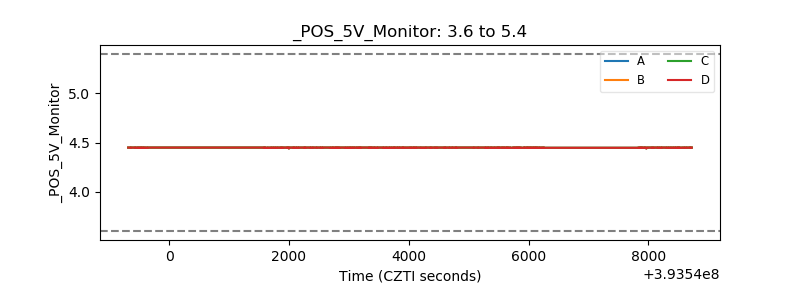 |
| _ROLL_ROT | 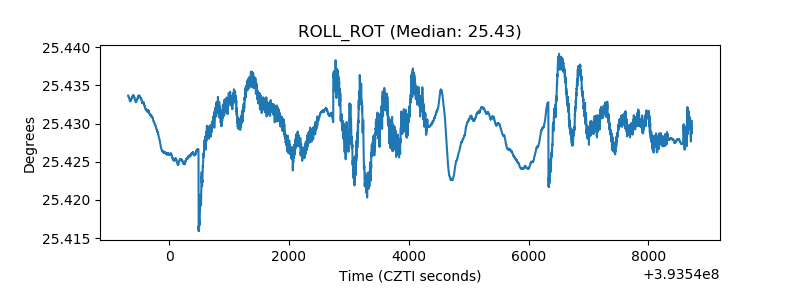 |
| _Roll_DEC | 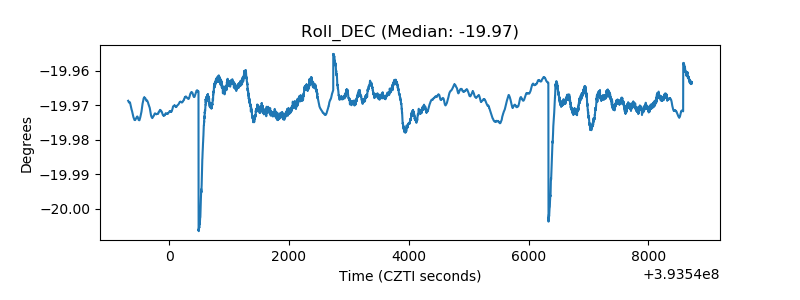 |
| _Roll_RA | 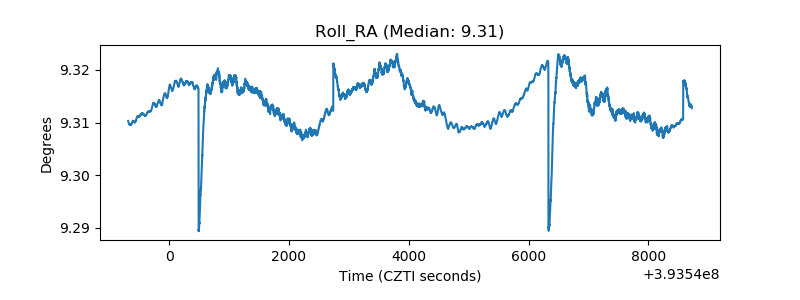 |
| Veto Counter | 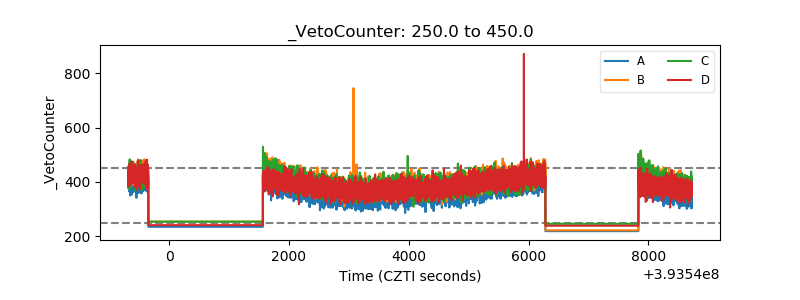 |