| Param | Original file | Final file |
|---|---|---|
| Filename | modeM0/AS1T04_084T01_9000005198_36392cztM0_level2.evt | modeM0/AS1T04_084T01_9000005198_36392cztM0_level2_quad_clean.evt |
| Size (bytes) | 438,912,000 | 57,360,960 |
| Size | 418.6 MB | 54.7 MB |
| Events in quadrant A | 2,740,537 | 362,224 |
| Events in quadrant B | 4,051,782 | 339,779 |
| Events in quadrant C | 2,793,569 | 353,016 |
| Events in quadrant D | 3,368,751 | 332,340 |
| Mode M0 | |||
|---|---|---|---|
| Quadrant | BADHDUFLAG | Total packets | Discarded packets |
| A | 0 | 11136 | 3 |
| B | 0 | 15319 | 2 |
| C | 0 | 10935 | 2 |
| D | 0 | 13087 | 2 |
| Mode SS | |||
|---|---|---|---|
| Quadrant | BADHDUFLAG | Total packets | Discarded packets |
| A | 0 | 100 | 0 |
| B | 0 | 100 | 0 |
| C | 0 | 100 | 0 |
| D | 0 | 100 | 0 |
| Mode M9 | |||
|---|---|---|---|
| Quadrant | BADHDUFLAG | Total packets | Discarded packets |
| A | 0 | 31 | 0 |
| B | 0 | 31 | 0 |
| C | 0 | 31 | 0 |
| D | 0 | 32 | 0 |
| Quadrant | Total seconds | Saturated seconds | Saturation percentage |
|---|---|---|---|
| A | 4982 | 15 | 0.301084% |
| B | 4982 | 361 | 7.246086% |
| C | 4982 | 61 | 1.224408% |
| D | 4982 | 172 | 3.452429% |
Noise dominated data is calculated using 1-second bins in cleaned event files. If a bin has >2000 counts, and if more than 50% of those come from <1% of pixels, then it is considered to be noise-dominated and hence unusable.
| Quadrant | # 1 sec bins | Bins with >0 counts | Bins with >2000 counts | High rate bins dominated by noise | Noise dominated (total time) | Noise dominated (detector-on time) | Marked lightcurve |
|---|---|---|---|---|---|---|---|
| A | 7104 | 4983 | 1 | 1 | 0.01% | 0.02% | 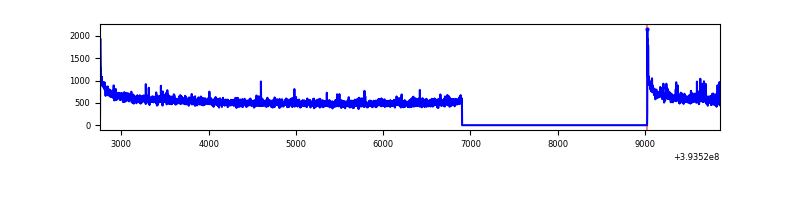 |
| B | 7104 | 4983 | 273 | 273 | 3.84% | 5.48% | 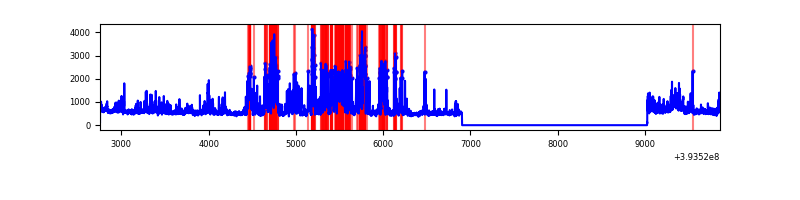 |
| C | 7104 | 4983 | 43 | 43 | 0.61% | 0.86% | 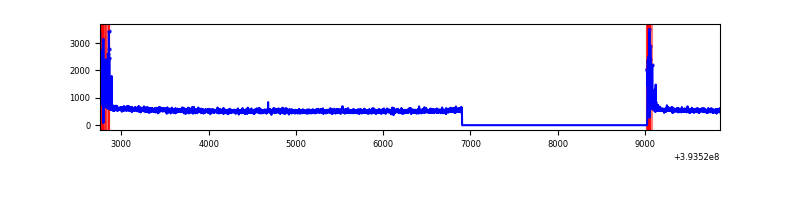 |
| D | 7104 | 4983 | 152 | 152 | 2.14% | 3.05% | 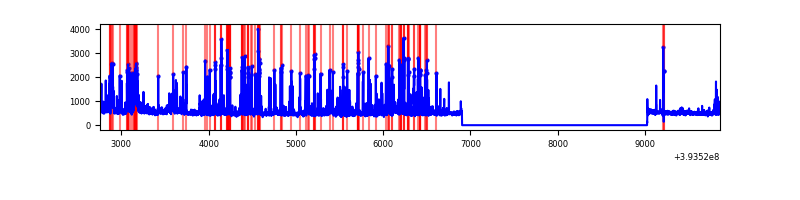 |
Top three noisy pixels from each quadrant. If the there are fewer than three noisy pixels in the level2.evt file, extra rows are filled as -1
| Pixel properties | Quadrant properties | ||||||
|---|---|---|---|---|---|---|---|
| Quadrant | DetID | PixID | Counts | Sigma | Mean | Median | Sigma |
| A | 10 | 83 | 183733 | 1425.21 | 642 | 632 | 128.5 |
| A | 15 | 223 | 59724 | 459.96 | 642 | 632 | 128.5 |
| A | 13 | 254 | 8936 | 64.64 | 642 | 632 | 128.5 |
| B | 5 | 172 | 1191589 | 10080.4 | 622 | 609 | 118.1 |
| B | 0 | 189 | 141760 | 1194.7 | 622 | 609 | 118.1 |
| B | 4 | 171 | 79572 | 668.34 | 622 | 609 | 118.1 |
| C | 15 | 214 | 216257 | 1525.42 | 615 | 622 | 141.4 |
| C | 0 | 10 | 177652 | 1252.32 | 615 | 622 | 141.4 |
| C | 13 | 61 | 4052 | 24.26 | 615 | 622 | 141.4 |
| D | 12 | 6 | 326935 | 2210.85 | 613 | 598 | 147.6 |
| D | 2 | 249 | 253664 | 1714.45 | 613 | 598 | 147.6 |
| D | 13 | 249 | 105148 | 708.3 | 613 | 598 | 147.6 |
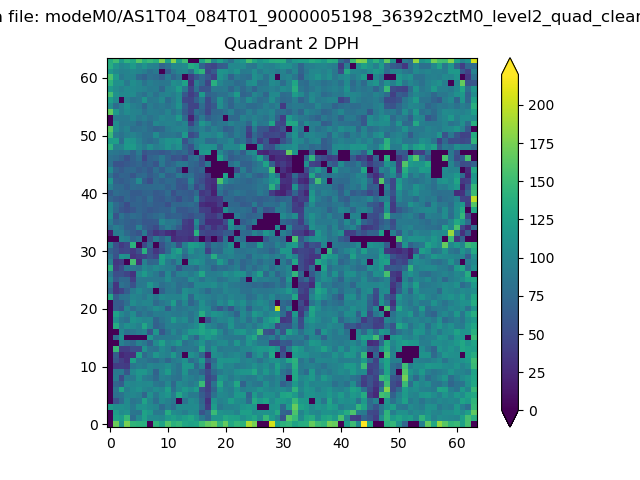
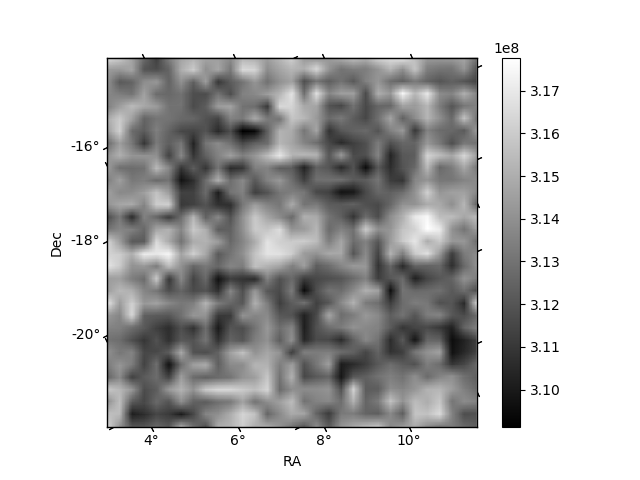
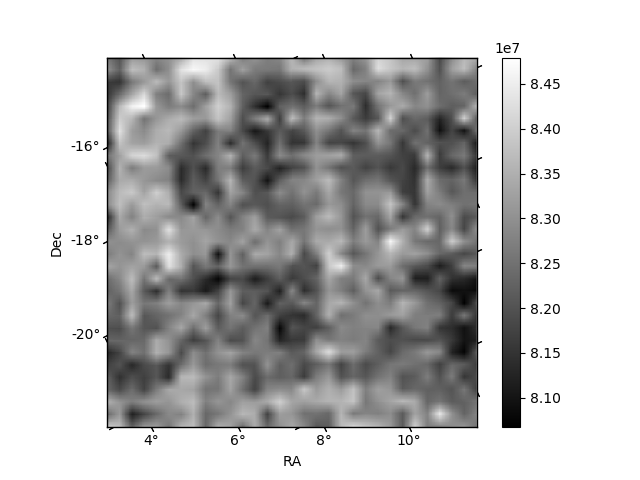
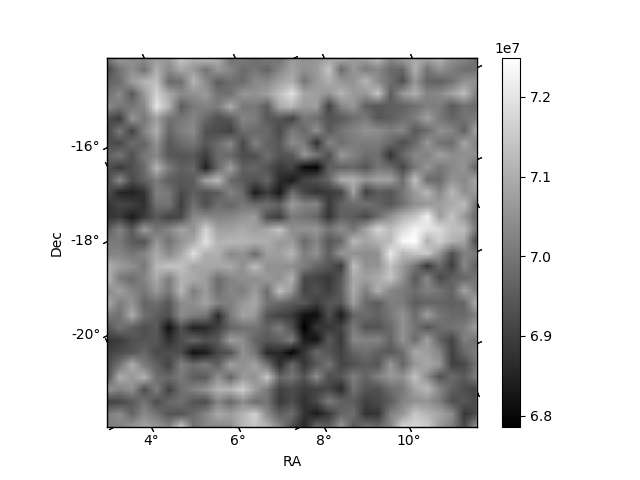
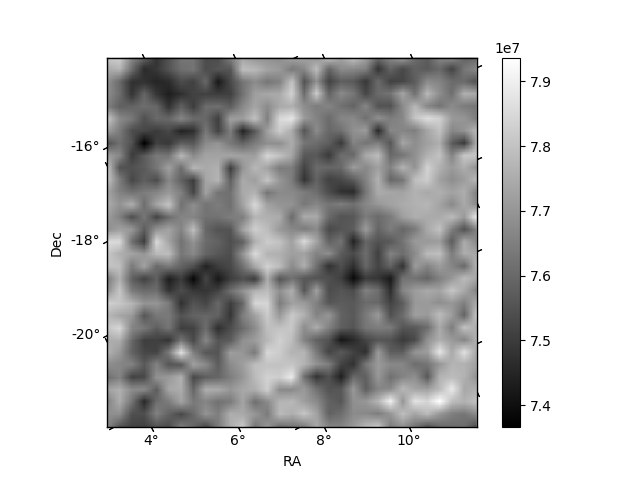
Histogram calculated using DETX and DETY for each event in the final _common_clean file
| Quadrant A | 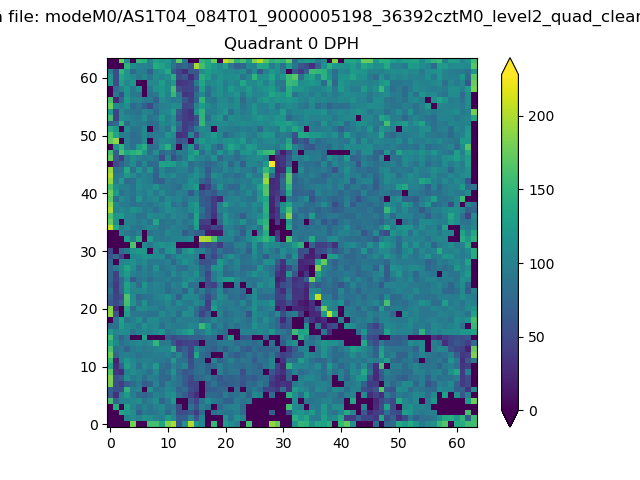 |
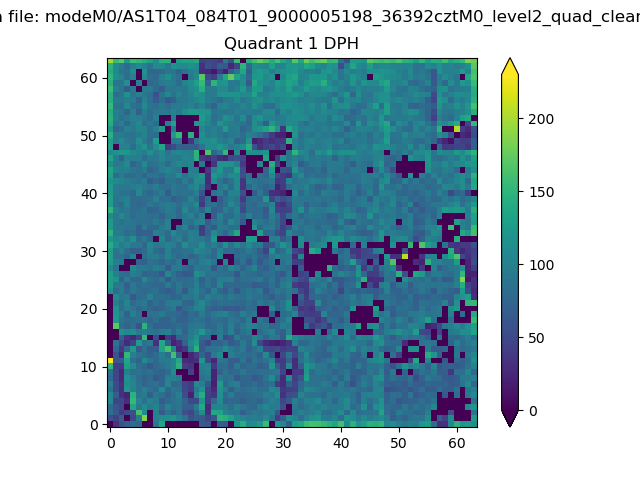 |
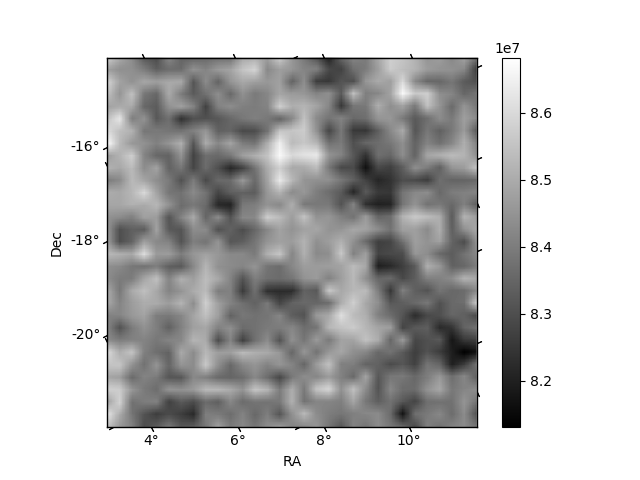
Quadrant B |
|---|---|---|---|
| Quadrant D | 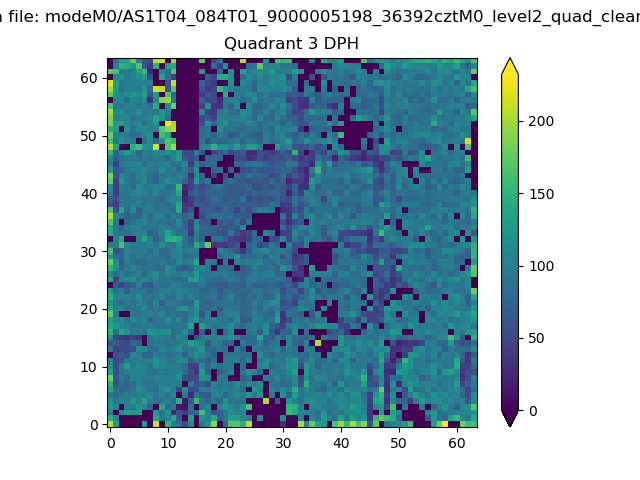 |
 |
Quadrant C |
| Plot type | Count rate plots | Images |
|---|---|---|
| Comparison with Poisson distribution Blue bars denote a histogram of data divided into 1 sec bins. Red curve is a Poisson curve with rate = median count rate of data. |
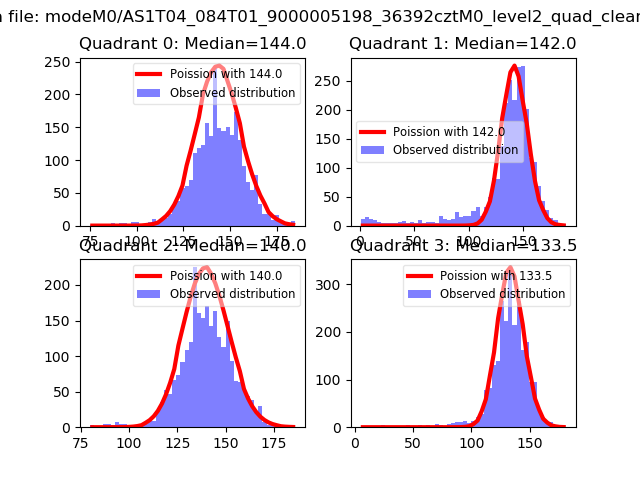 |
 |
| Quadrant-wise count rates Data is divided into 100 sec bins |
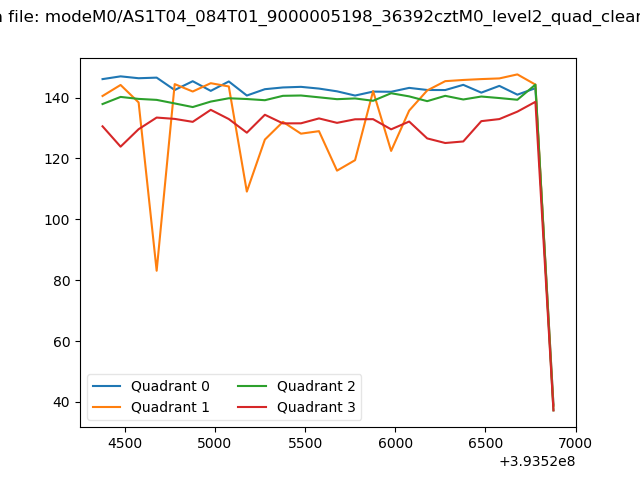 |
|
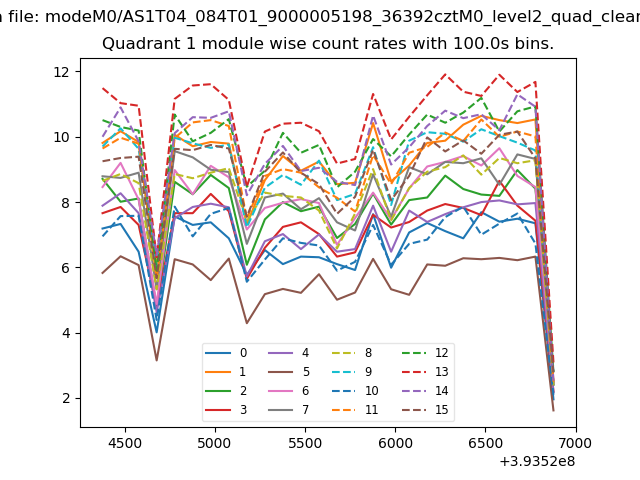
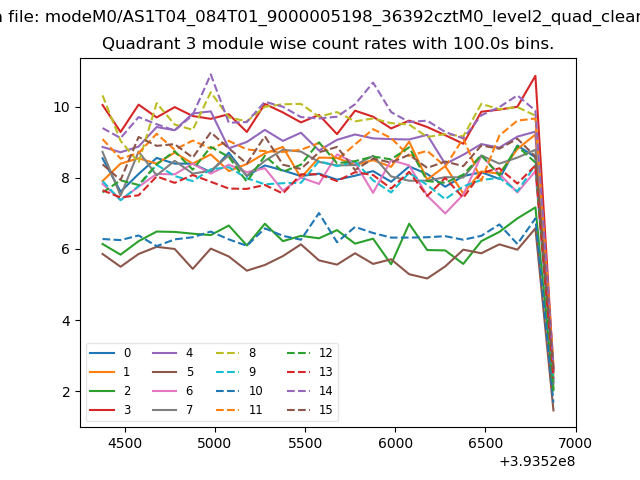
| Module-wise count rates for Quadrant A Data is divided into 100 sec bins |
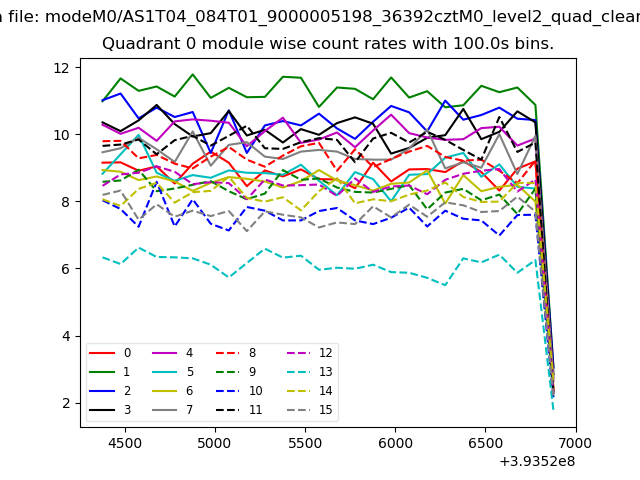 |
 |
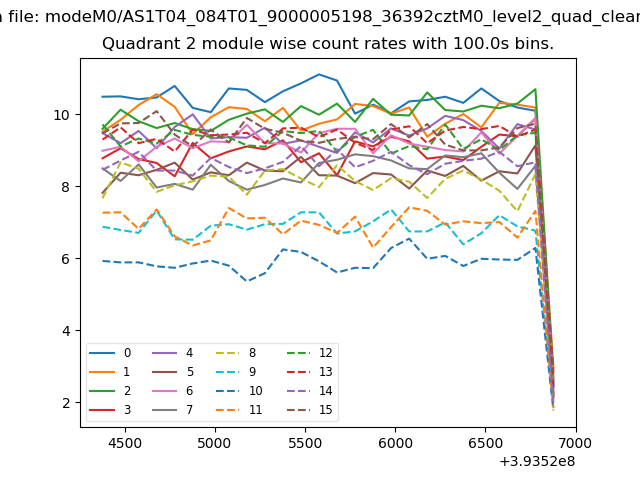
| Module-wise count rates for Quadrant B Data is divided into 100 sec bins |
 |
 |
| Module-wise count rates for Quadrant C Data is divided into 100 sec bins |
 |
 |
| Module-wise count rates for Quadrant D Data is divided into 100 sec bins |
 |
 |
| Parameter | Plot |
|---|---|
| CZT HV Monitor | 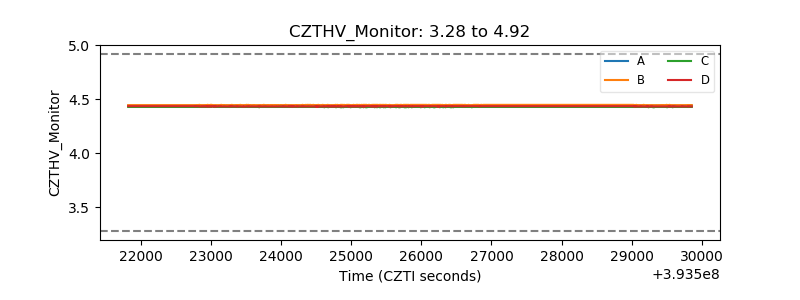 |
| D_VDD | 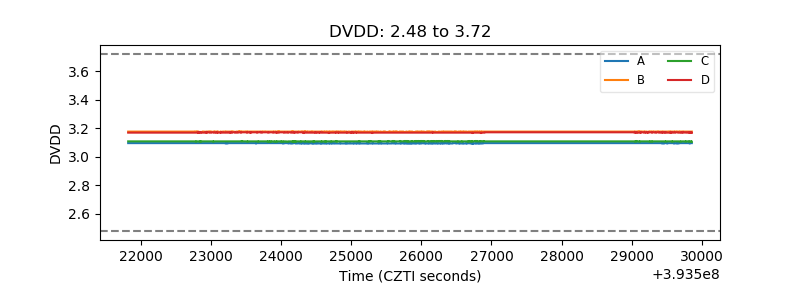 |
| Temperature 1 | 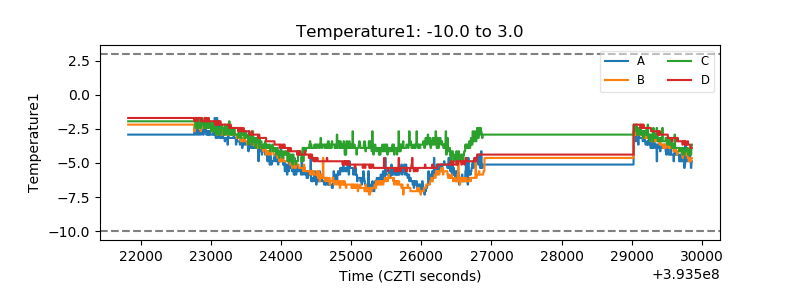 |
| Veto HV Monitor | 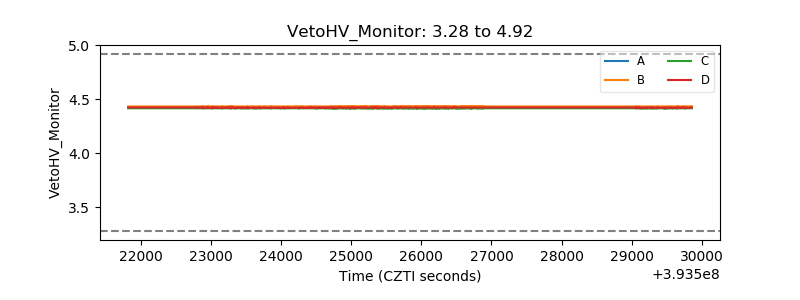 |
| Veto LLD | 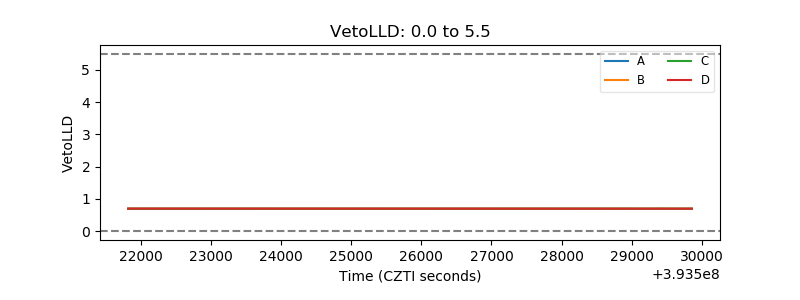 |
| Alpha Counter | 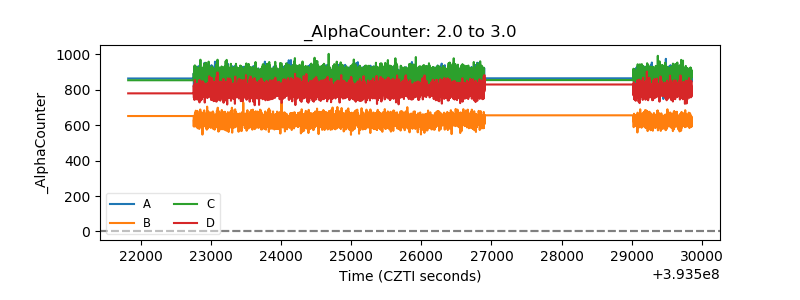 |
| _CPM_Rate | 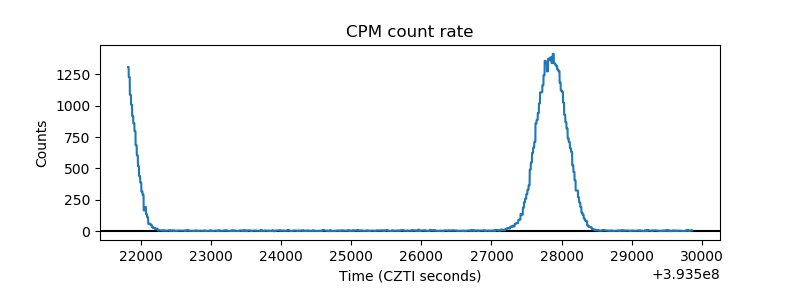 |
| CZT Counter | 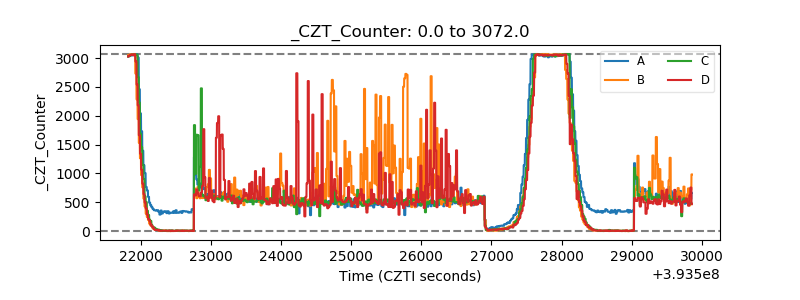 |
| +2.5 Volts monitor | 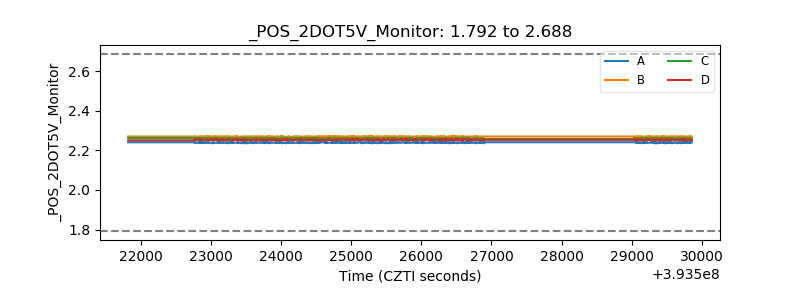 |
| +5 Volts monitor | 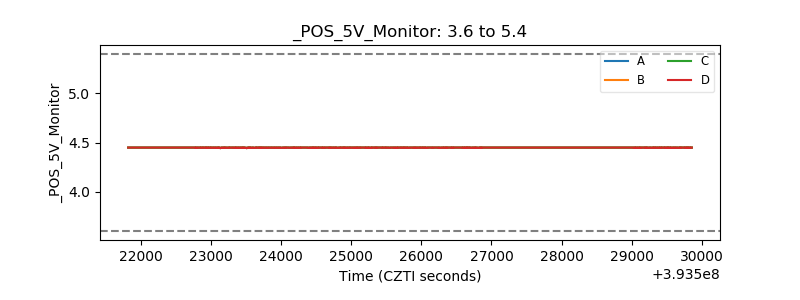 |
| _ROLL_ROT | 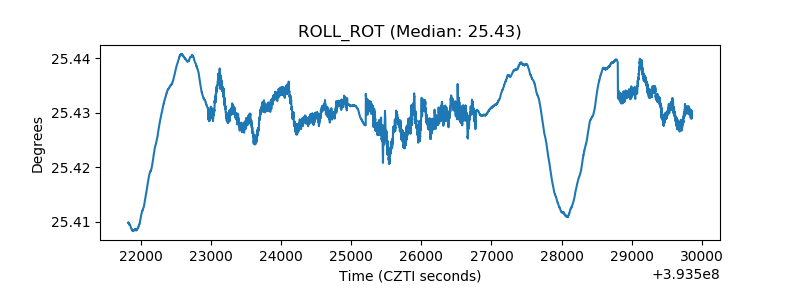 |
| _Roll_DEC | 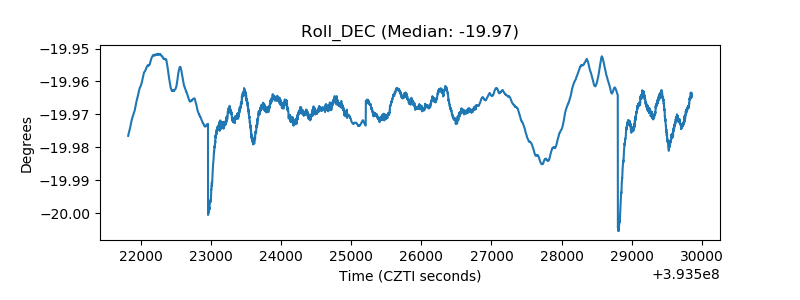 |
| _Roll_RA | 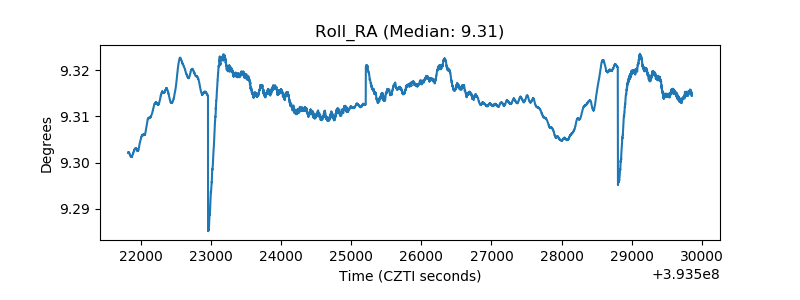 |
| Veto Counter | 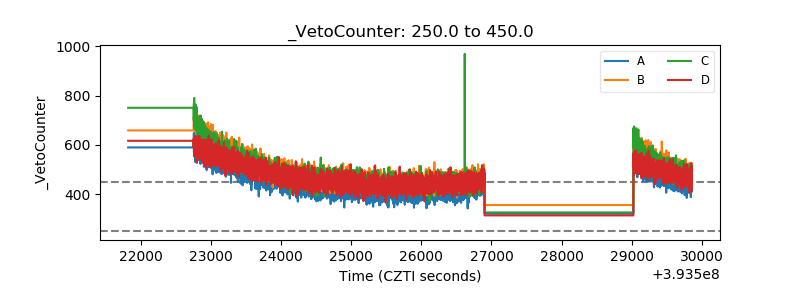 |