| Param | Original file | Final file |
|---|---|---|
| Filename | modeM0/AS1A11_097T24_9000005196_36390cztM0_level2.evt | modeM0/AS1A11_097T24_9000005196_36390cztM0_level2_quad_clean.evt |
| Size (bytes) | 198,175,680 | 16,067,520 |
| Size | 189.0 MB | 15.3 MB |
| Events in quadrant A | 1,342,380 | 81,517 |
| Events in quadrant B | 1,376,669 | 80,271 |
| Events in quadrant C | 1,385,378 | 75,998 |
| Events in quadrant D | 1,730,605 | 73,421 |
| Mode SS | |||
|---|---|---|---|
| Quadrant | BADHDUFLAG | Total packets | Discarded packets |
| A | 0 | 50 | 0 |
| B | 0 | 50 | 0 |
| C | 0 | 50 | 0 |
| D | 0 | 50 | 0 |
| Mode M9 | |||
|---|---|---|---|
| Quadrant | BADHDUFLAG | Total packets | Discarded packets |
| A | 0 | 13 | 0 |
| B | 0 | 13 | 0 |
| C | 0 | 13 | 0 |
| D | 0 | 14 | 0 |
| Mode M0 | |||
|---|---|---|---|
| Quadrant | BADHDUFLAG | Total packets | Discarded packets |
| A | 0 | 5359 | 1 |
| B | 0 | 5498 | 1 |
| C | 0 | 5424 | 1 |
| D | 0 | 6681 | 1 |
| Quadrant | Total seconds | Saturated seconds | Saturation percentage |
|---|---|---|---|
| A | 2420 | 6 | 0.247934% |
| B | 2420 | 22 | 0.909091% |
| C | 2420 | 33 | 1.363636% |
| D | 2420 | 73 | 3.016529% |
Noise dominated data is calculated using 1-second bins in cleaned event files. If a bin has >2000 counts, and if more than 50% of those come from <1% of pixels, then it is considered to be noise-dominated and hence unusable.
| Quadrant | # 1 sec bins | Bins with >0 counts | Bins with >2000 counts | High rate bins dominated by noise | Noise dominated (total time) | Noise dominated (detector-on time) | Marked lightcurve |
|---|---|---|---|---|---|---|---|
| A | 2420 | 2420 | 0 | 0 | 0.00% | 0.00% | 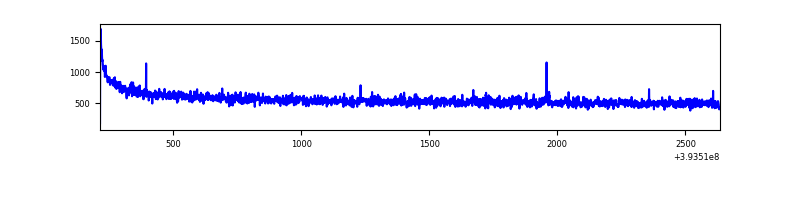 |
| B | 2420 | 2420 | 9 | 9 | 0.37% | 0.37% | 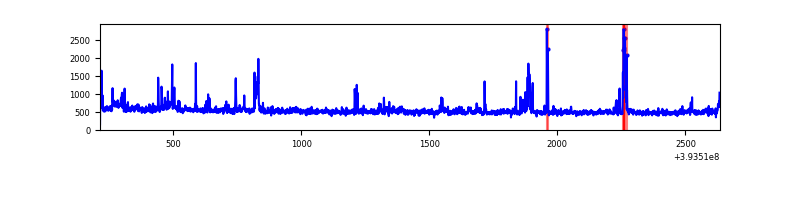 |
| C | 2420 | 2420 | 21 | 21 | 0.87% | 0.87% | 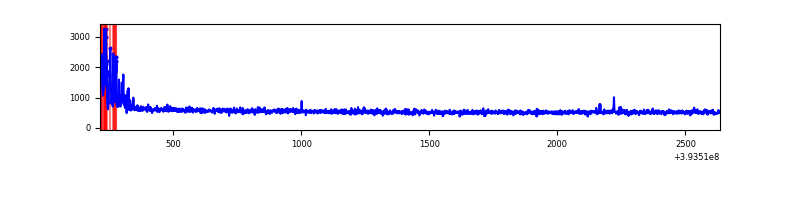 |
| D | 2420 | 2420 | 69 | 69 | 2.85% | 2.85% | 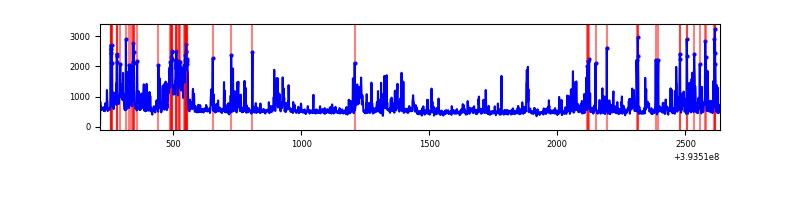 |
Top three noisy pixels from each quadrant. If the there are fewer than three noisy pixels in the level2.evt file, extra rows are filled as -1
| Pixel properties | Quadrant properties | ||||||
|---|---|---|---|---|---|---|---|
| Quadrant | DetID | PixID | Counts | Sigma | Mean | Median | Sigma |
| A | 10 | 83 | 90428 | 1386.57 | 321 | 316 | 65.0 |
| A | 13 | 254 | 4076 | 57.86 | 321 | 316 | 65.0 |
| A | 13 | 6 | 3945 | 55.84 | 321 | 316 | 65.0 |
| B | 5 | 172 | 76621 | 1270.42 | 312 | 306 | 60.1 |
| B | 15 | 85 | 36279 | 598.84 | 312 | 306 | 60.1 |
| B | 0 | 189 | 29743 | 490.04 | 312 | 306 | 60.1 |
| C | 15 | 214 | 105100 | 1487.0 | 302 | 304 | 70.5 |
| C | 0 | 10 | 93569 | 1323.39 | 302 | 304 | 70.5 |
| C | 0 | 207 | 4686 | 62.18 | 302 | 304 | 70.5 |
| D | 12 | 6 | 238288 | 3148.23 | 306 | 298 | 75.6 |
| D | 12 | 227 | 145532 | 1921.21 | 306 | 298 | 75.6 |
| D | 2 | 250 | 47098 | 619.09 | 306 | 298 | 75.6 |
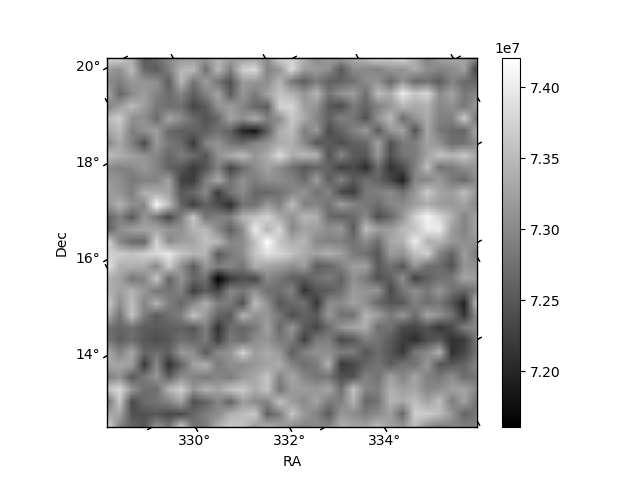
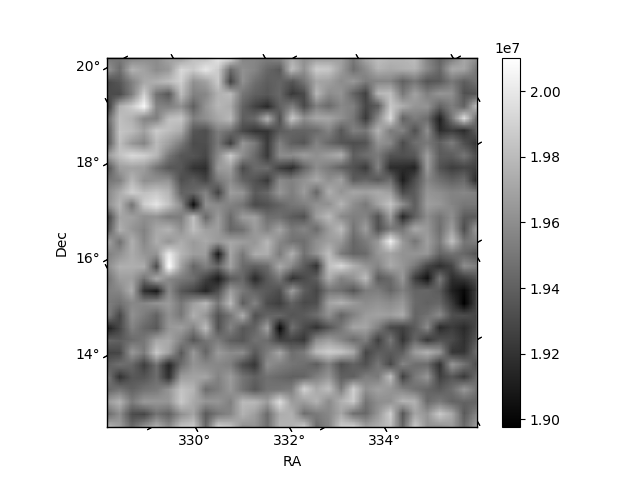
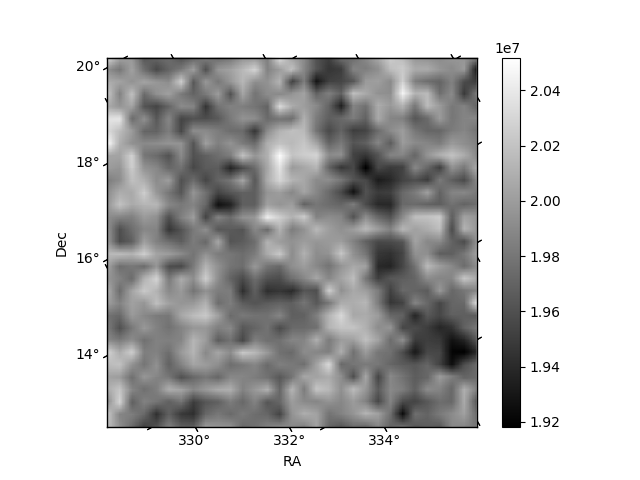
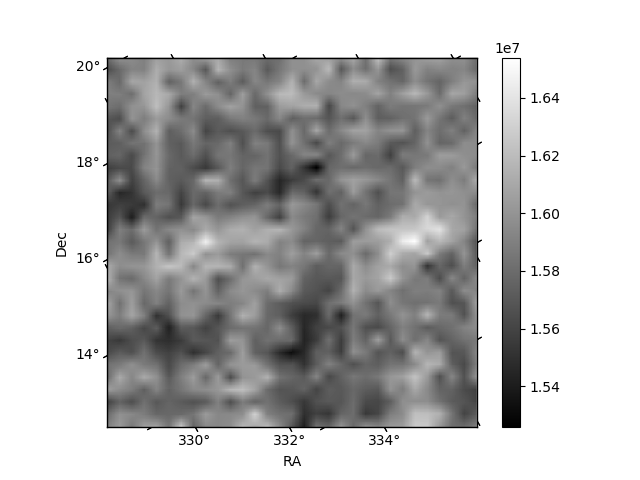
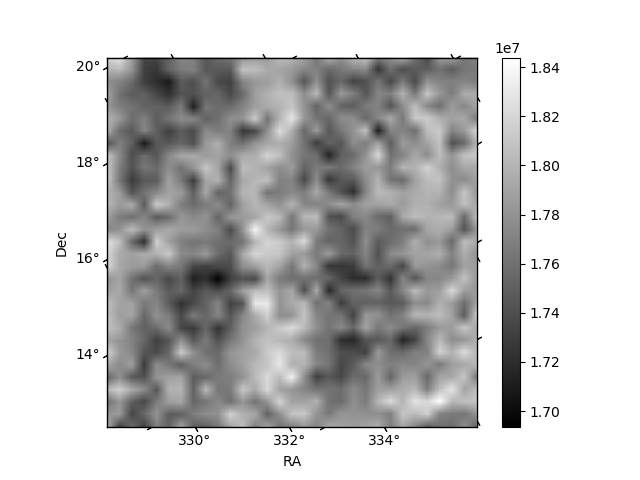
Histogram calculated using DETX and DETY for each event in the final _common_clean file
| Quadrant A | 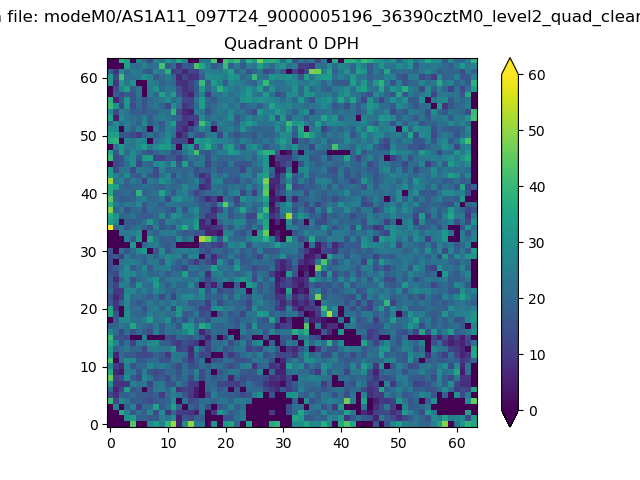 |
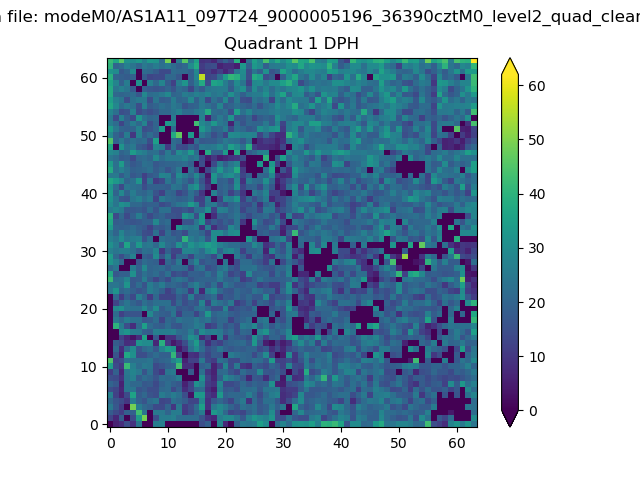 |
Quadrant B |
|---|---|---|---|
| Quadrant D | 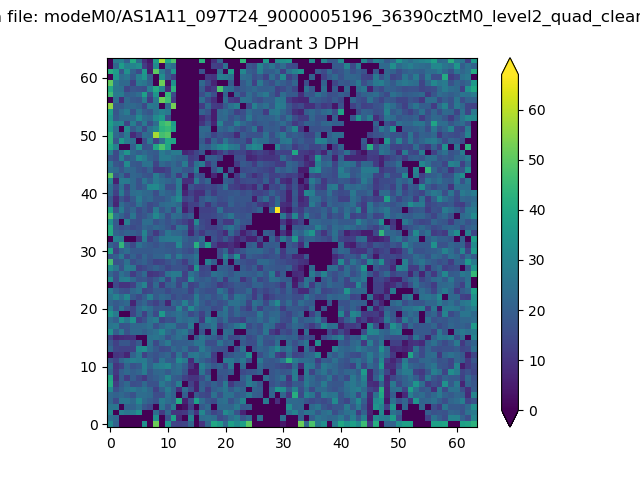 |
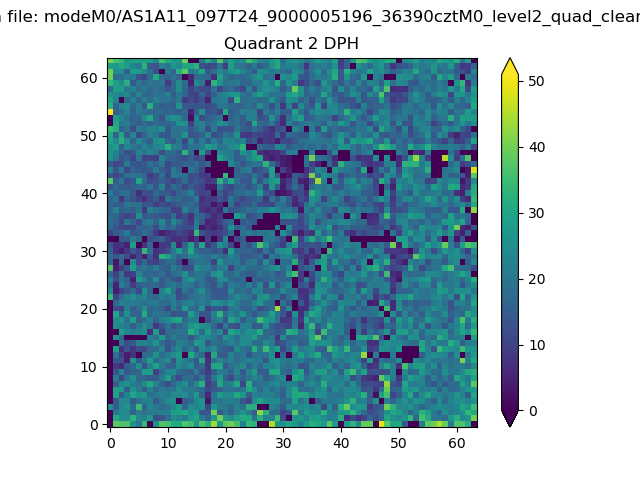 |
Quadrant C |
| Plot type | Count rate plots | Images |
|---|---|---|
| Comparison with Poisson distribution Blue bars denote a histogram of data divided into 1 sec bins. Red curve is a Poisson curve with rate = median count rate of data. |
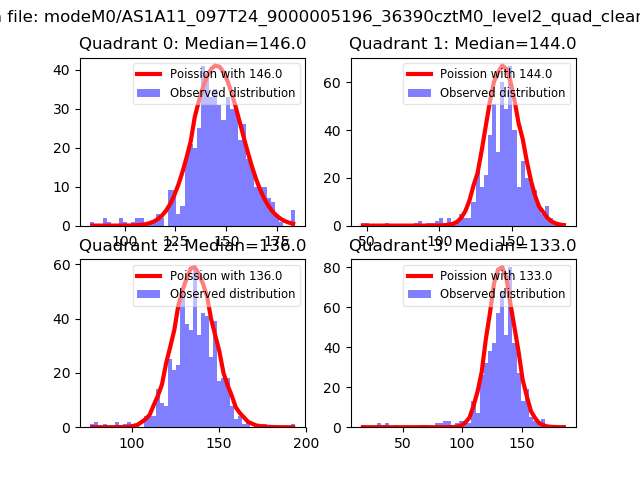 |
 |
| Quadrant-wise count rates Data is divided into 100 sec bins |
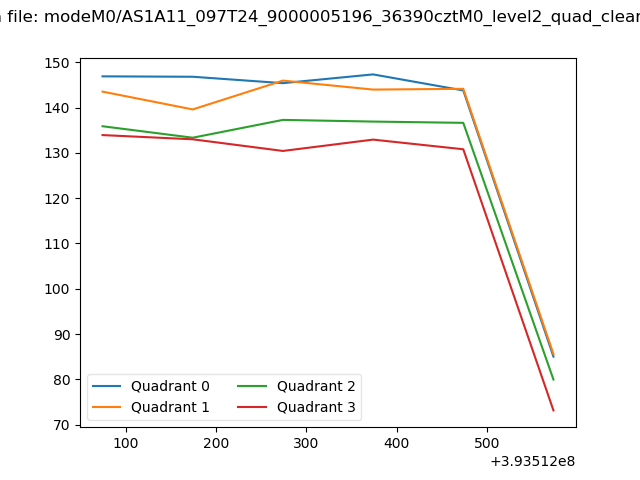 |
|
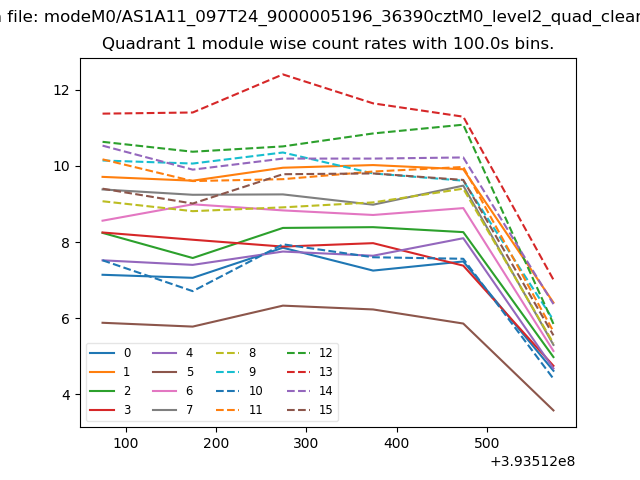
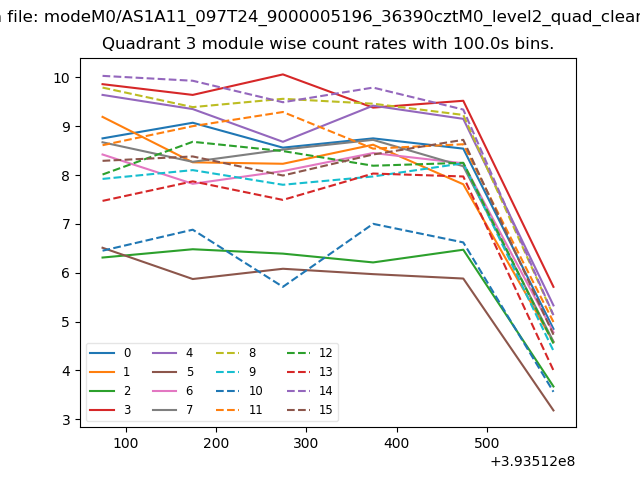
| Module-wise count rates for Quadrant A Data is divided into 100 sec bins |
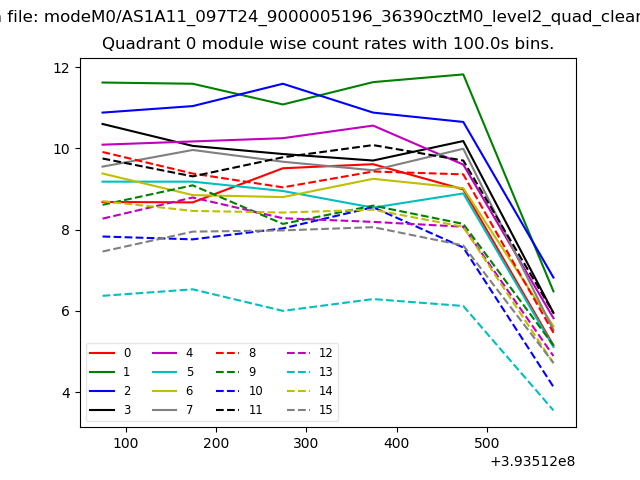 |
 |
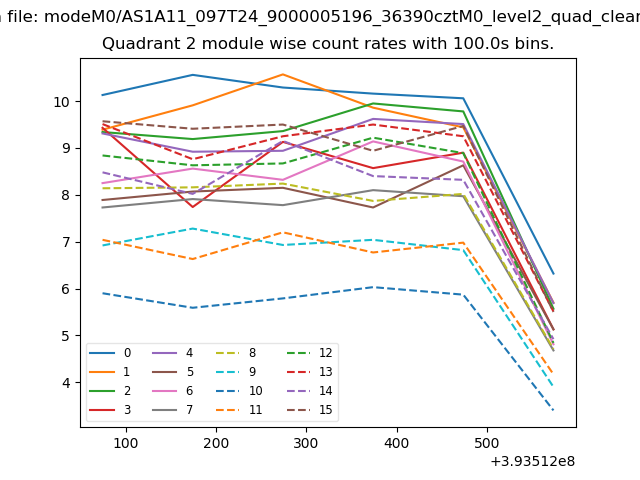
| Module-wise count rates for Quadrant B Data is divided into 100 sec bins |
 |
 |
| Module-wise count rates for Quadrant C Data is divided into 100 sec bins |
 |
 |
| Module-wise count rates for Quadrant D Data is divided into 100 sec bins |
 |
 |
| Parameter | Plot |
|---|---|
| CZT HV Monitor | 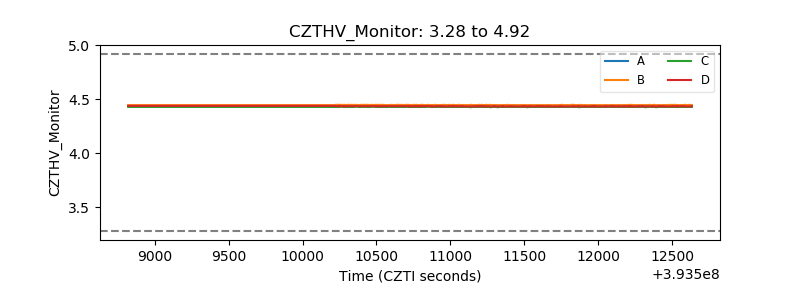 |
| D_VDD | 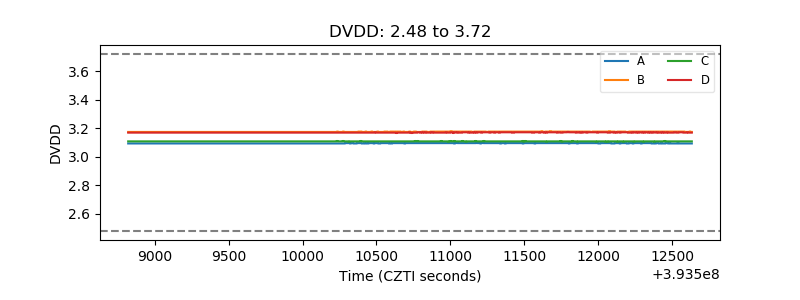 |
| Temperature 1 | 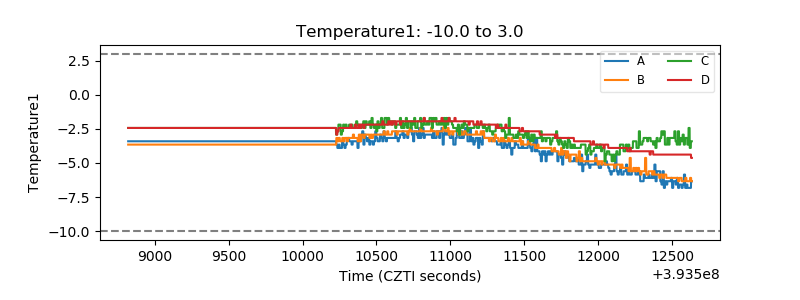 |
| Veto HV Monitor | 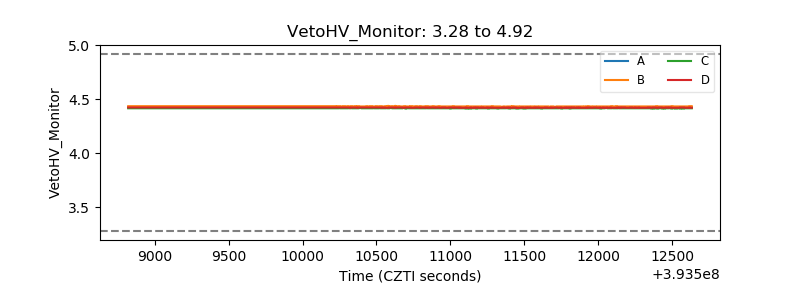 |
| Veto LLD | 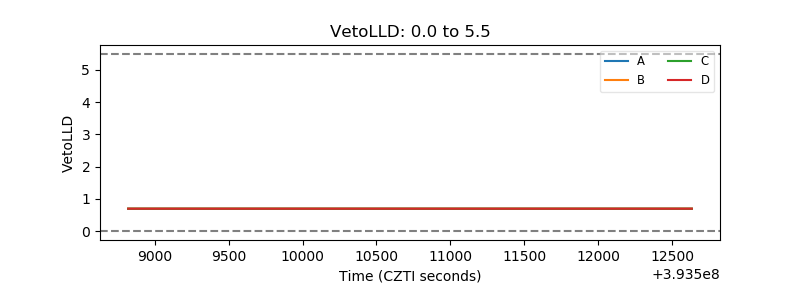 |
| Alpha Counter | 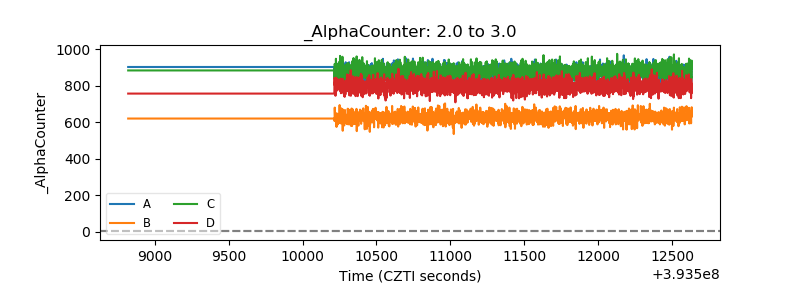 |
| _CPM_Rate | 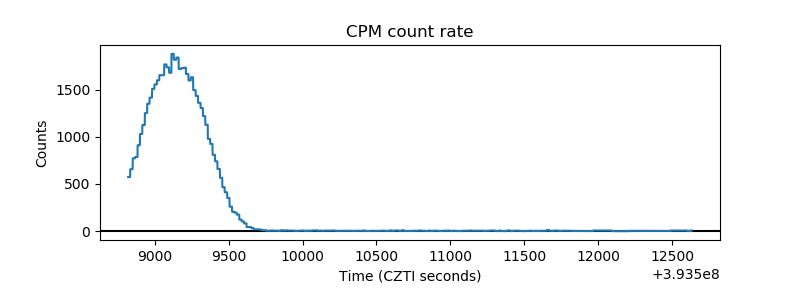 |
| CZT Counter | 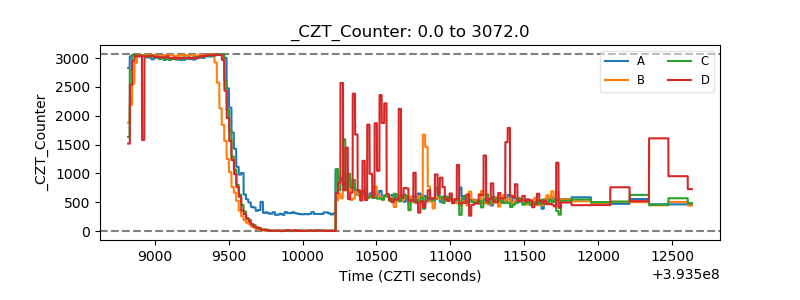 |
| +2.5 Volts monitor | 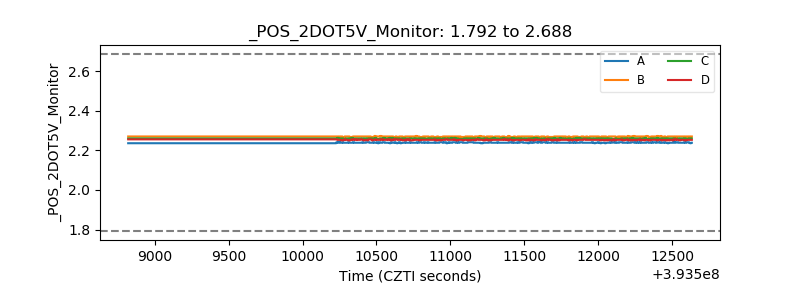 |
| +5 Volts monitor | 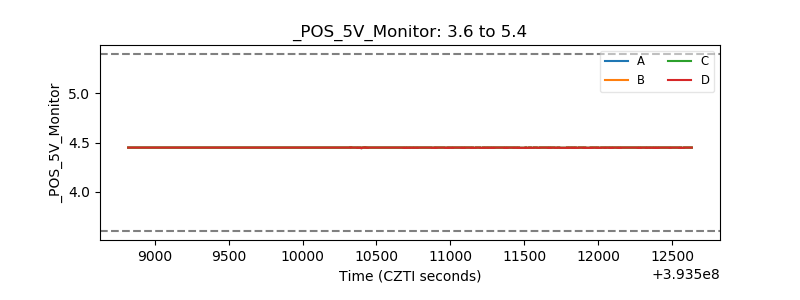 |
| _ROLL_ROT | 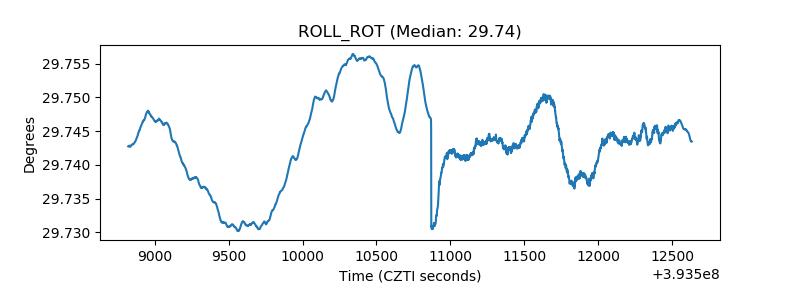 |
| _Roll_DEC | 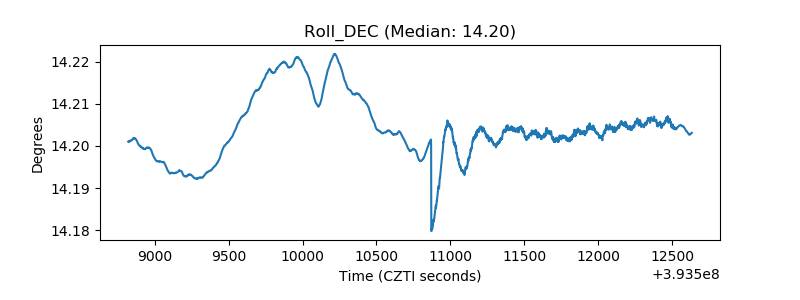 |
| _Roll_RA | 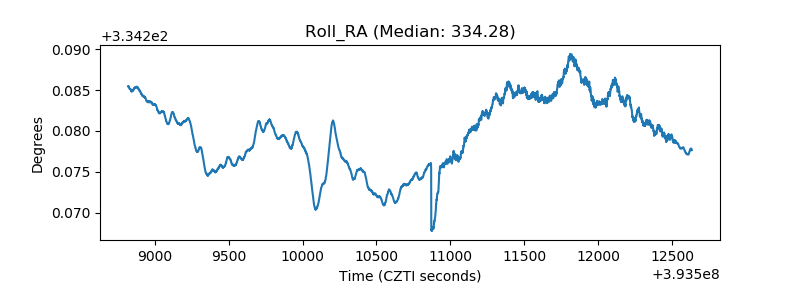 |
| Veto Counter | 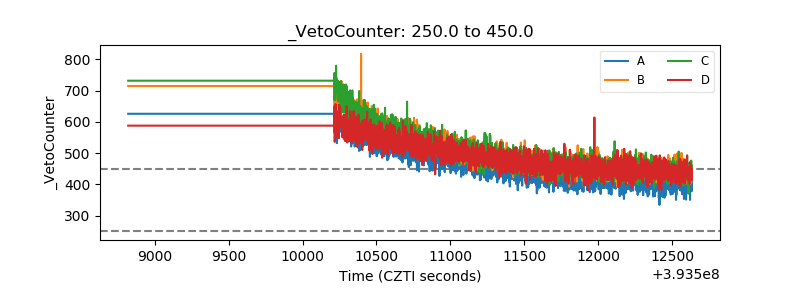 |