| Param | Original file | Final file |
|---|---|---|
| Filename | modeM0/AS1A11_097T24_9000005196_36385cztM0_level2.evt | modeM0/AS1A11_097T24_9000005196_36385cztM0_level2_quad_clean.evt |
| Size (bytes) | 1,417,291,200 | 175,694,400 |
| Size | 1.3 GB | 167.6 MB |
| Events in quadrant A | 8,131,086 | 1,096,978 |
| Events in quadrant B | 10,528,427 | 1,068,595 |
| Events in quadrant C | 12,036,420 | 1,028,522 |
| Events in quadrant D | 11,123,503 | 997,634 |
| Mode SS | |||
|---|---|---|---|
| Quadrant | BADHDUFLAG | Total packets | Discarded packets |
| A | 0 | 334 | 0 |
| B | 0 | 334 | 0 |
| C | 0 | 334 | 0 |
| D | 0 | 334 | 0 |
| Mode M9 | |||
|---|---|---|---|
| Quadrant | BADHDUFLAG | Total packets | Discarded packets |
| A | 0 | 56 | 0 |
| B | 0 | 56 | 0 |
| C | 0 | 56 | 0 |
| D | 0 | 56 | 0 |
| Mode M0 | |||
|---|---|---|---|
| Quadrant | BADHDUFLAG | Total packets | Discarded packets |
| A | 0 | 34211 | 5 |
| B | 0 | 42119 | 4 |
| C | 0 | 46137 | 4 |
| D | 0 | 44108 | 4 |
| Quadrant | Total seconds | Saturated seconds | Saturation percentage |
|---|---|---|---|
| A | 16365 | 24 | 0.146654% |
| B | 16365 | 785 | 4.796822% |
| C | 16365 | 1104 | 6.746104% |
| D | 16365 | 758 | 4.631836% |
Noise dominated data is calculated using 1-second bins in cleaned event files. If a bin has >2000 counts, and if more than 50% of those come from <1% of pixels, then it is considered to be noise-dominated and hence unusable.
| Quadrant | # 1 sec bins | Bins with >0 counts | Bins with >2000 counts | High rate bins dominated by noise | Noise dominated (total time) | Noise dominated (detector-on time) | Marked lightcurve |
|---|---|---|---|---|---|---|---|
| A | 21886 | 16369 | 7 | 7 | 0.03% | 0.04% | 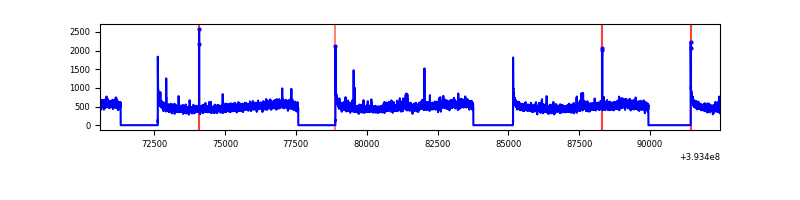 |
| B | 21886 | 16369 | 554 | 554 | 2.53% | 3.38% | 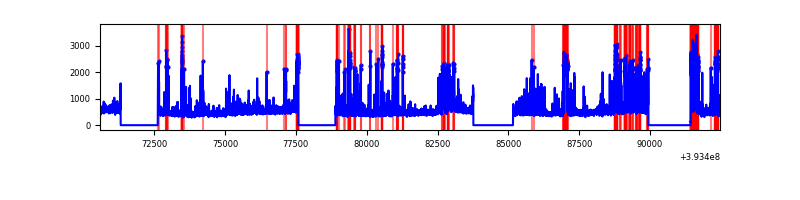 |
| C | 21886 | 16369 | 1078 | 1078 | 4.93% | 6.59% | 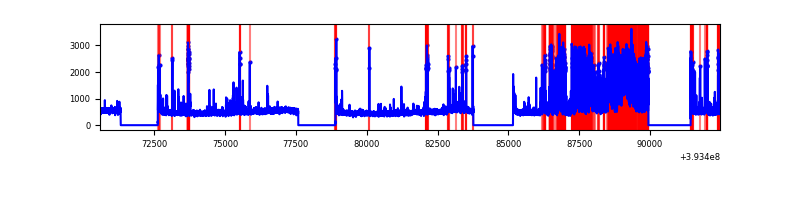 |
| D | 21886 | 16369 | 686 | 686 | 3.13% | 4.19% | 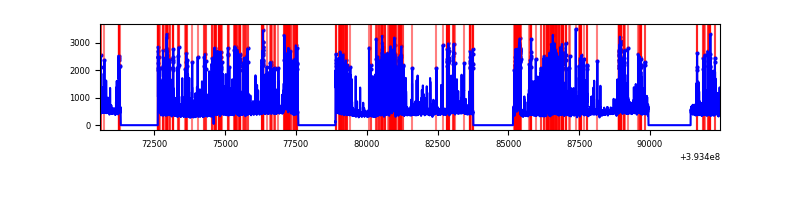 |
Top three noisy pixels from each quadrant. If the there are fewer than three noisy pixels in the level2.evt file, extra rows are filled as -1
| Pixel properties | Quadrant properties | ||||||
|---|---|---|---|---|---|---|---|
| Quadrant | DetID | PixID | Counts | Sigma | Mean | Median | Sigma |
| A | 10 | 83 | 458427 | 1193.09 | 1905 | 1869 | 382.7 |
| A | 15 | 223 | 262773 | 681.8 | 1905 | 1869 | 382.7 |
| A | 13 | 254 | 28839 | 70.48 | 1905 | 1869 | 382.7 |
| B | 5 | 172 | 2132803 | 6007.01 | 1850 | 1798 | 354.8 |
| B | 5 | 255 | 368963 | 1034.99 | 1850 | 1798 | 354.8 |
| B | 4 | 171 | 351261 | 985.09 | 1850 | 1798 | 354.8 |
| C | 4 | 254 | 4029627 | 9720.21 | 1788 | 1796 | 414.4 |
| C | 15 | 214 | 678403 | 1632.83 | 1788 | 1796 | 414.4 |
| C | 0 | 10 | 294260 | 705.79 | 1788 | 1796 | 414.4 |
| D | 12 | 6 | 2063964 | 4683.52 | 1808 | 1756 | 440.3 |
| D | 13 | 249 | 613882 | 1390.21 | 1808 | 1756 | 440.3 |
| D | 2 | 249 | 466862 | 1056.31 | 1808 | 1756 | 440.3 |
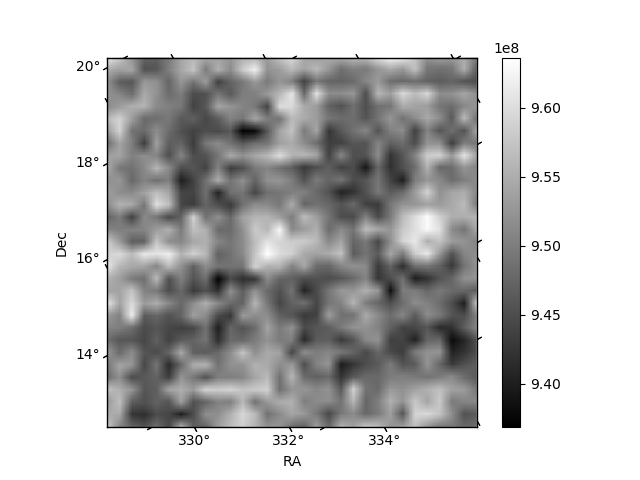
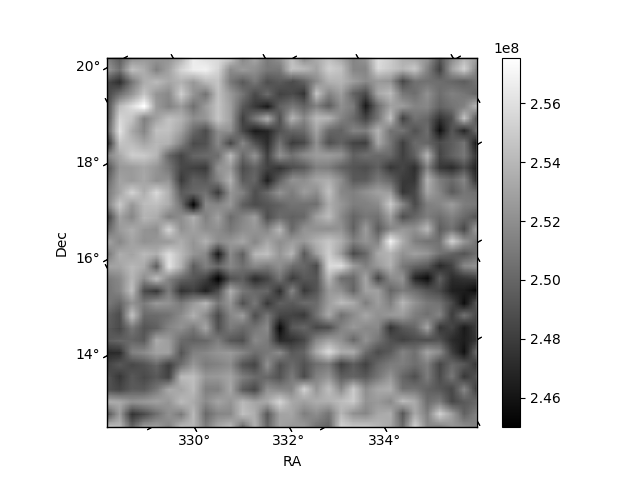
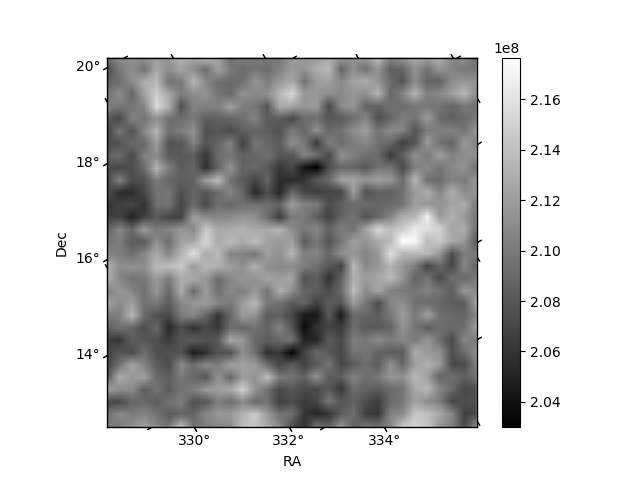
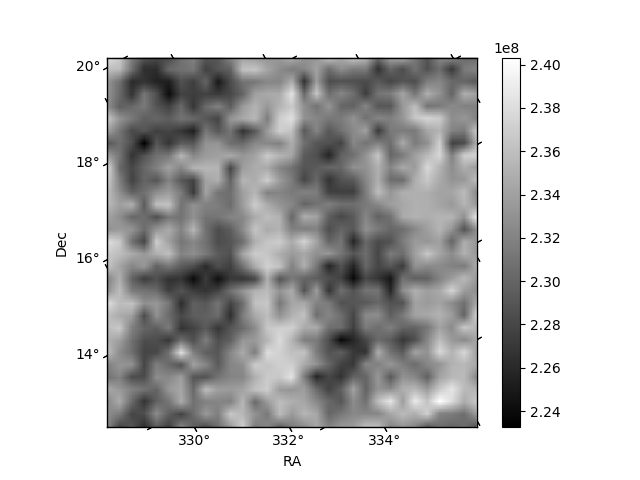
Histogram calculated using DETX and DETY for each event in the final _common_clean file
| Quadrant A | 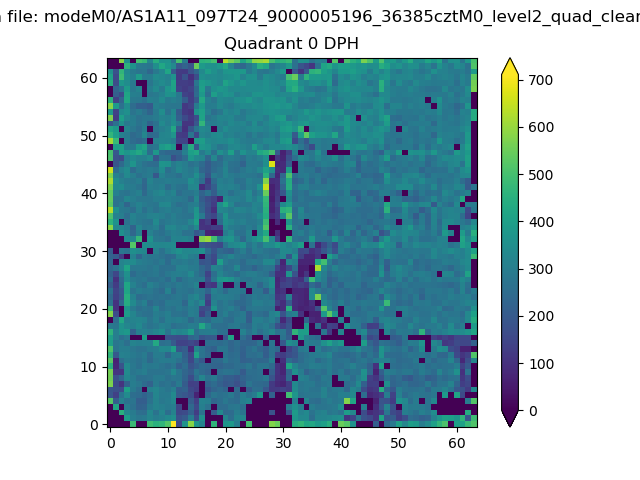 |
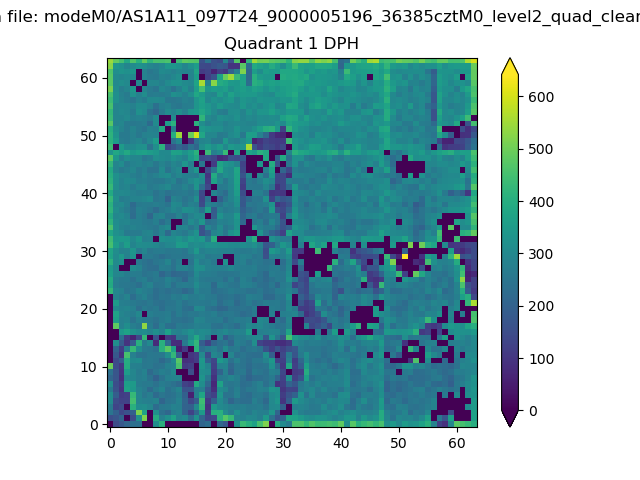 |
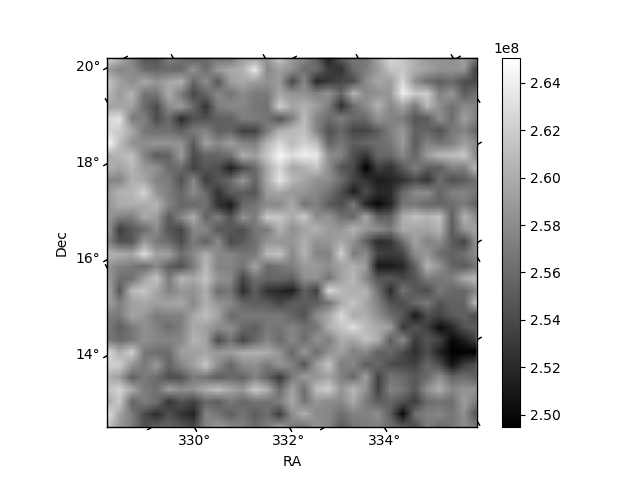
Quadrant B |
|---|---|---|---|
| Quadrant D | 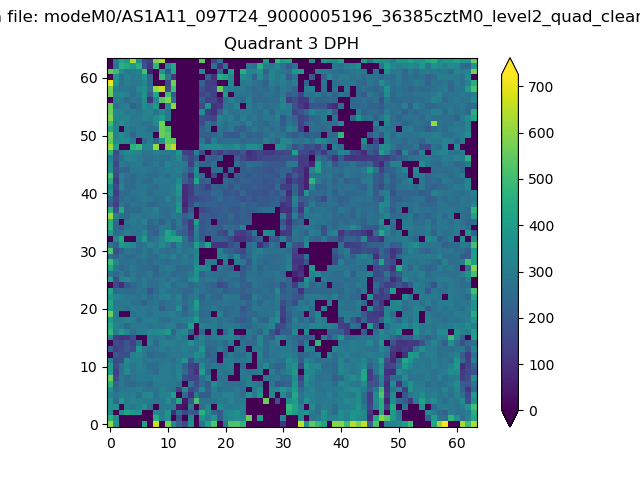 |
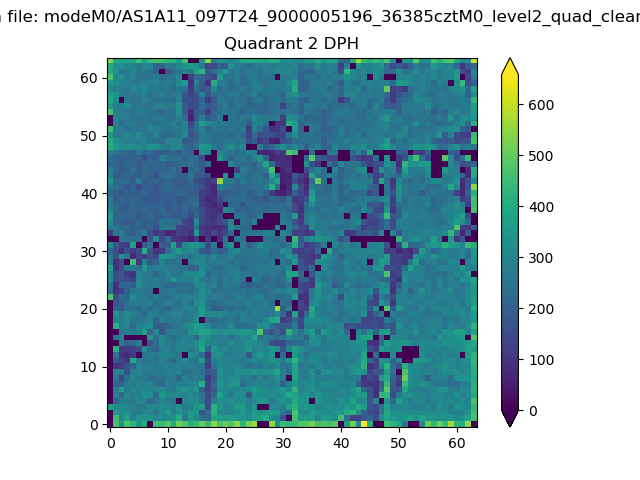 |
Quadrant C |
| Plot type | Count rate plots | Images |
|---|---|---|
| Comparison with Poisson distribution Blue bars denote a histogram of data divided into 1 sec bins. Red curve is a Poisson curve with rate = median count rate of data. |
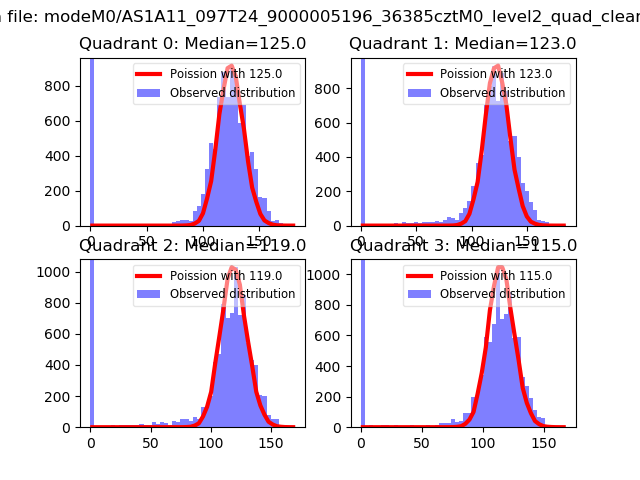 |
 |
| Quadrant-wise count rates Data is divided into 100 sec bins |
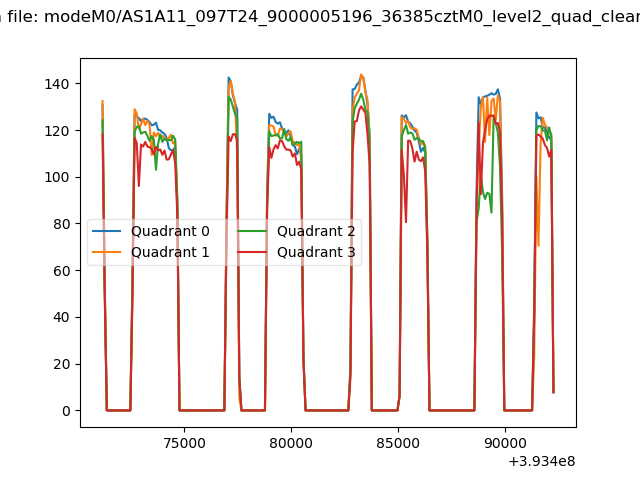 |
|
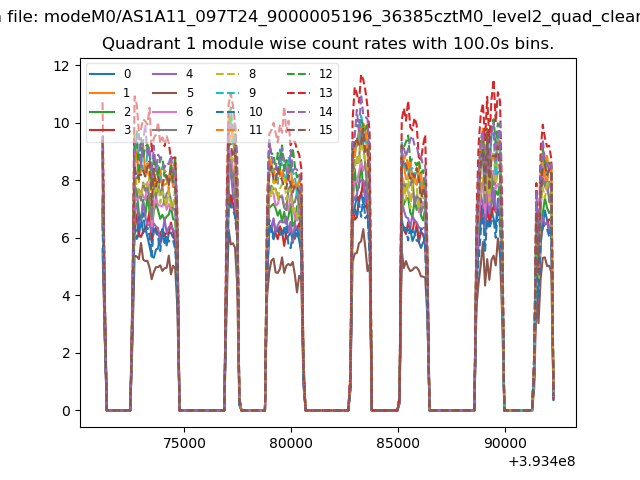
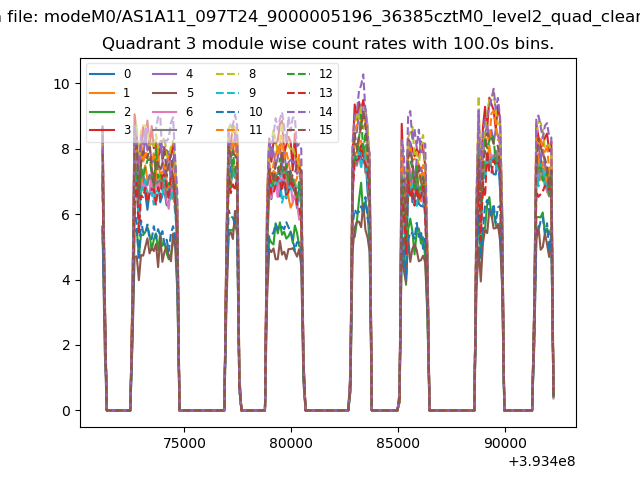
| Module-wise count rates for Quadrant A Data is divided into 100 sec bins |
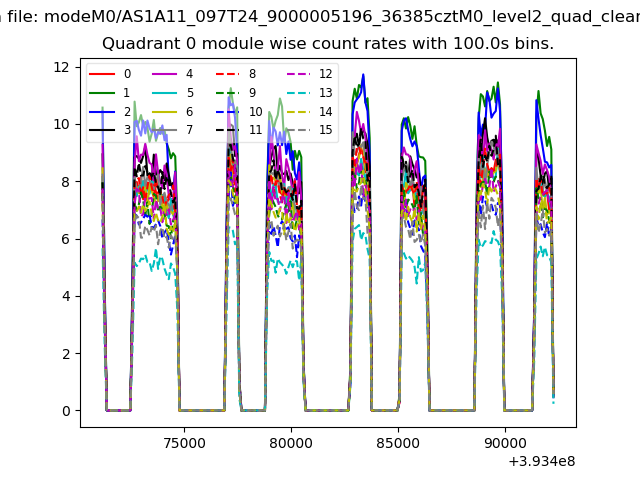 |
 |
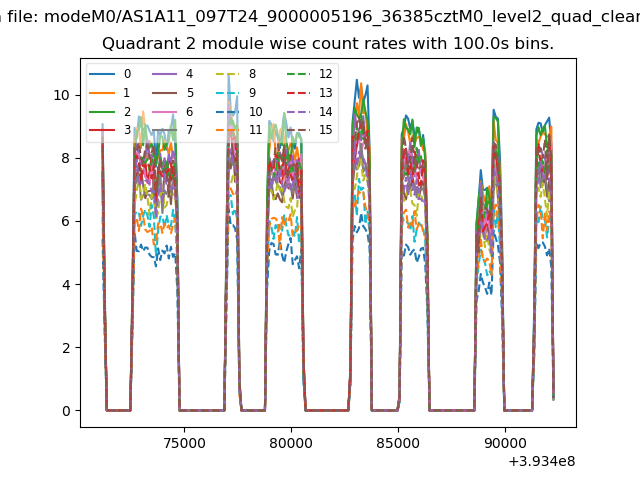
| Module-wise count rates for Quadrant B Data is divided into 100 sec bins |
 |
 |
| Module-wise count rates for Quadrant C Data is divided into 100 sec bins |
 |
 |
| Module-wise count rates for Quadrant D Data is divided into 100 sec bins |
 |
 |
| Parameter | Plot |
|---|---|
| CZT HV Monitor | 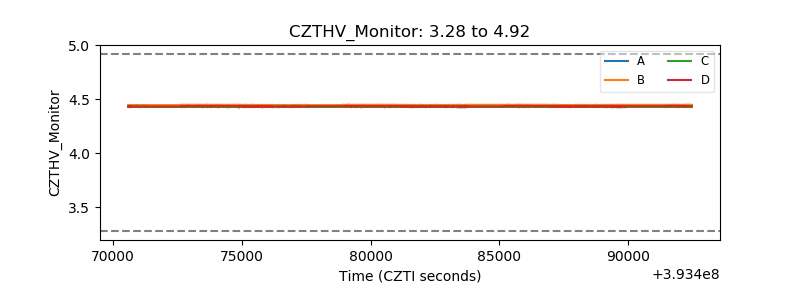 |
| D_VDD | 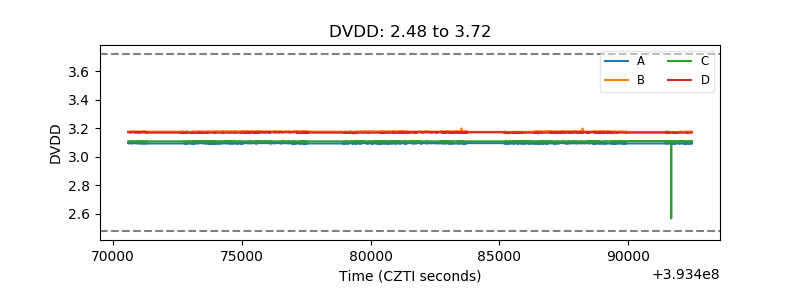 |
| Temperature 1 | 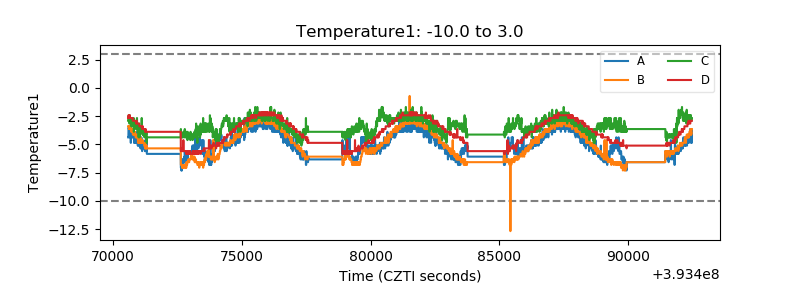 |
| Veto HV Monitor | 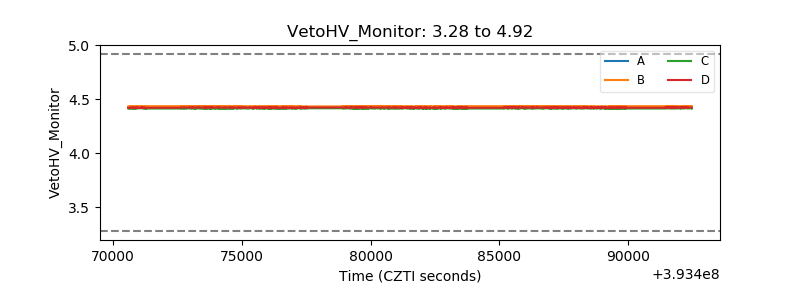 |
| Veto LLD | 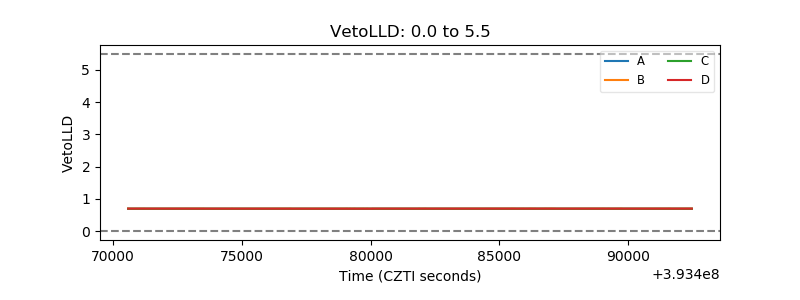 |
| Alpha Counter | 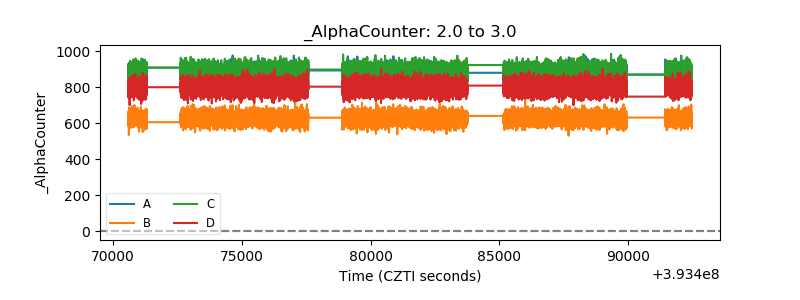 |
| _CPM_Rate | 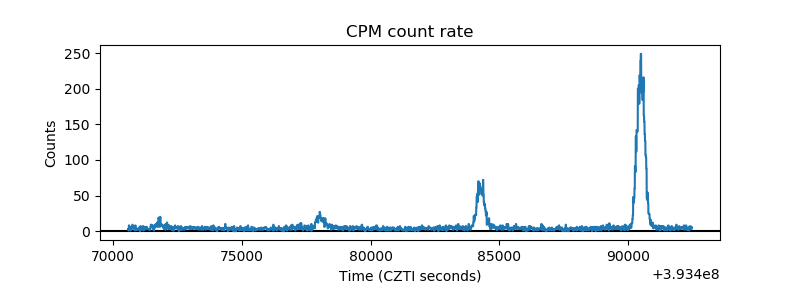 |
| CZT Counter | 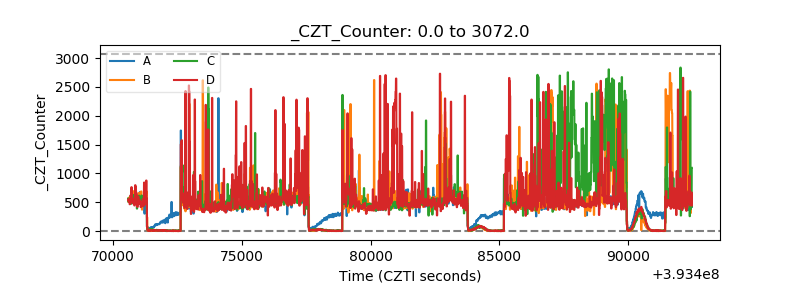 |
| +2.5 Volts monitor | 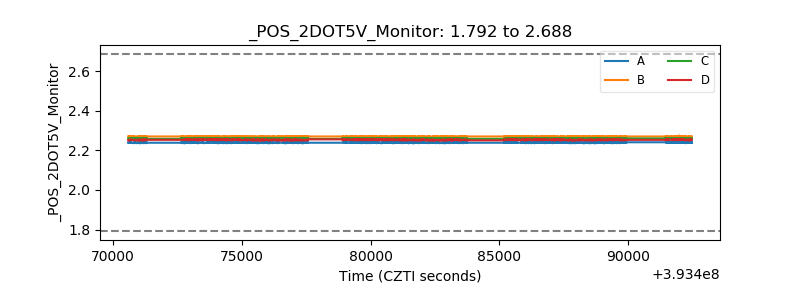 |
| +5 Volts monitor | 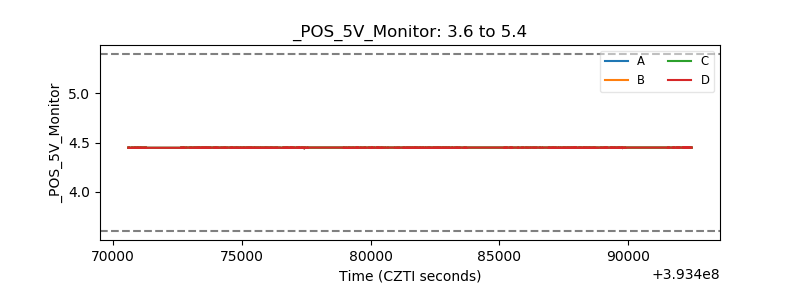 |
| _ROLL_ROT | 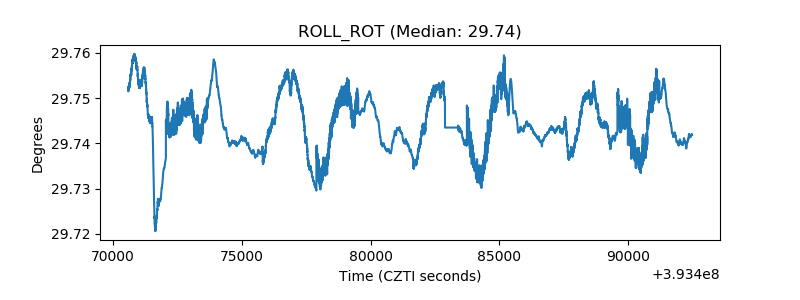 |
| _Roll_DEC | 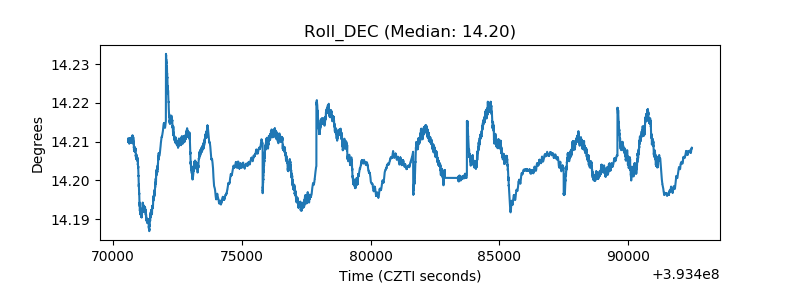 |
| _Roll_RA | 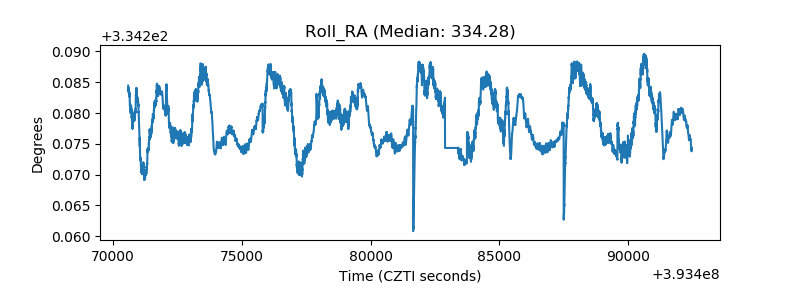 |
| Veto Counter | 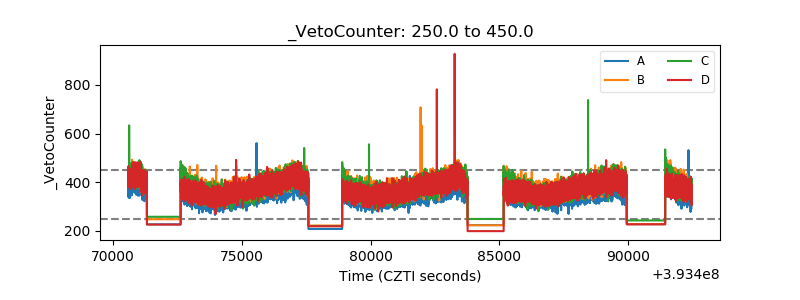 |