| Param | Original file | Final file |
|---|---|---|
| Filename | modeM0/AS1A11_097T24_9000005196_36371cztM0_level2.evt | modeM0/AS1A11_097T24_9000005196_36371cztM0_level2_quad_clean.evt |
| Size (bytes) | 529,128,000 | 60,318,720 |
| Size | 504.6 MB | 57.5 MB |
| Events in quadrant A | 2,875,942 | 376,663 |
| Events in quadrant B | 4,532,633 | 350,098 |
| Events in quadrant C | 2,852,663 | 368,413 |
| Events in quadrant D | 5,377,288 | 332,325 |
| Mode SS | |||
|---|---|---|---|
| Quadrant | BADHDUFLAG | Total packets | Discarded packets |
| A | 0 | 114 | 0 |
| B | 0 | 114 | 0 |
| C | 0 | 114 | 0 |
| D | 0 | 114 | 0 |
| Mode M9 | |||
|---|---|---|---|
| Quadrant | BADHDUFLAG | Total packets | Discarded packets |
| A | 0 | 19 | 0 |
| B | 0 | 19 | 0 |
| C | 0 | 19 | 0 |
| D | 0 | 20 | 0 |
| Mode M0 | |||
|---|---|---|---|
| Quadrant | BADHDUFLAG | Total packets | Discarded packets |
| A | 0 | 12095 | 3 |
| B | 0 | 17266 | 2 |
| C | 0 | 11931 | 2 |
| D | 0 | 19863 | 2 |
| Quadrant | Total seconds | Saturated seconds | Saturation percentage |
|---|---|---|---|
| A | 5704 | 38 | 0.666199% |
| B | 5704 | 673 | 11.798738% |
| C | 5704 | 33 | 0.578541% |
| D | 5704 | 594 | 10.413745% |
Noise dominated data is calculated using 1-second bins in cleaned event files. If a bin has >2000 counts, and if more than 50% of those come from <1% of pixels, then it is considered to be noise-dominated and hence unusable.
| Quadrant | # 1 sec bins | Bins with >0 counts | Bins with >2000 counts | High rate bins dominated by noise | Noise dominated (total time) | Noise dominated (detector-on time) | Marked lightcurve |
|---|---|---|---|---|---|---|---|
| A | 7256 | 5704 | 26 | 26 | 0.36% | 0.46% | 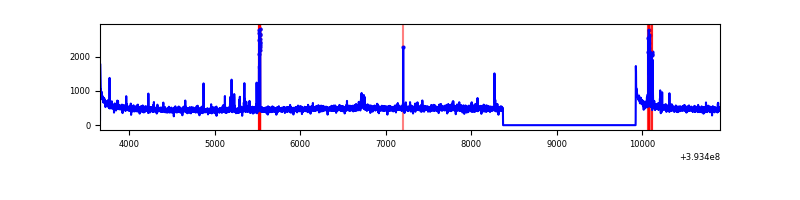 |
| B | 7256 | 5703 | 532 | 532 | 7.33% | 9.33% | 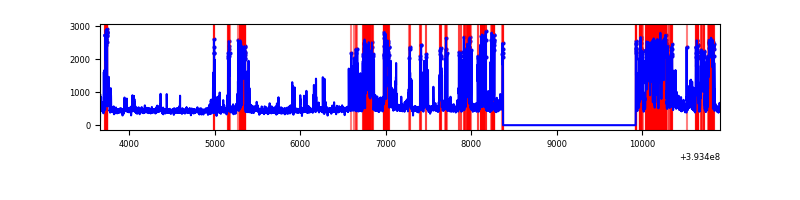 |
| C | 7256 | 5703 | 34 | 34 | 0.47% | 0.60% | 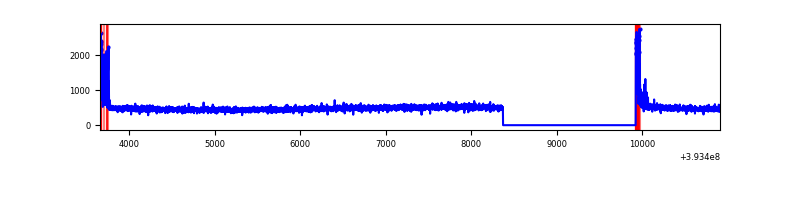 |
| D | 7256 | 5703 | 620 | 620 | 8.54% | 10.87% | 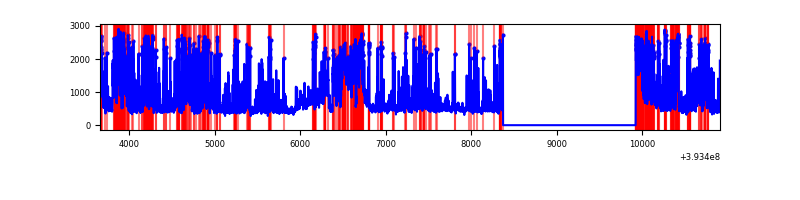 |
Top three noisy pixels from each quadrant. If the there are fewer than three noisy pixels in the level2.evt file, extra rows are filled as -1
| Pixel properties | Quadrant properties | ||||||
|---|---|---|---|---|---|---|---|
| Quadrant | DetID | PixID | Counts | Sigma | Mean | Median | Sigma |
| A | 10 | 83 | 187841 | 1403.86 | 656 | 643 | 133.3 |
| A | 9 | 143 | 121960 | 909.8 | 656 | 643 | 133.3 |
| A | 12 | 189 | 25388 | 185.57 | 656 | 643 | 133.3 |
| B | 5 | 172 | 1977051 | 16450.04 | 615 | 599 | 120.1 |
| B | 5 | 236 | 47145 | 387.4 | 615 | 599 | 120.1 |
| B | 0 | 190 | 42889 | 351.98 | 615 | 599 | 120.1 |
| C | 15 | 214 | 244574 | 1647.81 | 629 | 634 | 148.0 |
| C | 0 | 10 | 155137 | 1043.66 | 629 | 634 | 148.0 |
| C | 13 | 61 | 4139 | 23.68 | 629 | 634 | 148.0 |
| D | 12 | 6 | 926495 | 6179.93 | 611 | 595 | 149.8 |
| D | 2 | 249 | 913429 | 6092.72 | 611 | 595 | 149.8 |
| D | 2 | 250 | 472254 | 3148.09 | 611 | 595 | 149.8 |
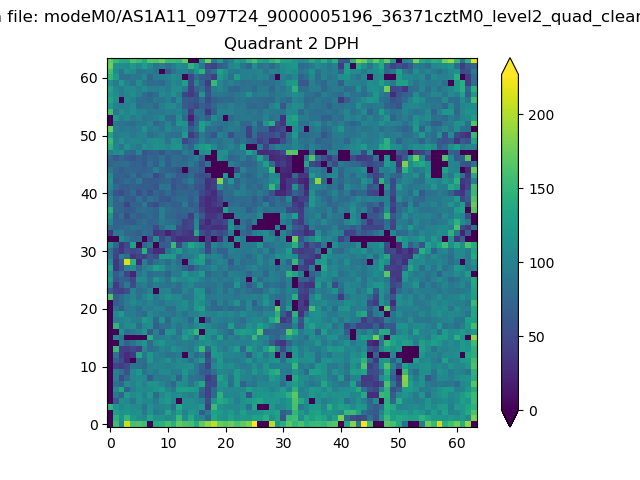
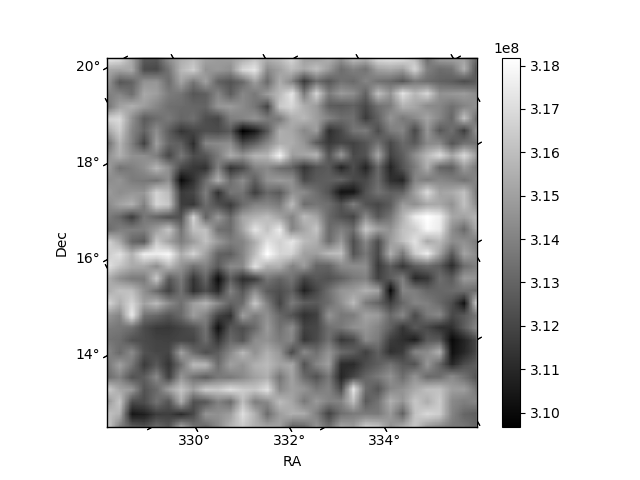
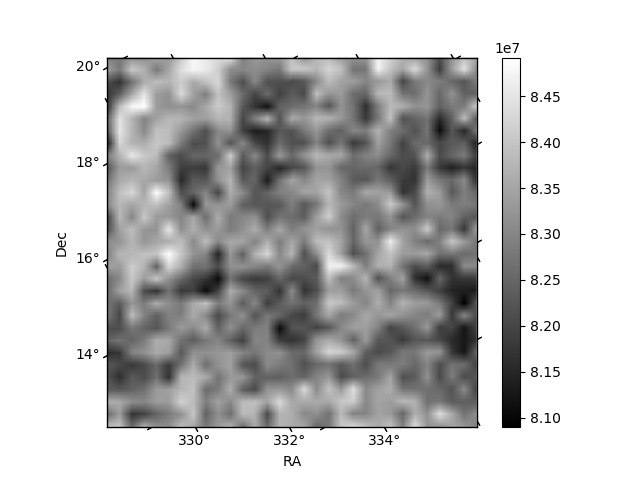
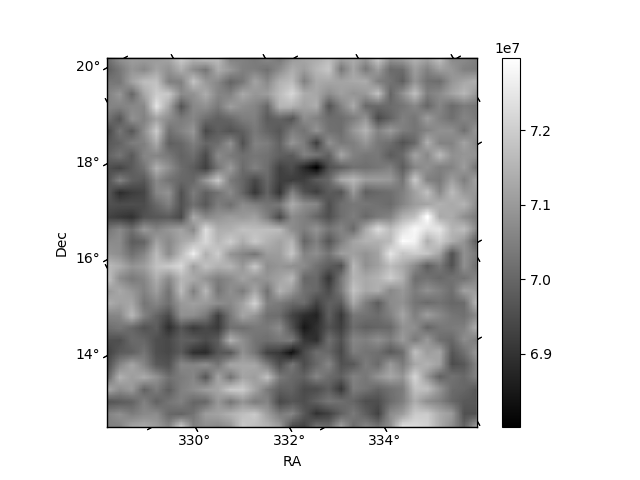
Histogram calculated using DETX and DETY for each event in the final _common_clean file
| Quadrant A | 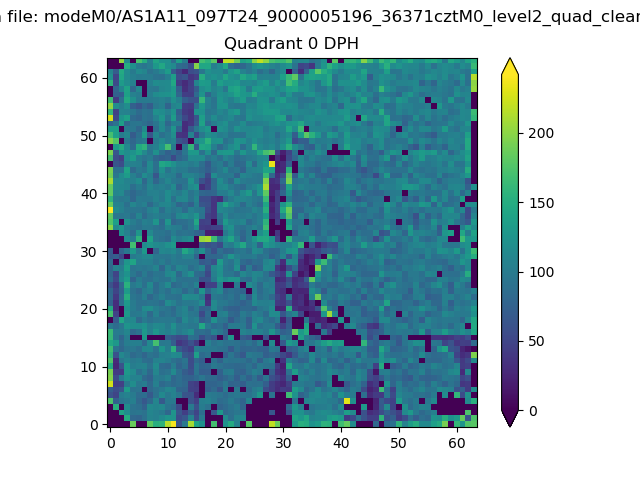 |
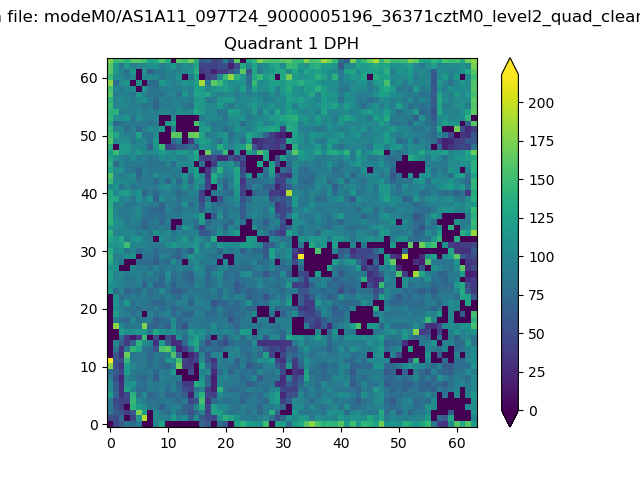 |
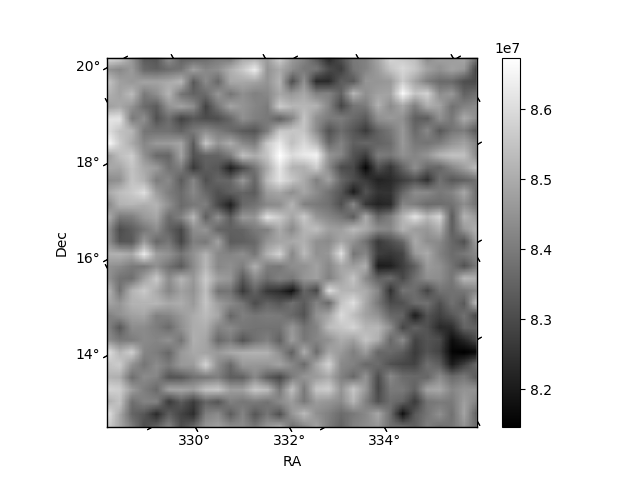
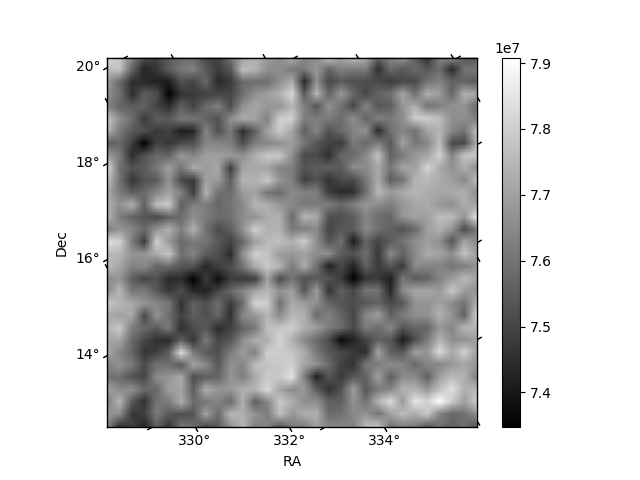
Quadrant B |
|---|---|---|---|
| Quadrant D | 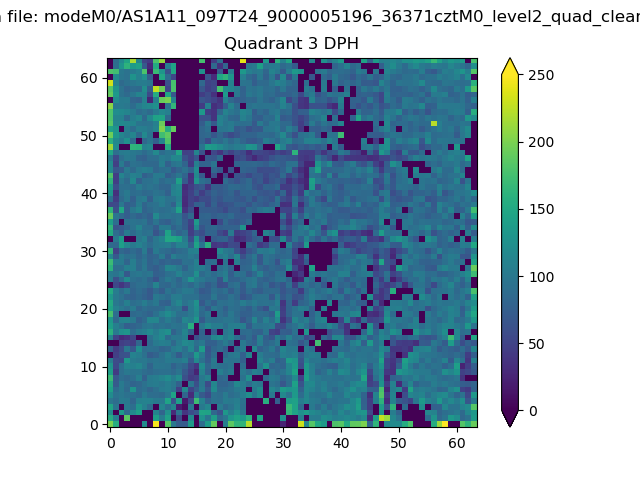 |
 |
Quadrant C |
| Plot type | Count rate plots | Images |
|---|---|---|
| Comparison with Poisson distribution Blue bars denote a histogram of data divided into 1 sec bins. Red curve is a Poisson curve with rate = median count rate of data. |
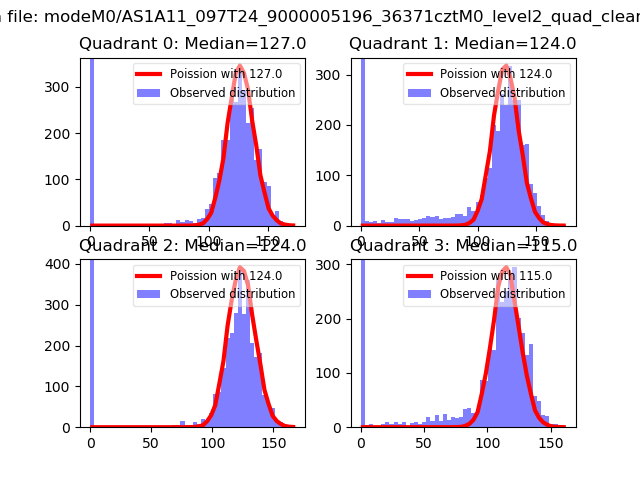 |
 |
| Quadrant-wise count rates Data is divided into 100 sec bins |
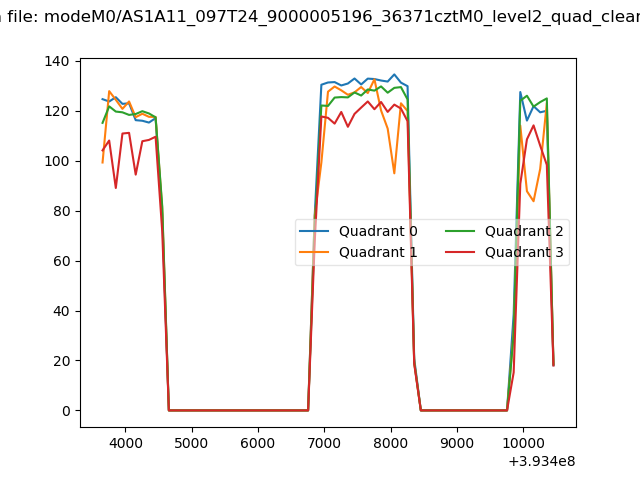 |
|
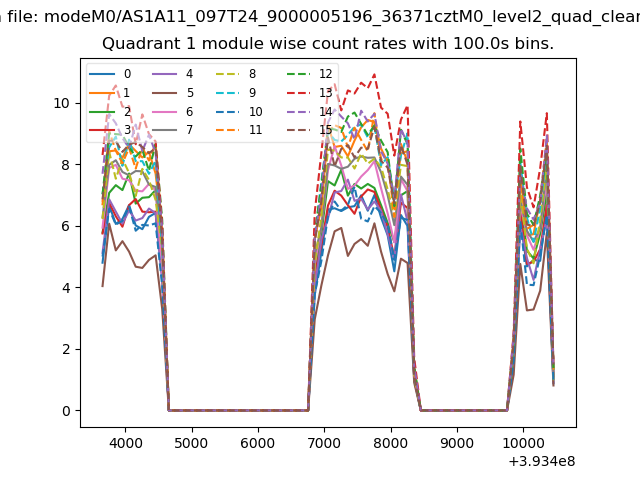
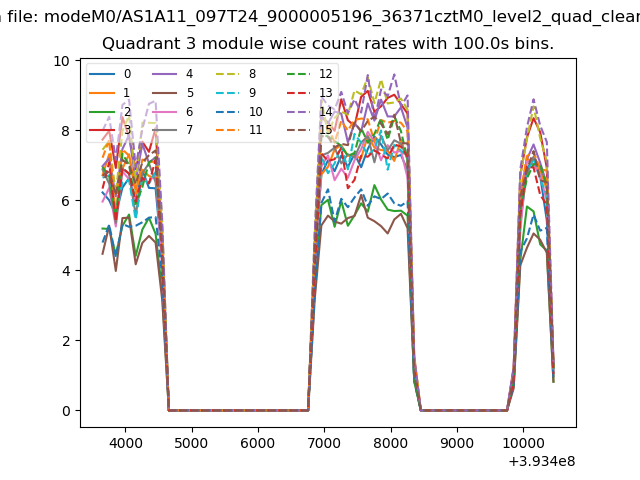
| Module-wise count rates for Quadrant A Data is divided into 100 sec bins |
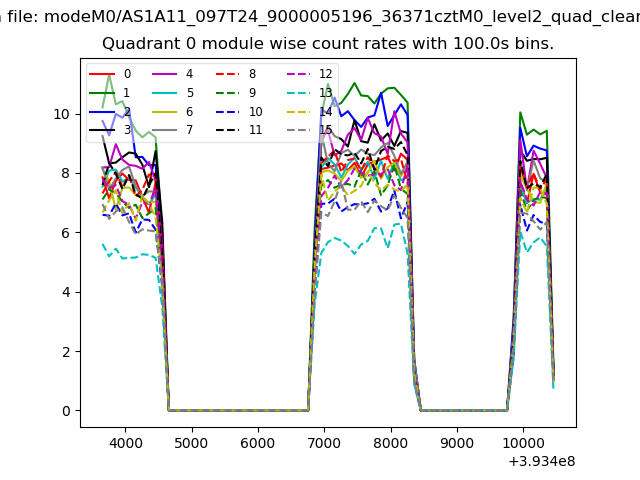 |
 |
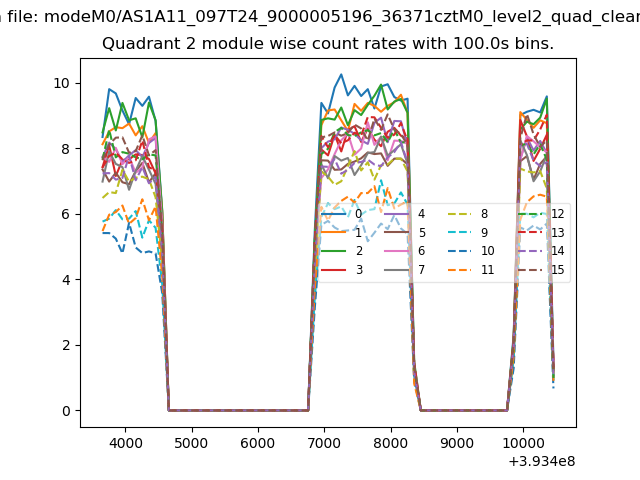
| Module-wise count rates for Quadrant B Data is divided into 100 sec bins |
 |
 |
| Module-wise count rates for Quadrant C Data is divided into 100 sec bins |
 |
 |
| Module-wise count rates for Quadrant D Data is divided into 100 sec bins |
 |
 |
| Parameter | Plot |
|---|---|
| CZT HV Monitor | 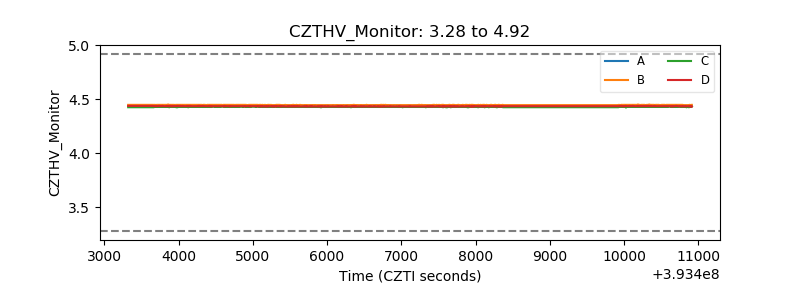 |
| D_VDD | 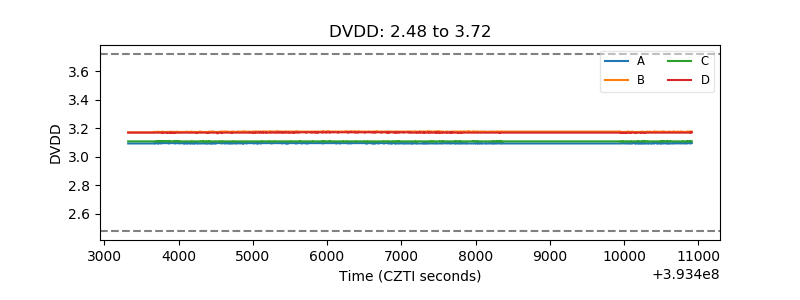 |
| Temperature 1 | 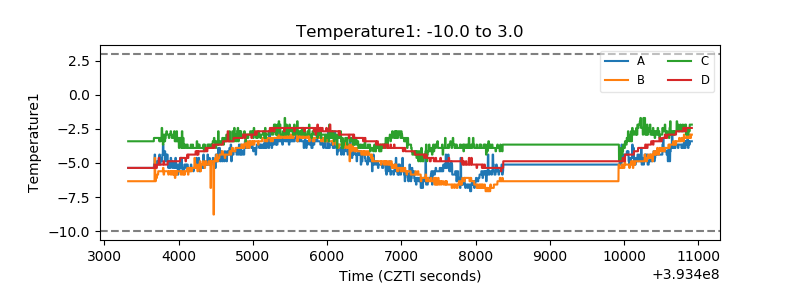 |
| Veto HV Monitor | 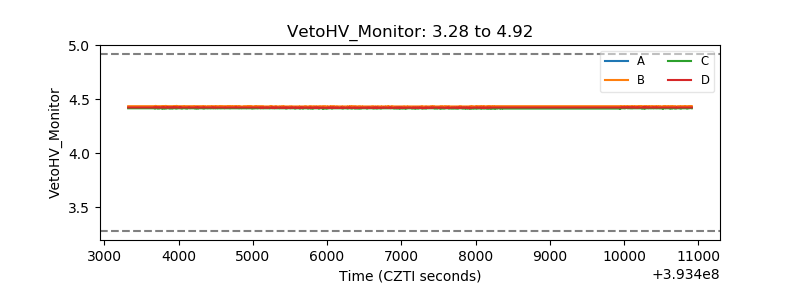 |
| Veto LLD | 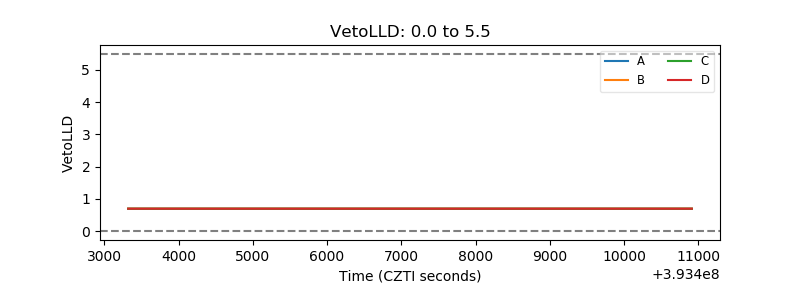 |
| Alpha Counter | 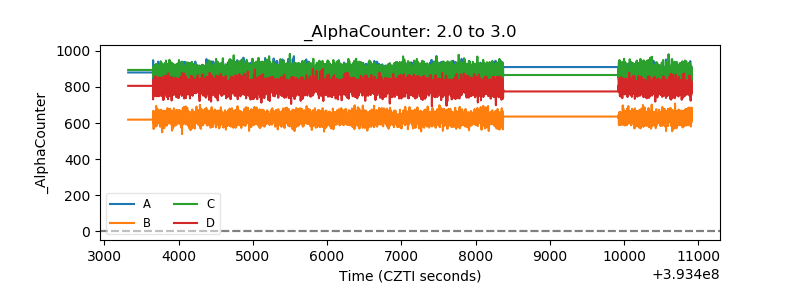 |
| _CPM_Rate | 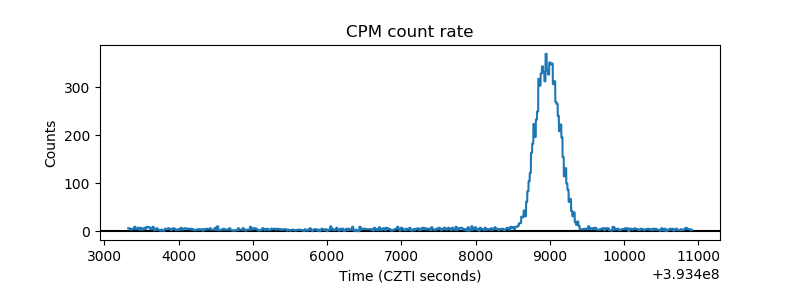 |
| CZT Counter | 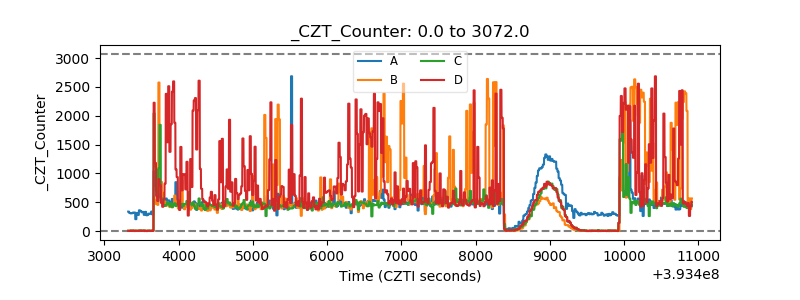 |
| +2.5 Volts monitor | 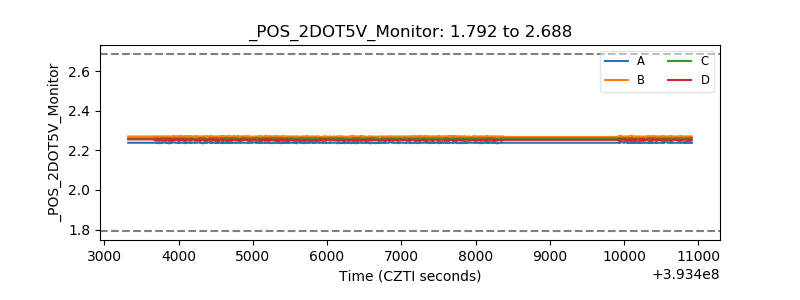 |
| +5 Volts monitor | 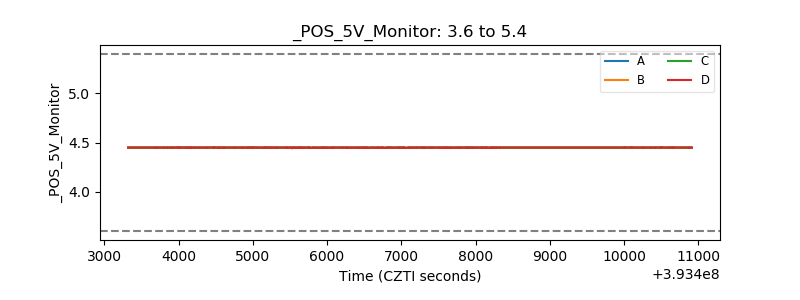 |
| _ROLL_ROT | 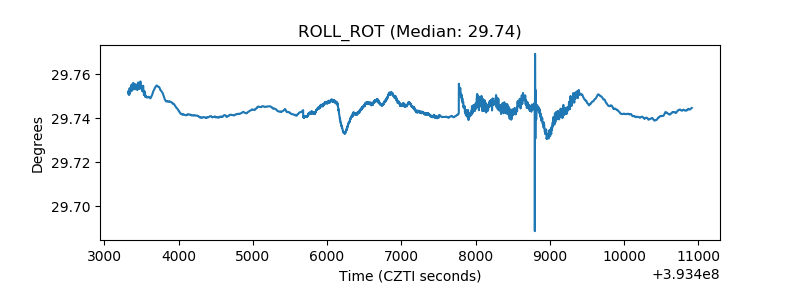 |
| _Roll_DEC | 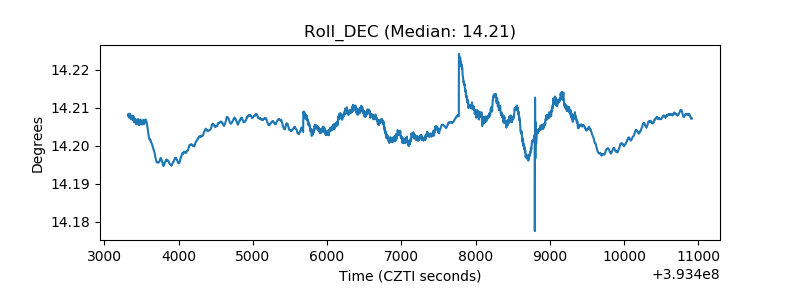 |
| _Roll_RA | 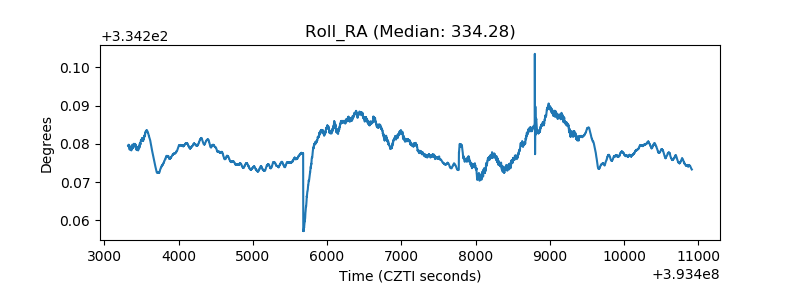 |
| Veto Counter | 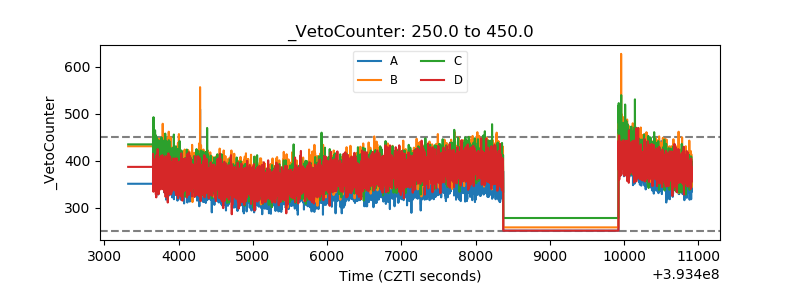 |