| Param | Original file | Final file |
|---|---|---|
| Filename | modeM0/AS1A11_097T24_9000005196_36370cztM0_level2.evt | modeM0/AS1A11_097T24_9000005196_36370cztM0_level2_quad_clean.evt |
| Size (bytes) | 873,875,520 | 122,109,120 |
| Size | 833.4 MB | 116.5 MB |
| Events in quadrant A | 5,589,938 | 761,169 |
| Events in quadrant B | 6,360,957 | 761,031 |
| Events in quadrant C | 5,272,434 | 746,557 |
| Events in quadrant D | 8,515,094 | 684,313 |
| Mode SS | |||
|---|---|---|---|
| Quadrant | BADHDUFLAG | Total packets | Discarded packets |
| A | 0 | 222 | 0 |
| B | 0 | 222 | 0 |
| C | 0 | 222 | 0 |
| D | 0 | 222 | 0 |
| Mode M9 | |||
|---|---|---|---|
| Quadrant | BADHDUFLAG | Total packets | Discarded packets |
| A | 0 | 38 | 0 |
| B | 0 | 38 | 0 |
| C | 0 | 38 | 0 |
| D | 0 | 38 | 0 |
| Mode M0 | |||
|---|---|---|---|
| Quadrant | BADHDUFLAG | Total packets | Discarded packets |
| A | 0 | 23489 | 4 |
| B | 0 | 26063 | 3 |
| C | 0 | 22315 | 3 |
| D | 0 | 32726 | 3 |
| Quadrant | Total seconds | Saturated seconds | Saturation percentage |
|---|---|---|---|
| A | 10744 | 51 | 0.474684% |
| B | 10744 | 309 | 2.876024% |
| C | 10744 | 30 | 0.279226% |
| D | 10744 | 853 | 7.939315% |
Noise dominated data is calculated using 1-second bins in cleaned event files. If a bin has >2000 counts, and if more than 50% of those come from <1% of pixels, then it is considered to be noise-dominated and hence unusable.
| Quadrant | # 1 sec bins | Bins with >0 counts | Bins with >2000 counts | High rate bins dominated by noise | Noise dominated (total time) | Noise dominated (detector-on time) | Marked lightcurve |
|---|---|---|---|---|---|---|---|
| A | 13518 | 10744 | 38 | 38 | 0.28% | 0.35% | 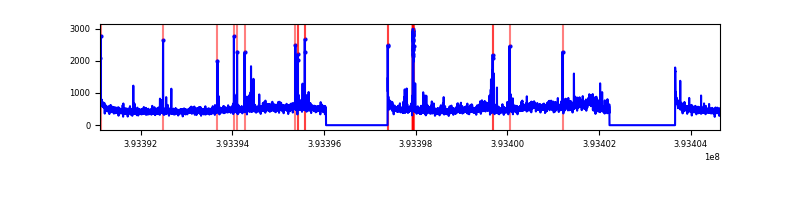 |
| B | 13518 | 10745 | 205 | 205 | 1.52% | 1.91% | 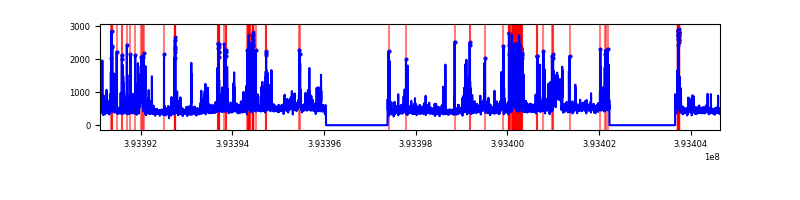 |
| C | 13519 | 10746 | 29 | 29 | 0.21% | 0.27% | 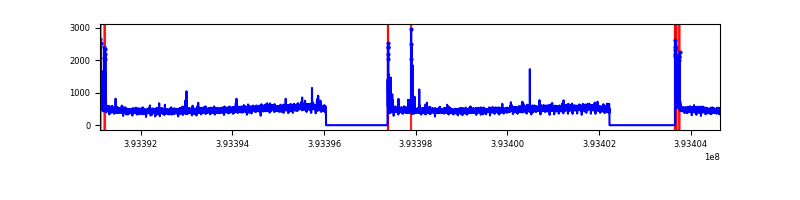 |
| D | 13519 | 10746 | 825 | 825 | 6.10% | 7.68% | 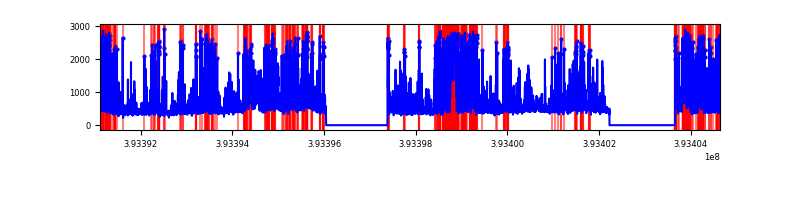 |
Top three noisy pixels from each quadrant. If the there are fewer than three noisy pixels in the level2.evt file, extra rows are filled as -1
| Pixel properties | Quadrant properties | ||||||
|---|---|---|---|---|---|---|---|
| Quadrant | DetID | PixID | Counts | Sigma | Mean | Median | Sigma |
| A | 12 | 189 | 344808 | 1398.39 | 1224 | 1201 | 245.7 |
| A | 10 | 83 | 312177 | 1265.59 | 1224 | 1201 | 245.7 |
| A | 9 | 143 | 175789 | 710.53 | 1224 | 1201 | 245.7 |
| B | 5 | 172 | 1047012 | 4575.66 | 1198 | 1167 | 228.6 |
| B | 15 | 85 | 186866 | 812.45 | 1198 | 1167 | 228.6 |
| B | 0 | 182 | 171868 | 746.83 | 1198 | 1167 | 228.6 |
| C | 15 | 214 | 458341 | 1659.78 | 1178 | 1188 | 275.4 |
| C | 0 | 10 | 190593 | 687.67 | 1178 | 1188 | 275.4 |
| C | 0 | 207 | 27241 | 94.59 | 1178 | 1188 | 275.4 |
| D | 12 | 6 | 1290280 | 4583.99 | 1147 | 1117 | 281.2 |
| D | 2 | 249 | 949737 | 3373.09 | 1147 | 1117 | 281.2 |
| D | 13 | 249 | 833929 | 2961.3 | 1147 | 1117 | 281.2 |
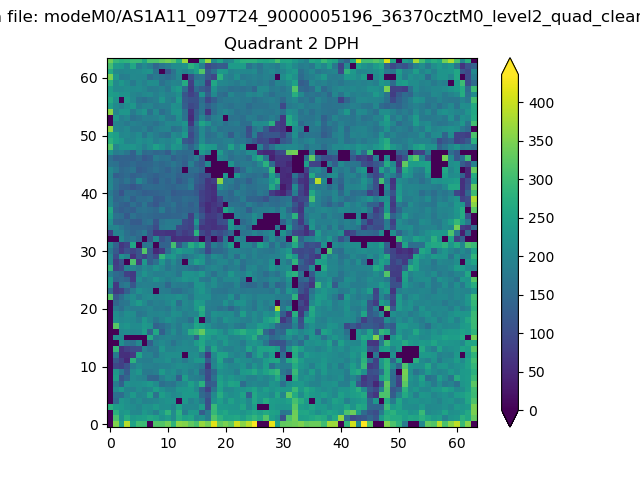
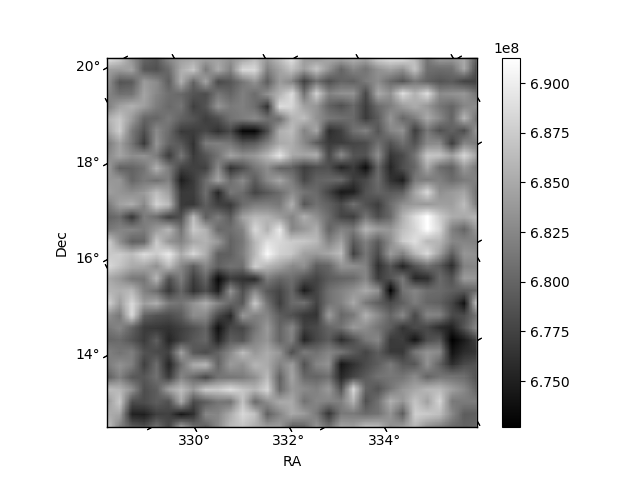
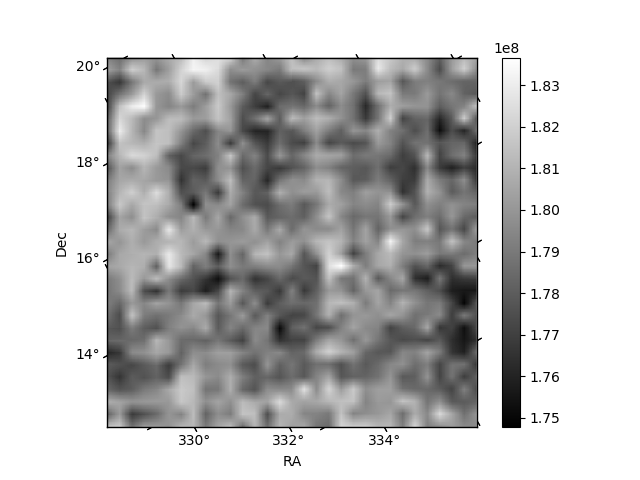
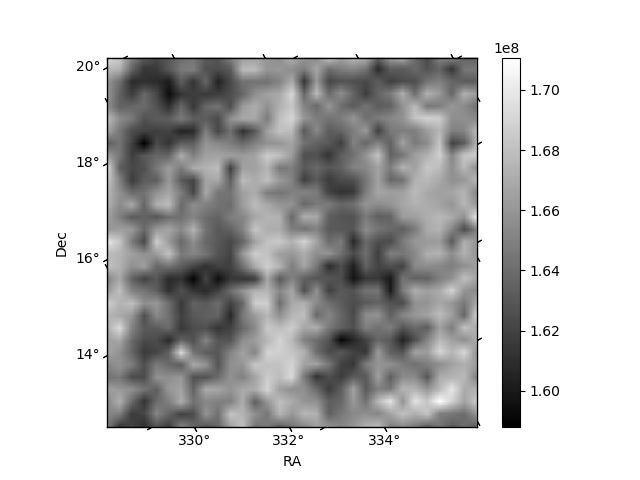
Histogram calculated using DETX and DETY for each event in the final _common_clean file
| Quadrant A | 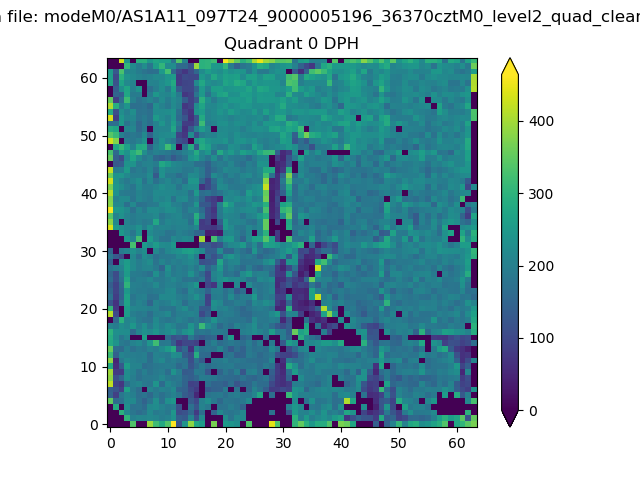 |
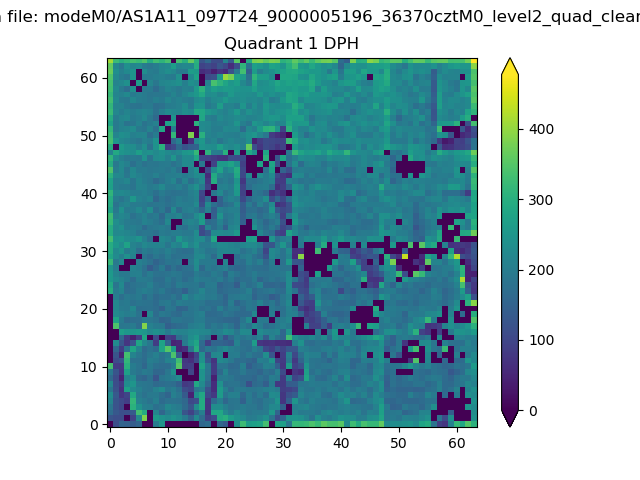 |
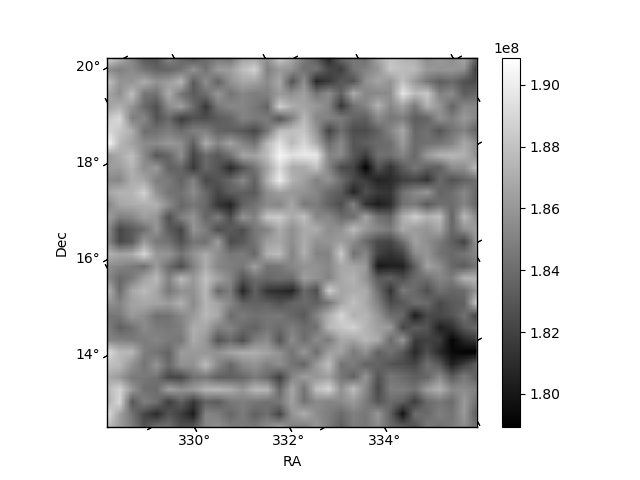
Quadrant B |
|---|---|---|---|
| Quadrant D | 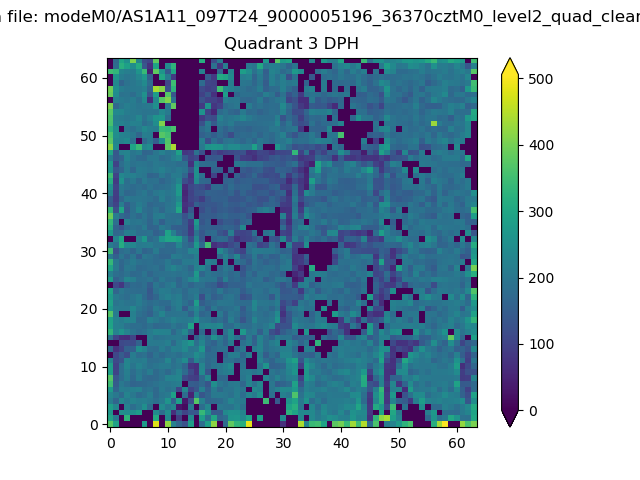 |
 |
Quadrant C |
| Plot type | Count rate plots | Images |
|---|---|---|
| Comparison with Poisson distribution Blue bars denote a histogram of data divided into 1 sec bins. Red curve is a Poisson curve with rate = median count rate of data. |
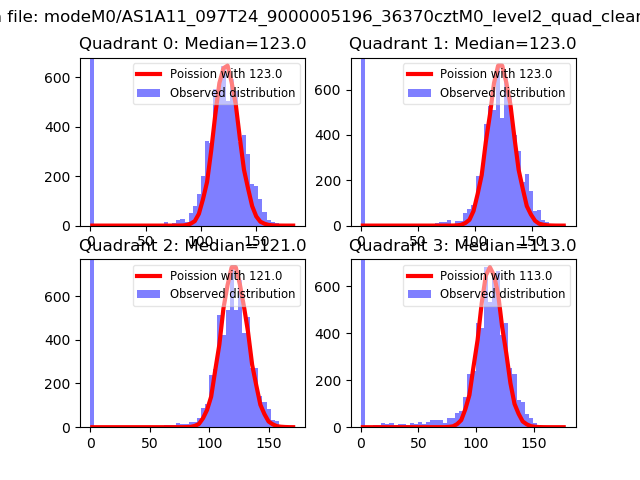 |
 |
| Quadrant-wise count rates Data is divided into 100 sec bins |
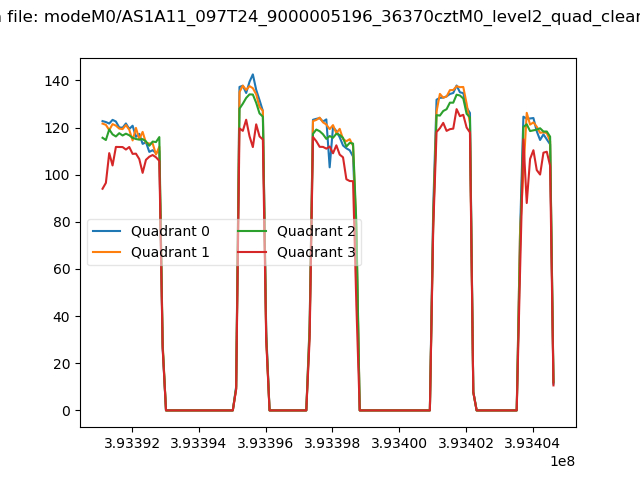 |
|
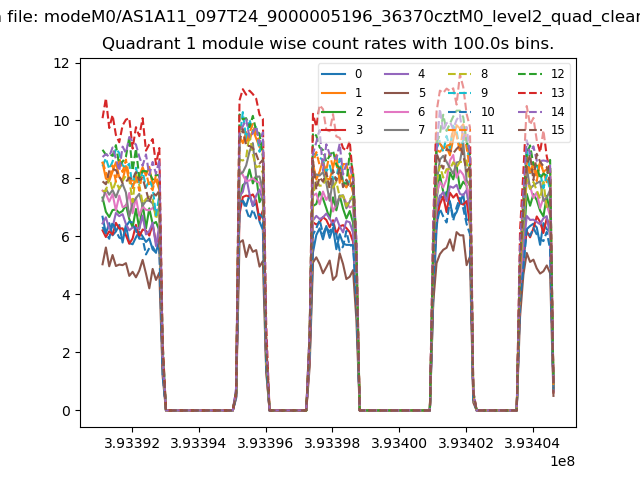
| Module-wise count rates for Quadrant A Data is divided into 100 sec bins |
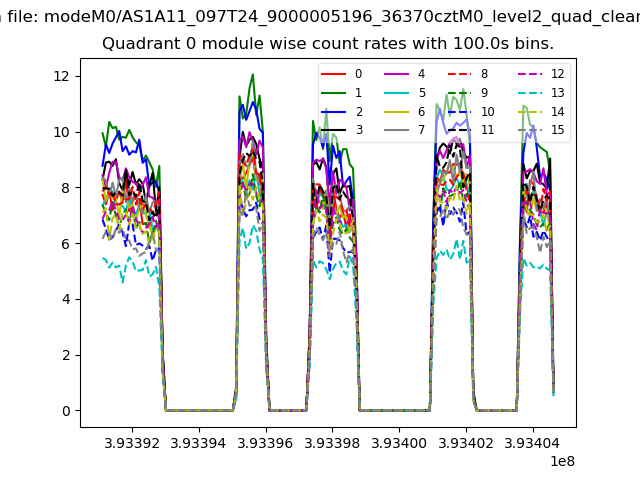 |
 |
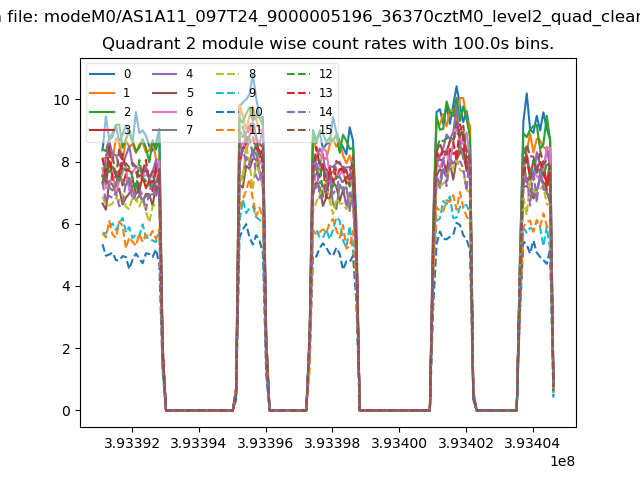
| Module-wise count rates for Quadrant B Data is divided into 100 sec bins |
 |
 |
| Module-wise count rates for Quadrant C Data is divided into 100 sec bins |
 |
 |
| Module-wise count rates for Quadrant D Data is divided into 100 sec bins |
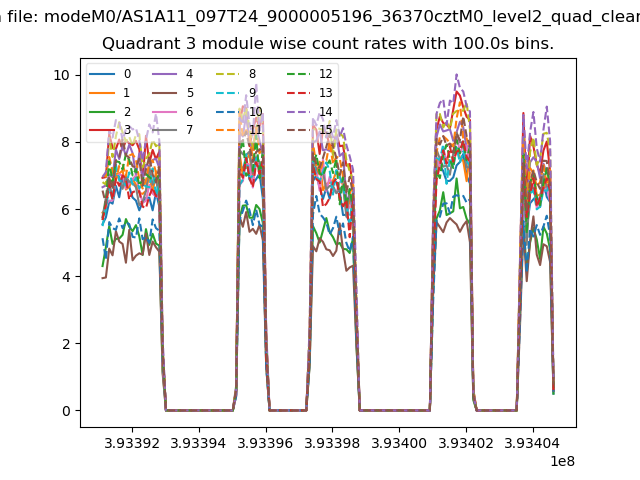 |
 |
| Parameter | Plot |
|---|---|
| CZT HV Monitor | 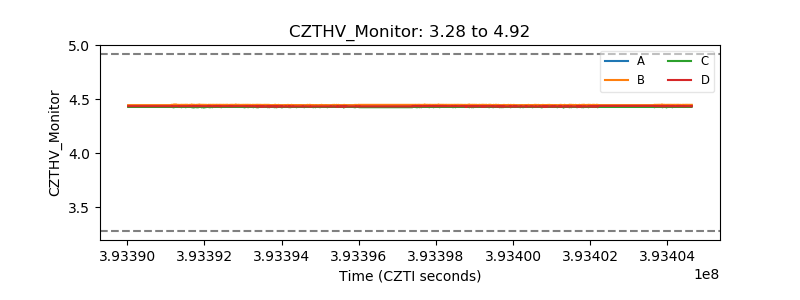 |
| D_VDD | 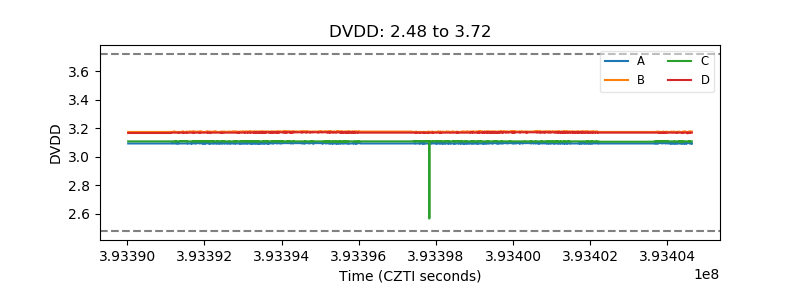 |
| Temperature 1 | 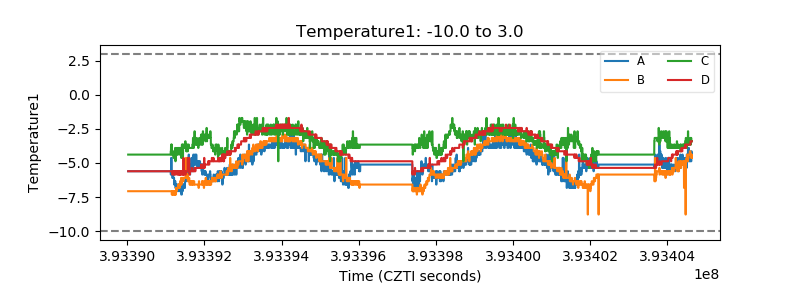 |
| Veto HV Monitor | 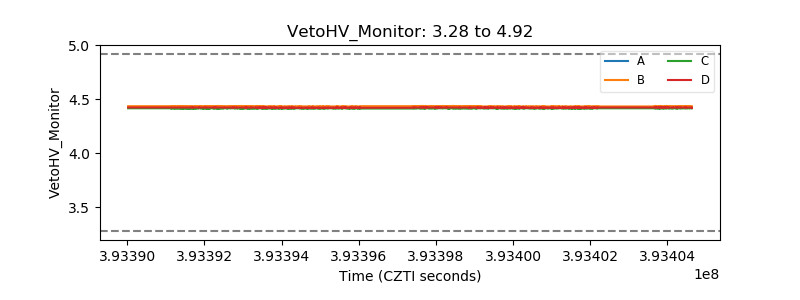 |
| Veto LLD | 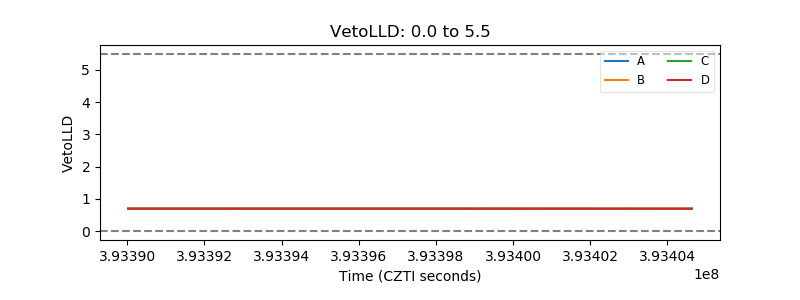 |
| Alpha Counter | 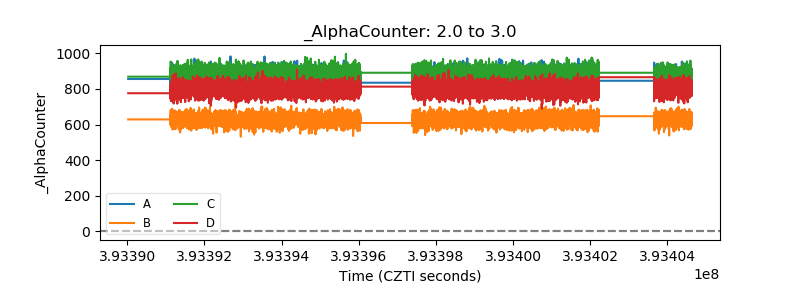 |
| _CPM_Rate | 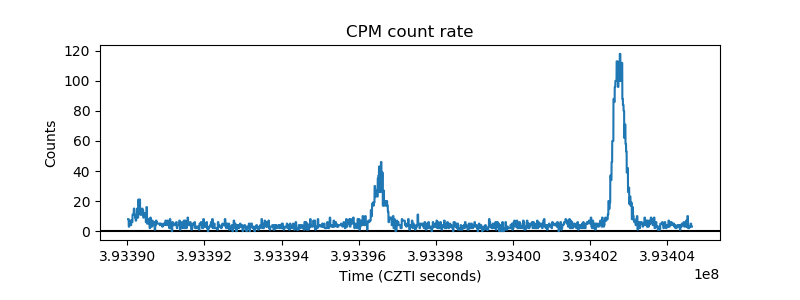 |
| CZT Counter | 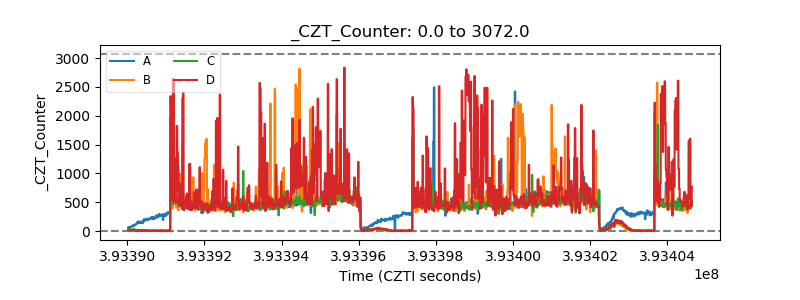 |
| +2.5 Volts monitor | 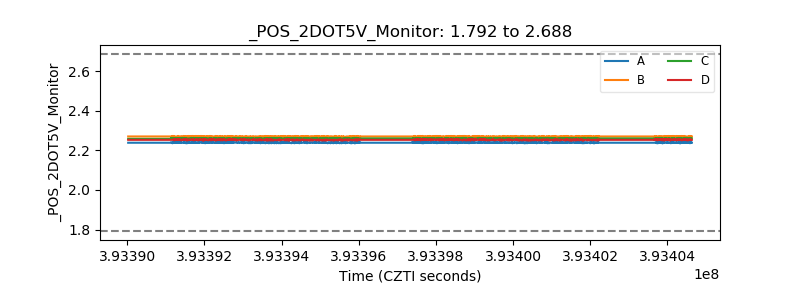 |
| +5 Volts monitor | 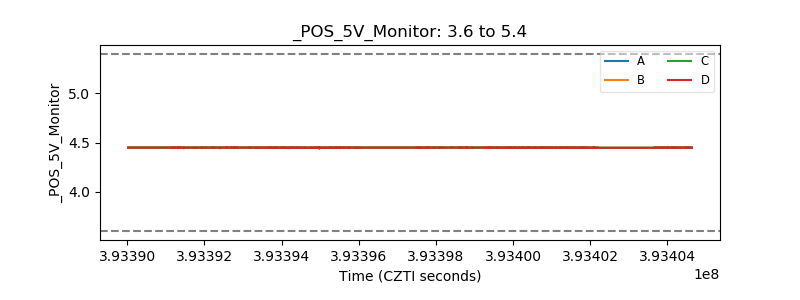 |
| _ROLL_ROT | 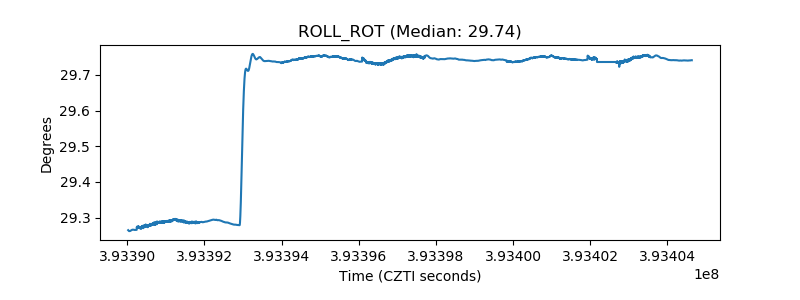 |
| _Roll_DEC | 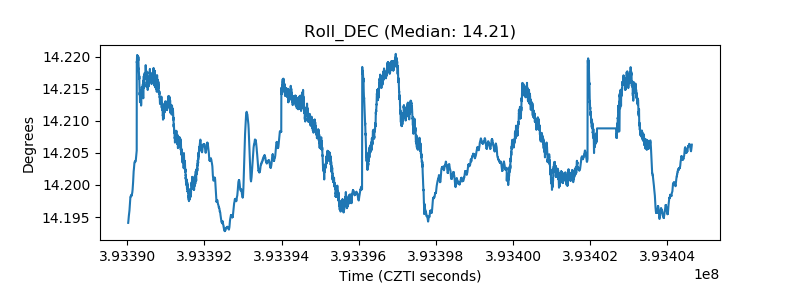 |
| _Roll_RA | 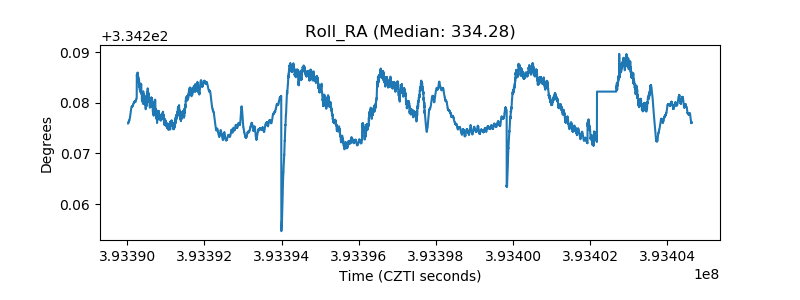 |
| Veto Counter | 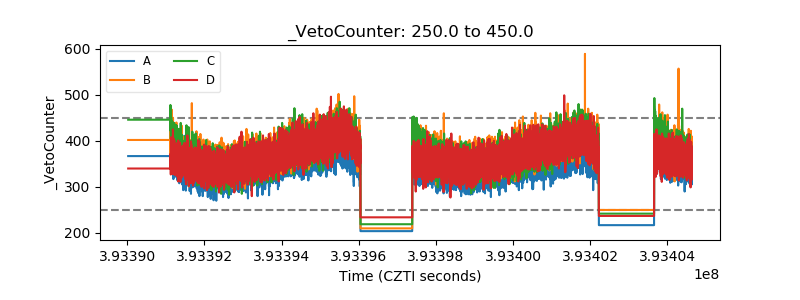 |