| Param | Original file | Final file |
|---|---|---|
| Filename | modeM0/AS1A11_097T24_9000005196_36368cztM0_level2.evt | modeM0/AS1A11_097T24_9000005196_36368cztM0_level2_quad_clean.evt |
| Size (bytes) | 466,473,600 | 72,100,800 |
| Size | 444.9 MB | 68.8 MB |
| Events in quadrant A | 2,899,787 | 455,708 |
| Events in quadrant B | 4,010,186 | 449,182 |
| Events in quadrant C | 3,020,375 | 439,216 |
| Events in quadrant D | 3,783,080 | 413,759 |
| Mode SS | |||
|---|---|---|---|
| Quadrant | BADHDUFLAG | Total packets | Discarded packets |
| A | 0 | 128 | 0 |
| B | 0 | 128 | 0 |
| C | 0 | 128 | 0 |
| D | 0 | 128 | 0 |
| Mode M9 | |||
|---|---|---|---|
| Quadrant | BADHDUFLAG | Total packets | Discarded packets |
| A | 0 | 26 | 0 |
| B | 0 | 26 | 0 |
| C | 0 | 26 | 0 |
| D | 0 | 26 | 0 |
| Mode M0 | |||
|---|---|---|---|
| Quadrant | BADHDUFLAG | Total packets | Discarded packets |
| A | 0 | 12540 | 3 |
| B | 0 | 15999 | 2 |
| C | 0 | 12770 | 2 |
| D | 0 | 15425 | 2 |
| Quadrant | Total seconds | Saturated seconds | Saturation percentage |
|---|---|---|---|
| A | 6083 | 11 | 0.180832% |
| B | 6083 | 325 | 5.342759% |
| C | 6083 | 23 | 0.378103% |
| D | 6083 | 201 | 3.304291% |
Noise dominated data is calculated using 1-second bins in cleaned event files. If a bin has >2000 counts, and if more than 50% of those come from <1% of pixels, then it is considered to be noise-dominated and hence unusable.
| Quadrant | # 1 sec bins | Bins with >0 counts | Bins with >2000 counts | High rate bins dominated by noise | Noise dominated (total time) | Noise dominated (detector-on time) | Marked lightcurve |
|---|---|---|---|---|---|---|---|
| A | 8709 | 6085 | 3 | 3 | 0.03% | 0.05% | 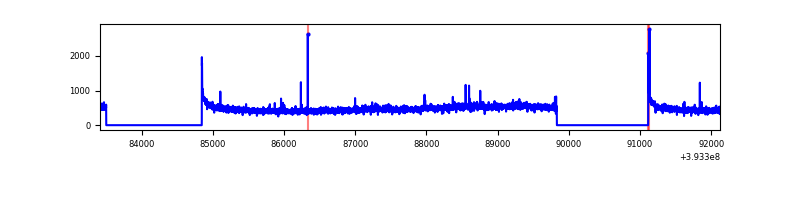 |
| B | 8709 | 6085 | 271 | 271 | 3.11% | 4.45% | 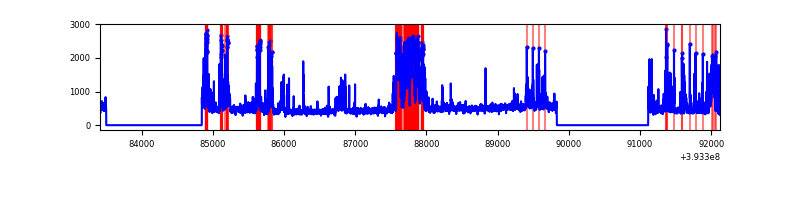 |
| C | 8709 | 6085 | 16 | 16 | 0.18% | 0.26% | 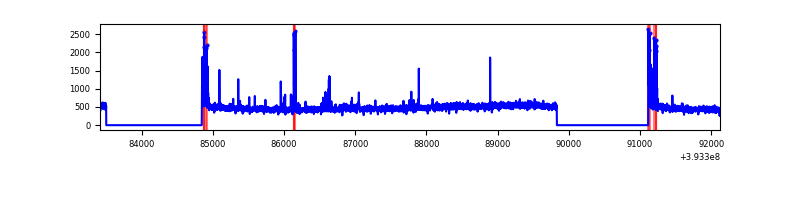 |
| D | 8709 | 6085 | 211 | 211 | 2.42% | 3.47% | 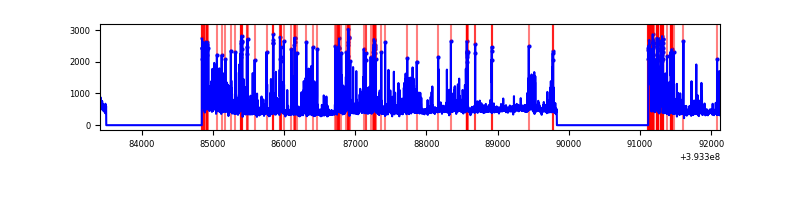 |
Top three noisy pixels from each quadrant. If the there are fewer than three noisy pixels in the level2.evt file, extra rows are filled as -1
| Pixel properties | Quadrant properties | ||||||
|---|---|---|---|---|---|---|---|
| Quadrant | DetID | PixID | Counts | Sigma | Mean | Median | Sigma |
| A | 10 | 83 | 195567 | 1412.03 | 685 | 674 | 138.0 |
| A | 12 | 189 | 25829 | 182.25 | 685 | 674 | 138.0 |
| A | 10 | 255 | 15612 | 108.23 | 685 | 674 | 138.0 |
| B | 5 | 172 | 1190144 | 9254.68 | 666 | 650 | 128.5 |
| B | 4 | 232 | 77584 | 598.57 | 666 | 650 | 128.5 |
| B | 5 | 236 | 36715 | 280.59 | 666 | 650 | 128.5 |
| C | 15 | 214 | 261273 | 1691.04 | 660 | 663 | 154.1 |
| C | 0 | 10 | 119349 | 770.13 | 660 | 663 | 154.1 |
| C | 0 | 207 | 65296 | 419.39 | 660 | 663 | 154.1 |
| D | 12 | 6 | 633624 | 3970.41 | 652 | 633 | 159.4 |
| D | 13 | 249 | 248252 | 1553.18 | 652 | 633 | 159.4 |
| D | 2 | 250 | 97927 | 610.27 | 652 | 633 | 159.4 |
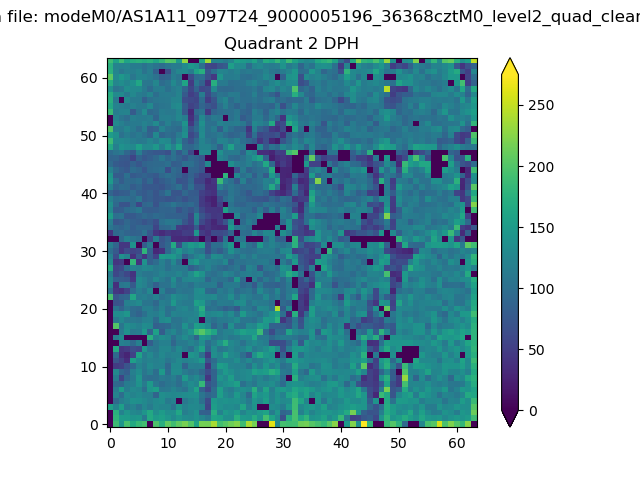
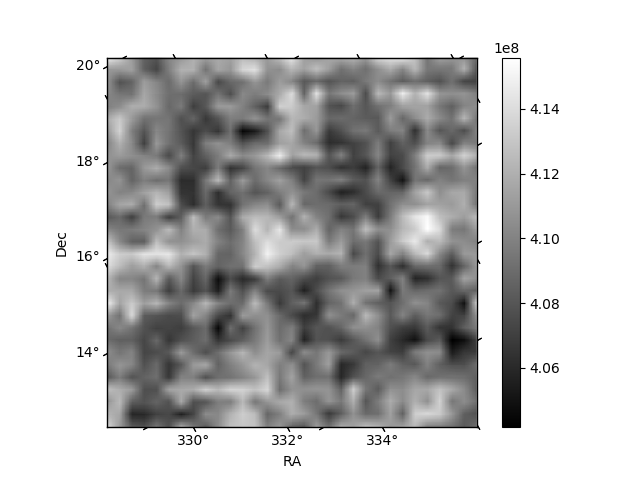
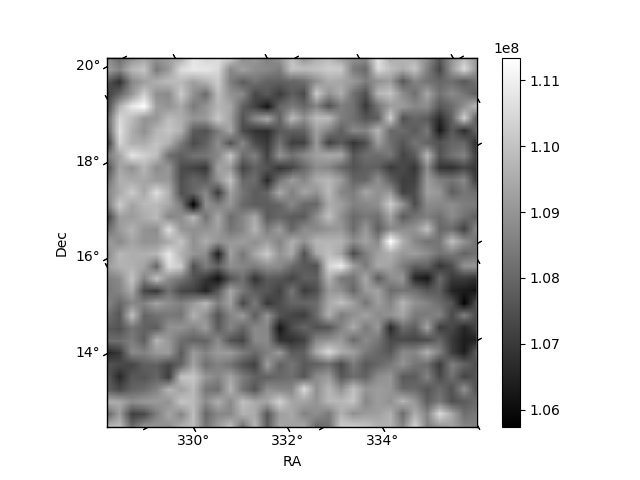
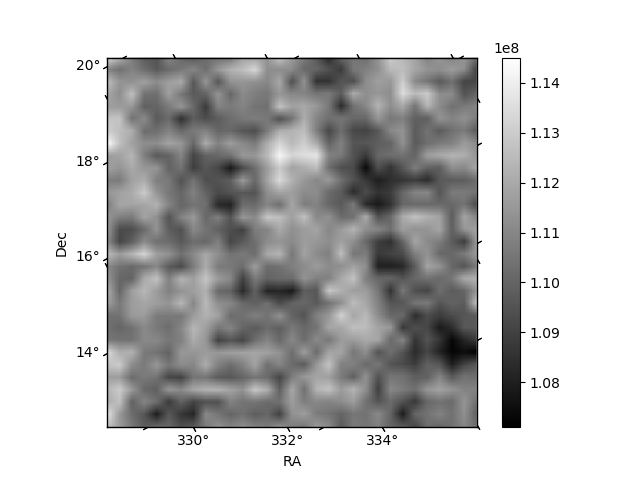
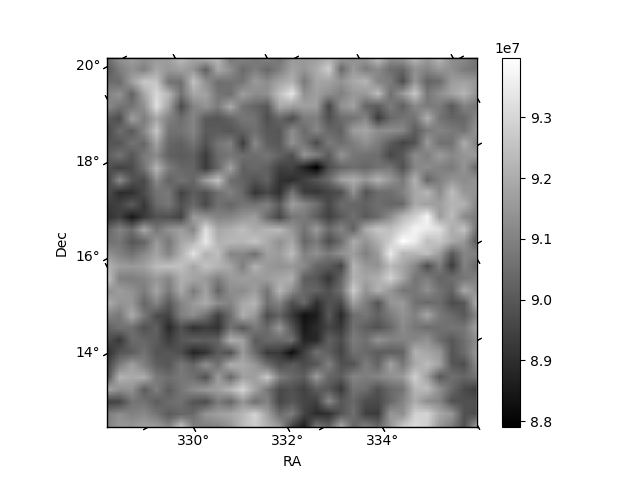
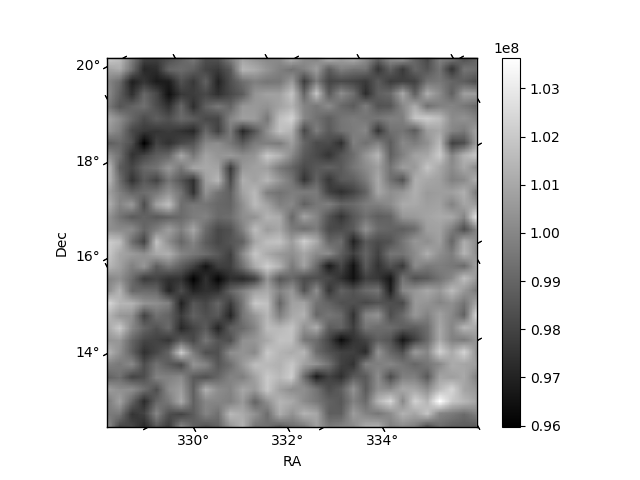
Histogram calculated using DETX and DETY for each event in the final _common_clean file
| Quadrant A | 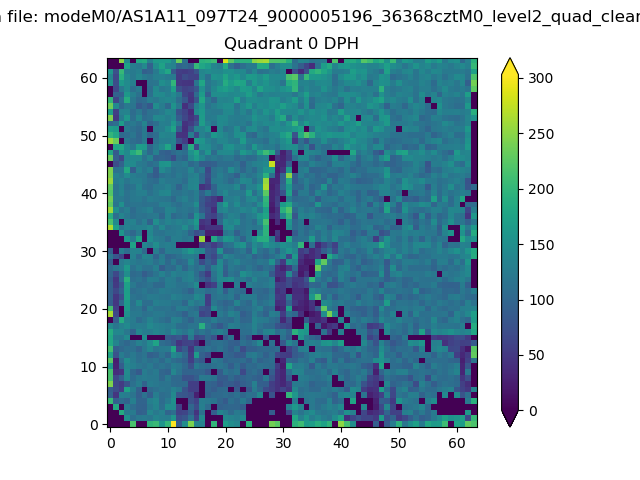 |
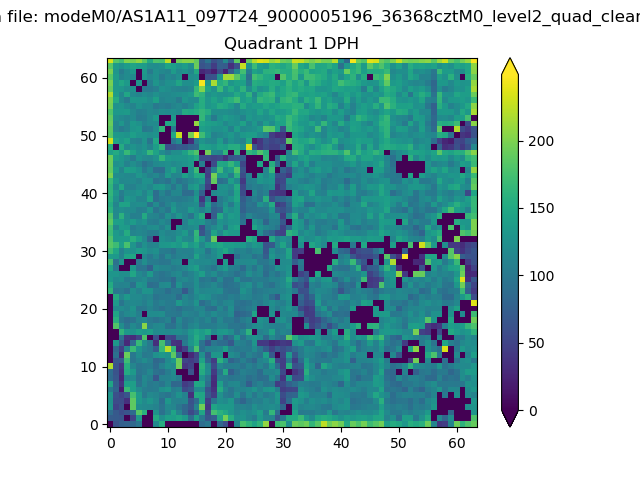 |
Quadrant B |
|---|---|---|---|
| Quadrant D | 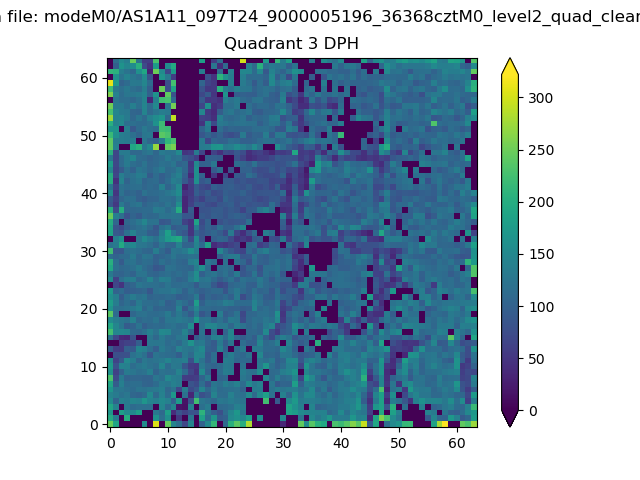 |
 |
Quadrant C |
| Plot type | Count rate plots | Images |
|---|---|---|
| Comparison with Poisson distribution Blue bars denote a histogram of data divided into 1 sec bins. Red curve is a Poisson curve with rate = median count rate of data. |
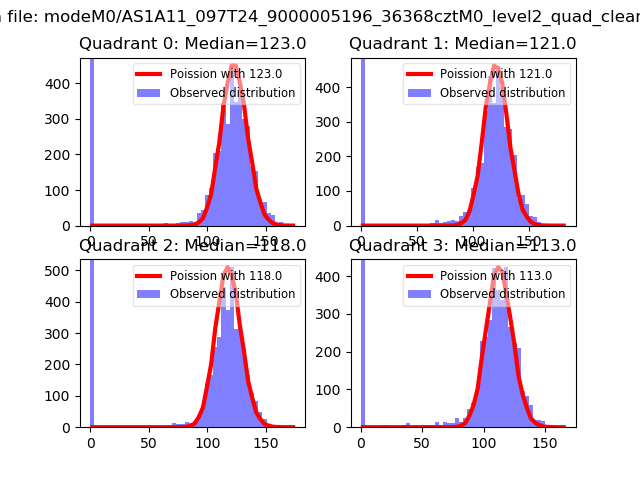 |
 |
| Quadrant-wise count rates Data is divided into 100 sec bins |
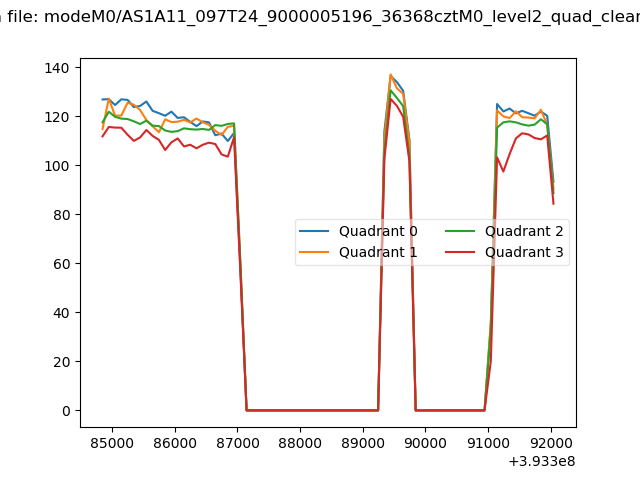 |
|
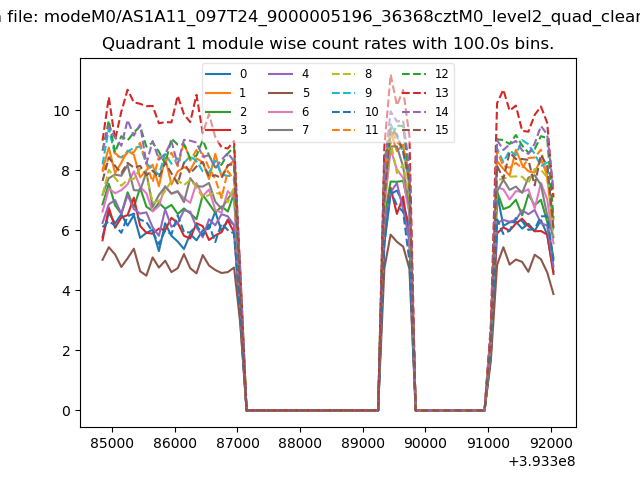
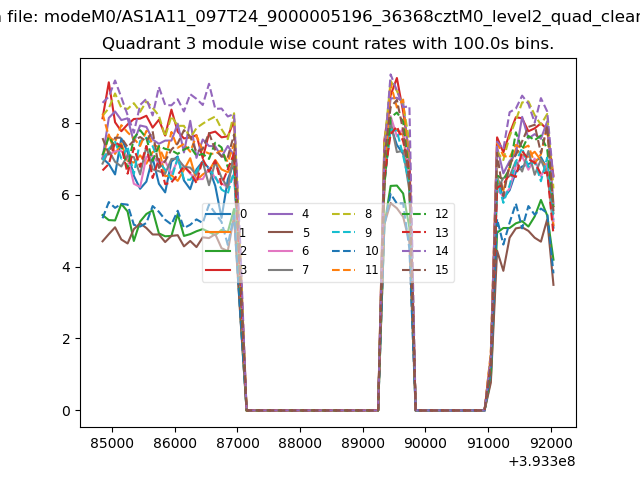
| Module-wise count rates for Quadrant A Data is divided into 100 sec bins |
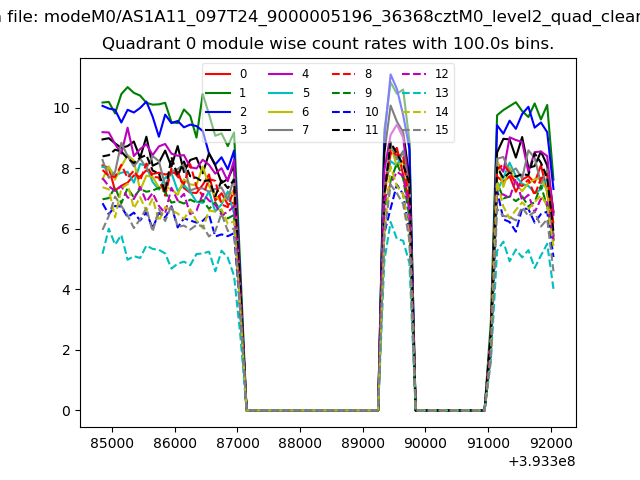 |
 |
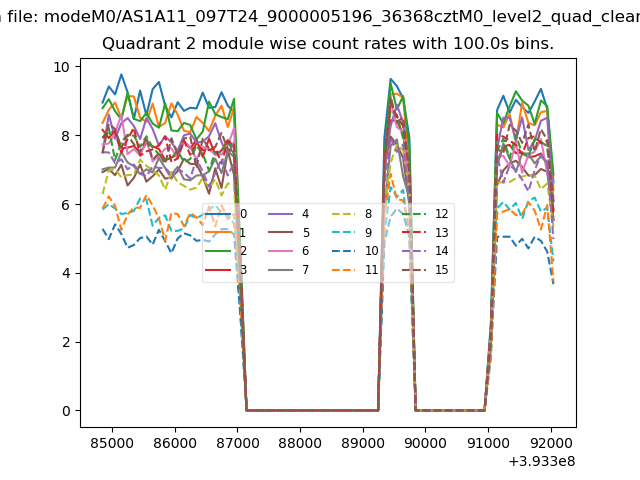
| Module-wise count rates for Quadrant B Data is divided into 100 sec bins |
 |
 |
| Module-wise count rates for Quadrant C Data is divided into 100 sec bins |
 |
 |
| Module-wise count rates for Quadrant D Data is divided into 100 sec bins |
 |
 |
| Parameter | Plot |
|---|---|
| CZT HV Monitor | 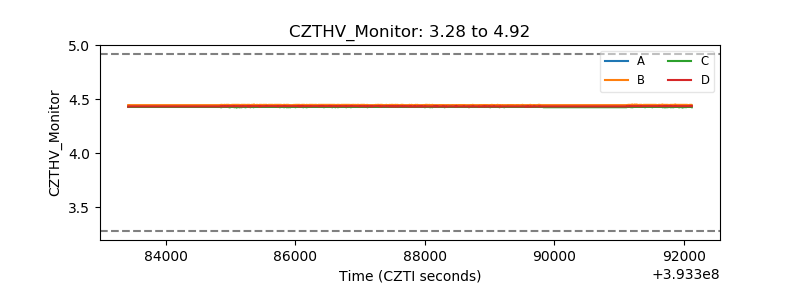 |
| D_VDD | 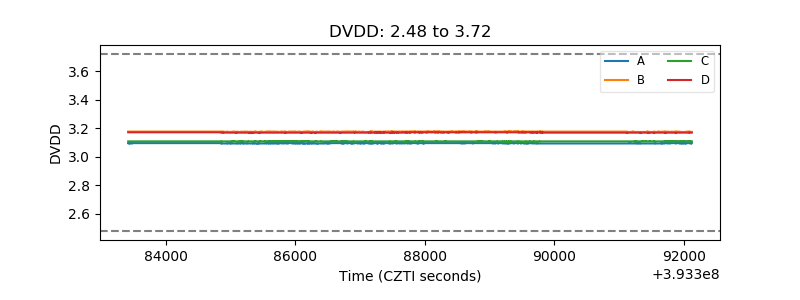 |
| Temperature 1 | 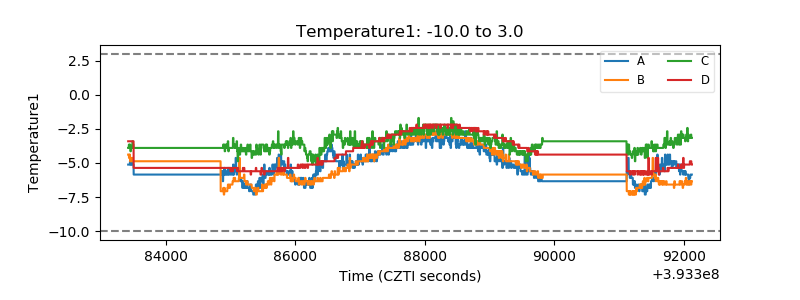 |
| Veto HV Monitor | 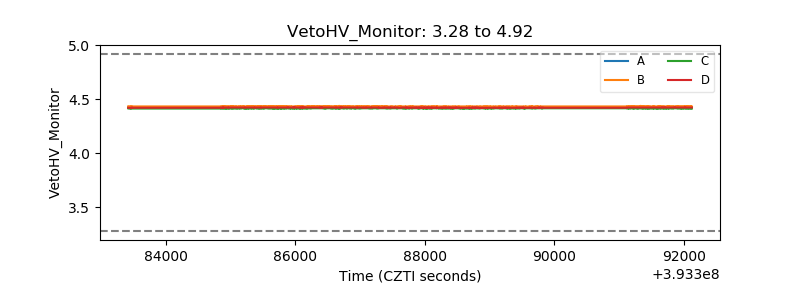 |
| Veto LLD | 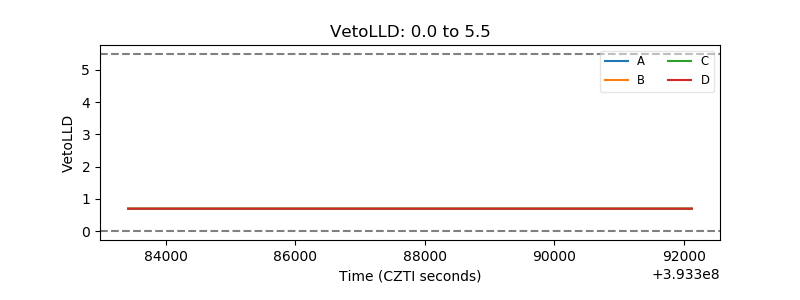 |
| Alpha Counter | 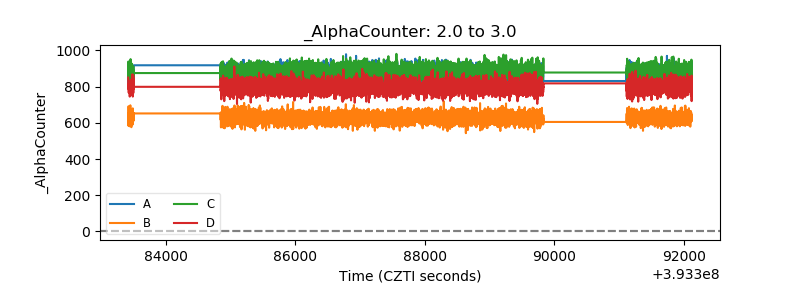 |
| _CPM_Rate | 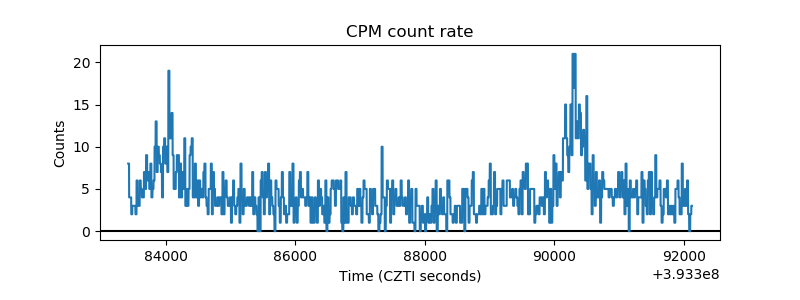 |
| CZT Counter | 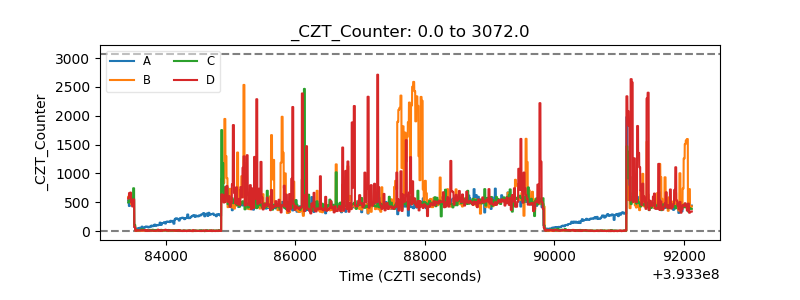 |
| +2.5 Volts monitor | 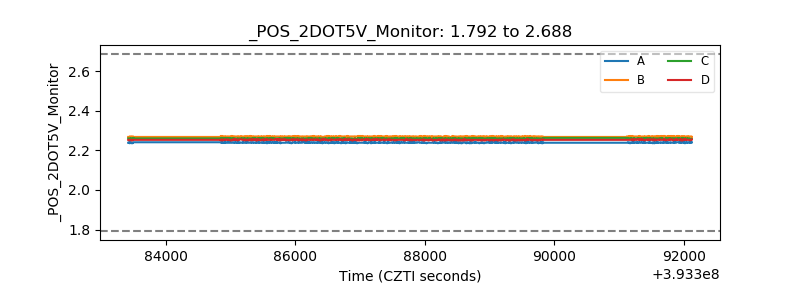 |
| +5 Volts monitor | 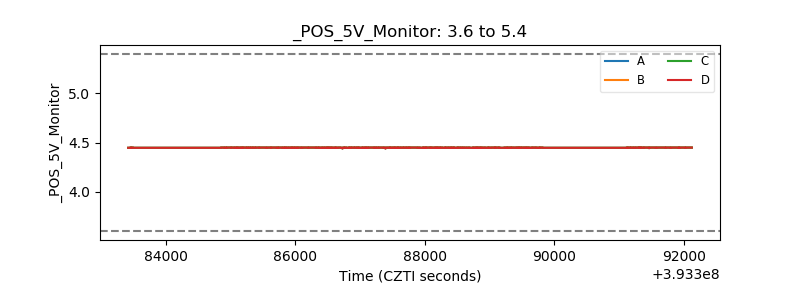 |
| _ROLL_ROT | 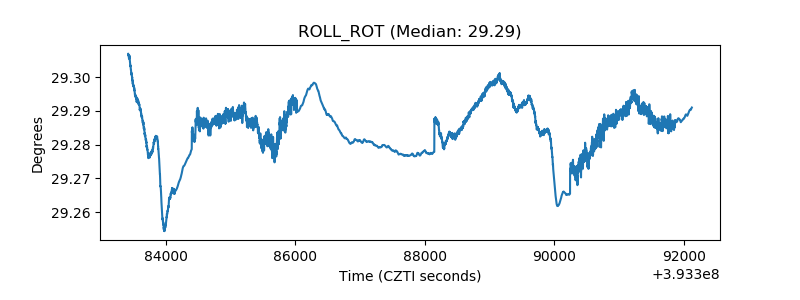 |
| _Roll_DEC | 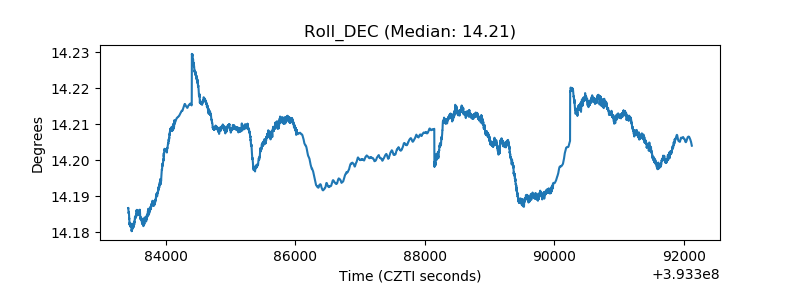 |
| _Roll_RA | 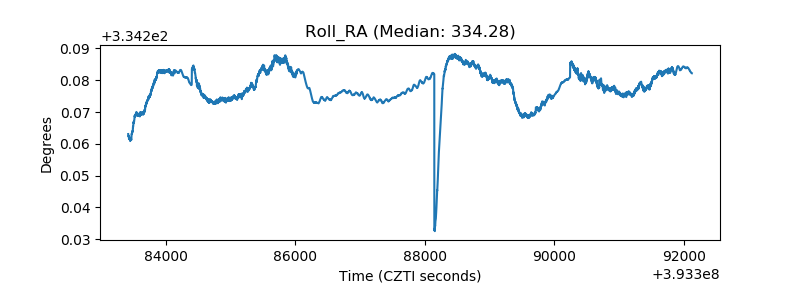 |
| Veto Counter | 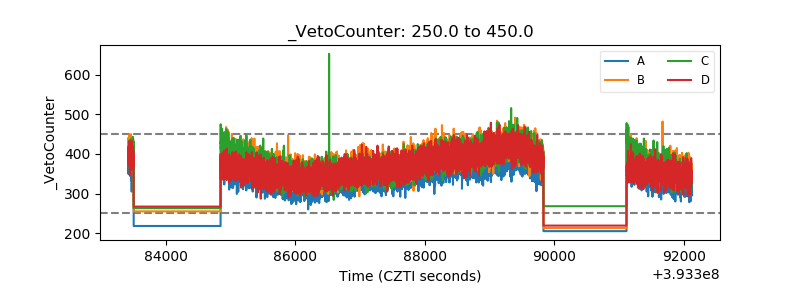 |