| Param | Original file | Final file |
|---|---|---|
| Filename | modeM0/AS1C07_001T08_9000005190_36341cztM0_level2.evt | modeM0/AS1C07_001T08_9000005190_36341cztM0_level2_quad_clean.evt |
| Size (bytes) | 736,764,480 | 135,017,280 |
| Size | 702.6 MB | 128.8 MB |
| Events in quadrant A | 4,491,863 | 869,498 |
| Events in quadrant B | 6,318,332 | 856,733 |
| Events in quadrant C | 4,728,265 | 871,529 |
| Events in quadrant D | 6,123,326 | 824,705 |
| Mode M9 | |||
|---|---|---|---|
| Quadrant | BADHDUFLAG | Total packets | Discarded packets |
| A | 0 | 24 | 0 |
| B | 0 | 23 | 0 |
| C | 0 | 23 | 0 |
| D | 0 | 23 | 0 |
| Mode M0 | |||
|---|---|---|---|
| Quadrant | BADHDUFLAG | Total packets | Discarded packets |
| A | 0 | 19646 | 1 |
| B | 0 | 25092 | 1 |
| C | 0 | 19993 | 1 |
| D | 0 | 24666 | 1 |
| Mode SS | |||
|---|---|---|---|
| Quadrant | BADHDUFLAG | Total packets | Discarded packets |
| A | 0 | 194 | 0 |
| B | 0 | 194 | 0 |
| C | 0 | 194 | 0 |
| D | 0 | 194 | 0 |
| Quadrant | Total seconds | Saturated seconds | Saturation percentage |
|---|---|---|---|
| A | 9625 | 29 | 0.301299% |
| B | 9625 | 482 | 5.007792% |
| C | 9625 | 25 | 0.259740% |
| D | 9625 | 417 | 4.332468% |
Noise dominated data is calculated using 1-second bins in cleaned event files. If a bin has >2000 counts, and if more than 50% of those come from <1% of pixels, then it is considered to be noise-dominated and hence unusable.
| Quadrant | # 1 sec bins | Bins with >0 counts | Bins with >2000 counts | High rate bins dominated by noise | Noise dominated (total time) | Noise dominated (detector-on time) | Marked lightcurve |
|---|---|---|---|---|---|---|---|
| A | 10967 | 9626 | 13 | 13 | 0.12% | 0.14% | 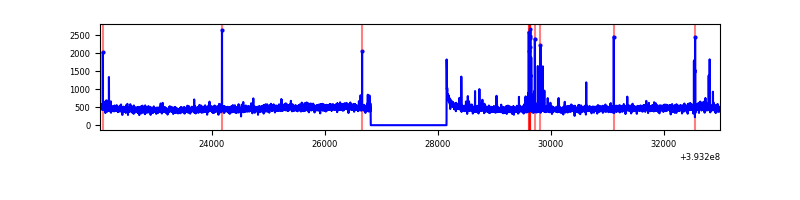 |
| B | 10967 | 9626 | 414 | 414 | 3.77% | 4.30% | 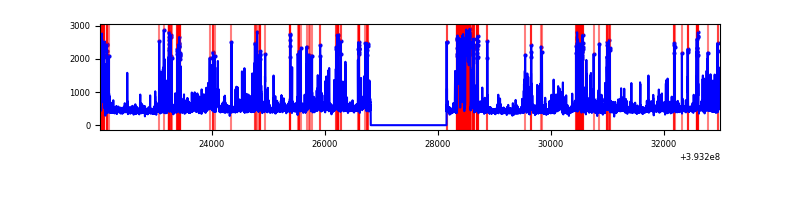 |
| C | 10967 | 9626 | 17 | 17 | 0.16% | 0.18% | 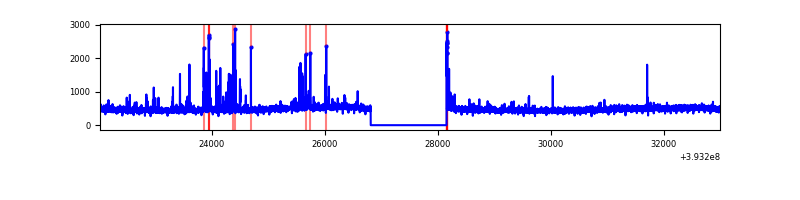 |
| D | 10967 | 9626 | 414 | 414 | 3.77% | 4.30% | 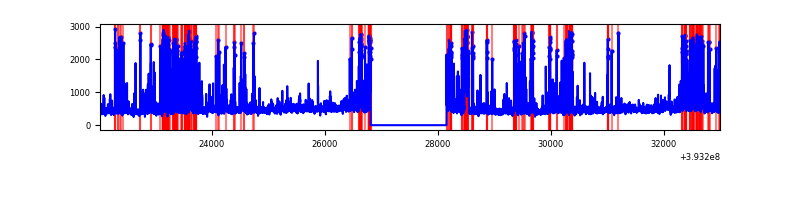 |
Top three noisy pixels from each quadrant. If the there are fewer than three noisy pixels in the level2.evt file, extra rows are filled as -1
| Pixel properties | Quadrant properties | ||||||
|---|---|---|---|---|---|---|---|
| Quadrant | DetID | PixID | Counts | Sigma | Mean | Median | Sigma |
| A | 10 | 83 | 242387 | 1126.91 | 1067 | 1047 | 214.2 |
| A | 9 | 143 | 84177 | 388.17 | 1067 | 1047 | 214.2 |
| A | 13 | 254 | 17417 | 76.44 | 1067 | 1047 | 214.2 |
| B | 5 | 172 | 1105248 | 5592.65 | 1037 | 1008 | 197.4 |
| B | 5 | 236 | 470936 | 2380.05 | 1037 | 1008 | 197.4 |
| B | 5 | 255 | 222580 | 1122.2 | 1037 | 1008 | 197.4 |
| C | 15 | 214 | 405163 | 1651.93 | 1049 | 1055 | 244.6 |
| C | 0 | 207 | 140819 | 571.33 | 1049 | 1055 | 244.6 |
| C | 0 | 10 | 59184 | 237.62 | 1049 | 1055 | 244.6 |
| D | 12 | 6 | 1368761 | 5451.19 | 1030 | 1001 | 250.9 |
| D | 2 | 153 | 152757 | 604.82 | 1030 | 1001 | 250.9 |
| D | 2 | 250 | 98622 | 389.07 | 1030 | 1001 | 250.9 |
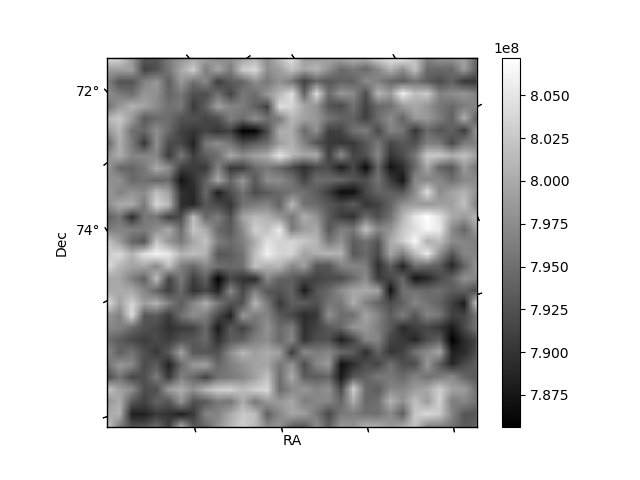
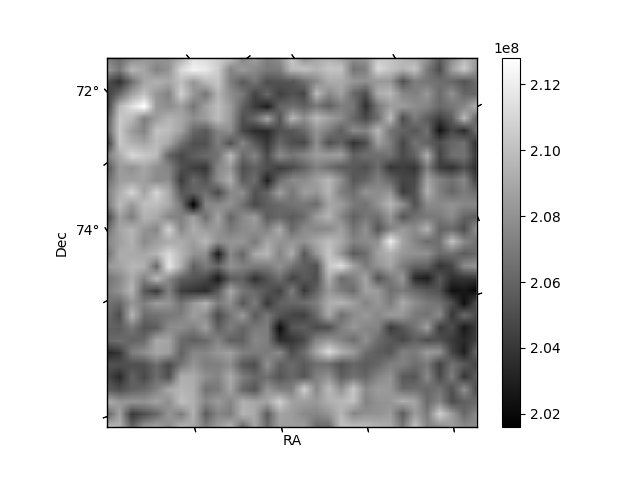
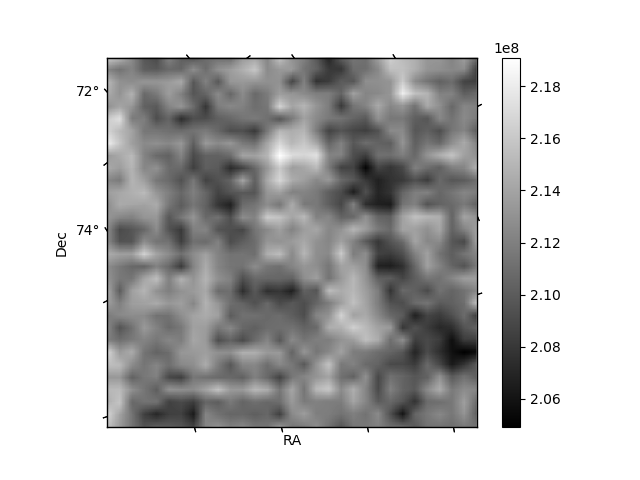
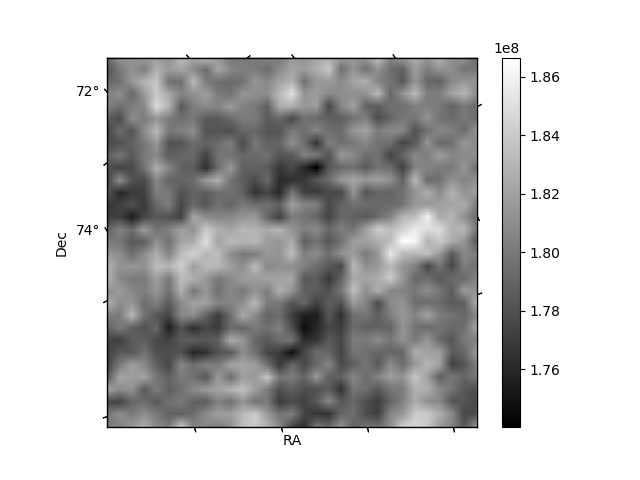
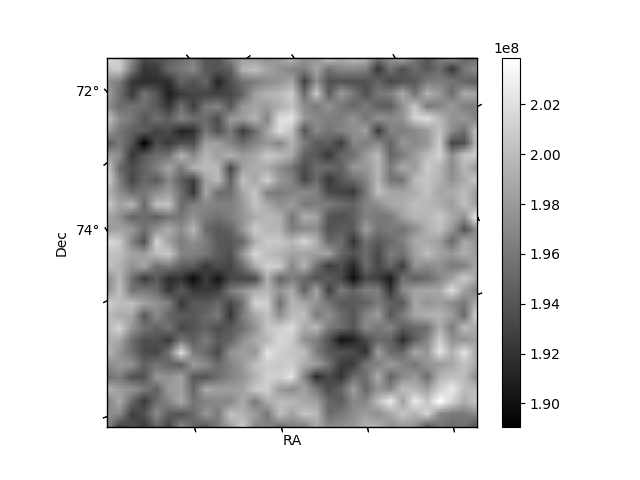
Histogram calculated using DETX and DETY for each event in the final _common_clean file
| Quadrant A | 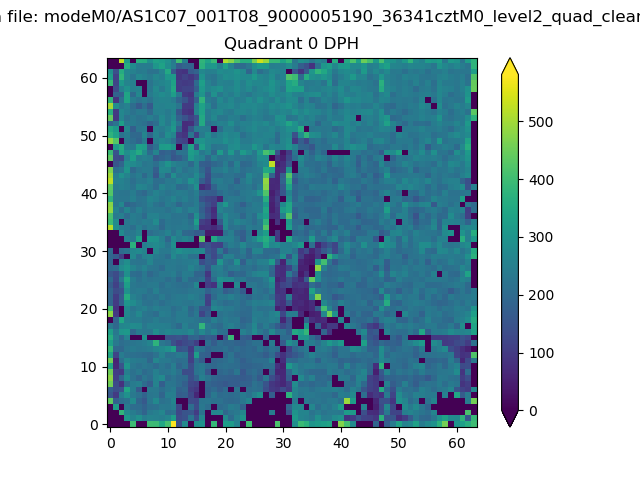 |
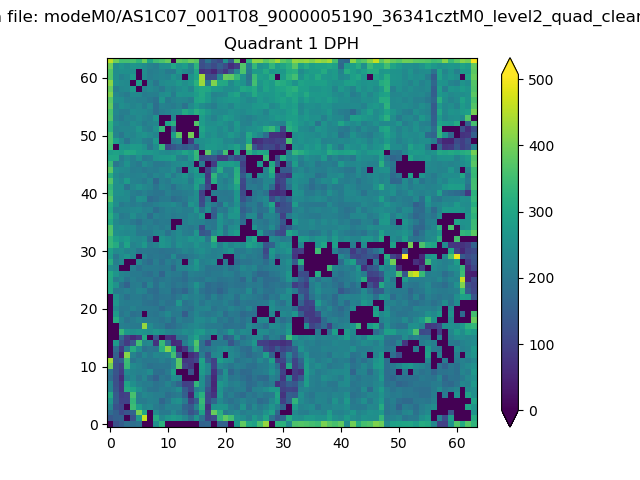 |
Quadrant B |
|---|---|---|---|
| Quadrant D | 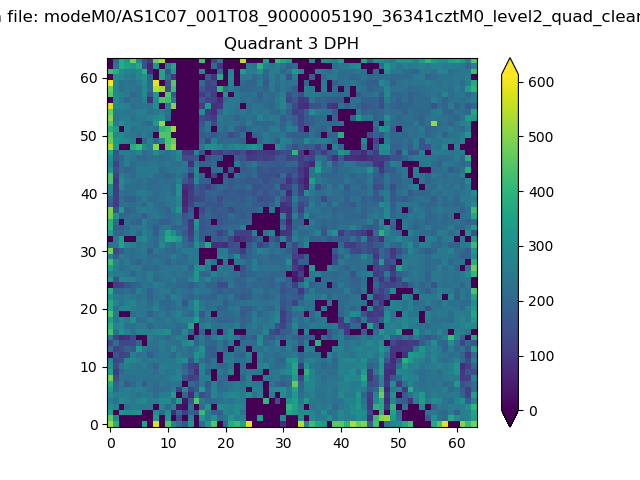 |
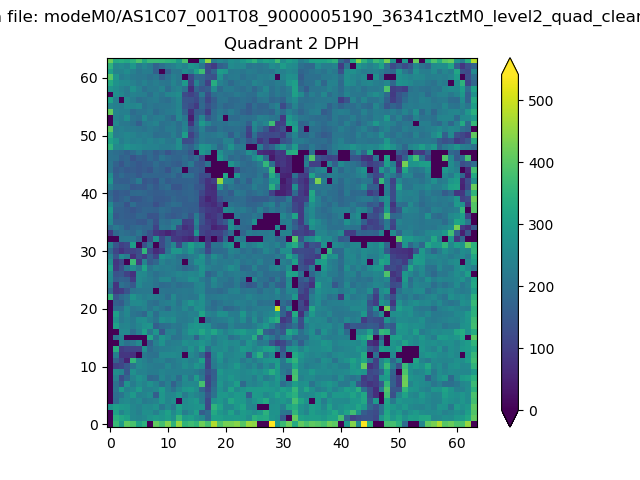 |
Quadrant C |
| Plot type | Count rate plots | Images |
|---|---|---|
| Comparison with Poisson distribution Blue bars denote a histogram of data divided into 1 sec bins. Red curve is a Poisson curve with rate = median count rate of data. |
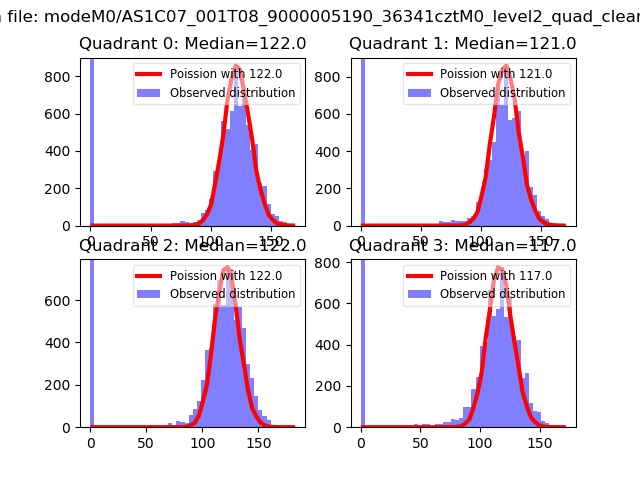 |
 |
| Quadrant-wise count rates Data is divided into 100 sec bins |
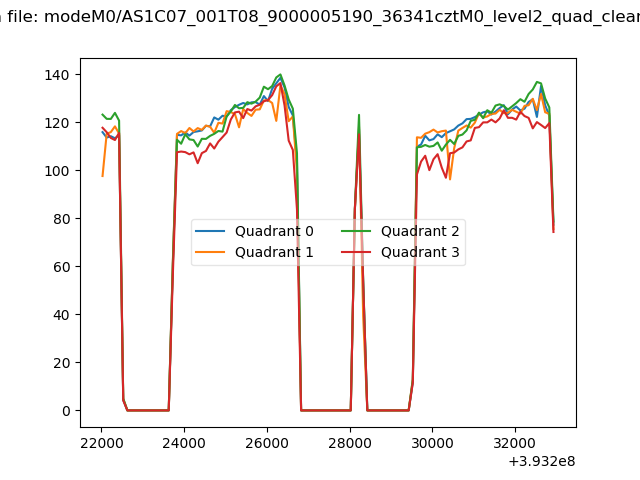 |
|
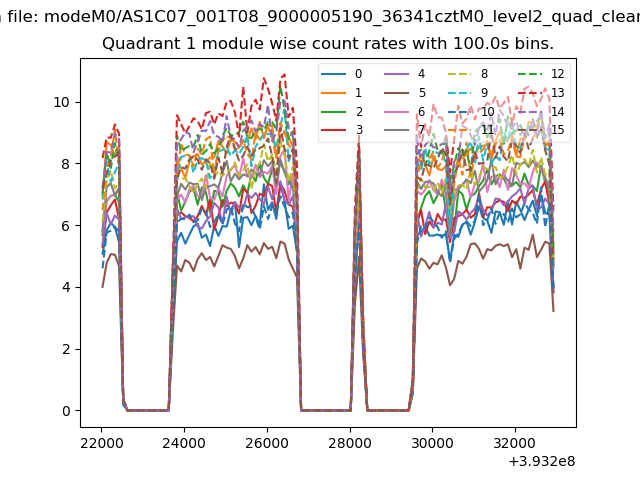
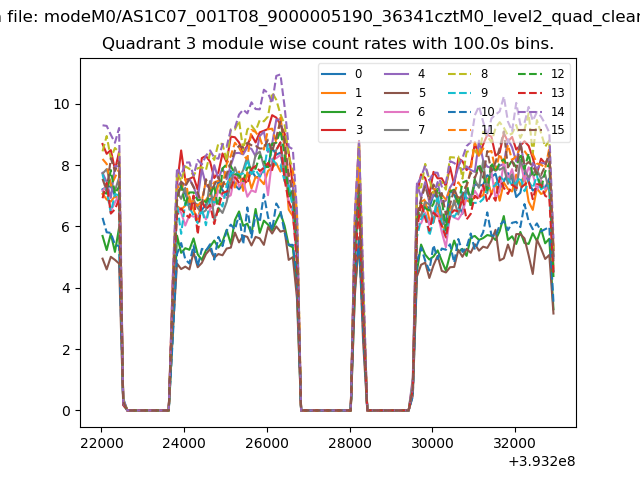
| Module-wise count rates for Quadrant A Data is divided into 100 sec bins |
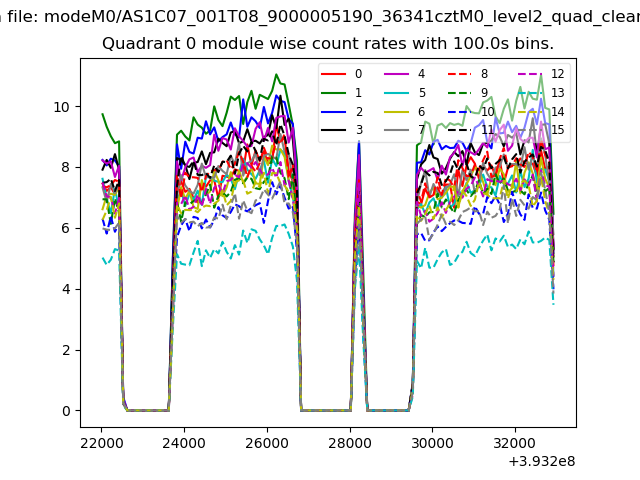 |
 |
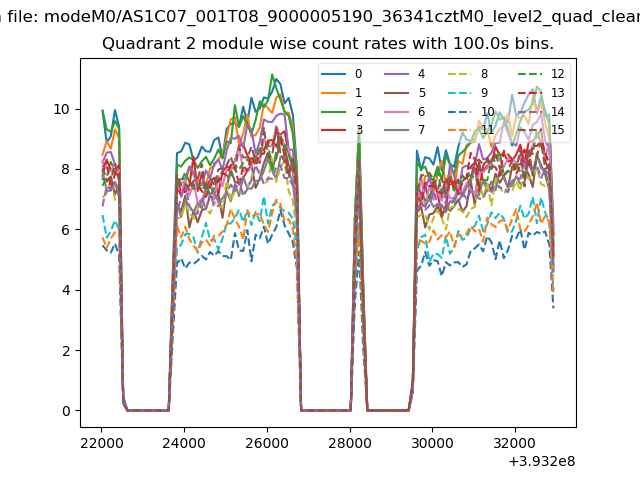
| Module-wise count rates for Quadrant B Data is divided into 100 sec bins |
 |
 |
| Module-wise count rates for Quadrant C Data is divided into 100 sec bins |
 |
 |
| Module-wise count rates for Quadrant D Data is divided into 100 sec bins |
 |
 |
| Parameter | Plot |
|---|---|
| CZT HV Monitor | 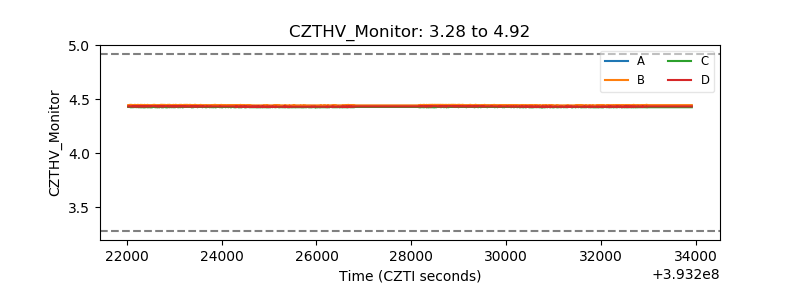 |
| D_VDD | 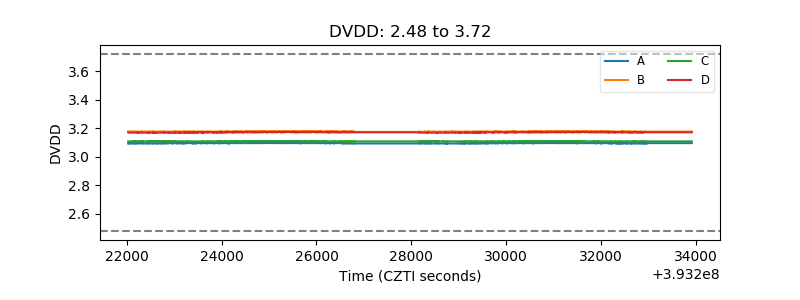 |
| Temperature 1 | 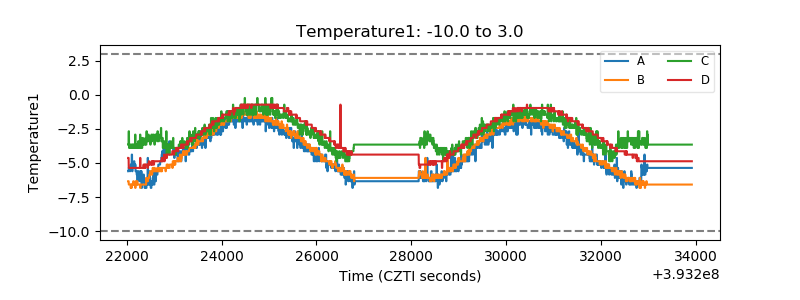 |
| Veto HV Monitor | 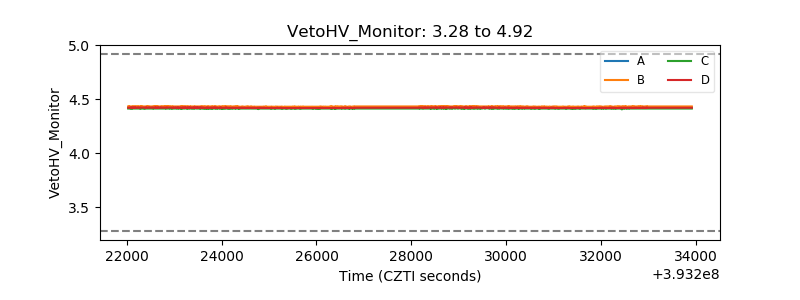 |
| Veto LLD | 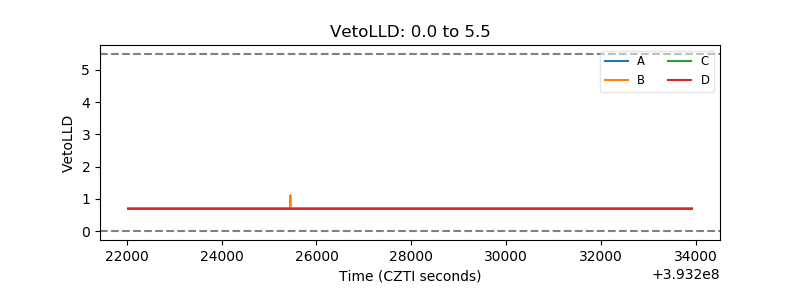 |
| Alpha Counter | 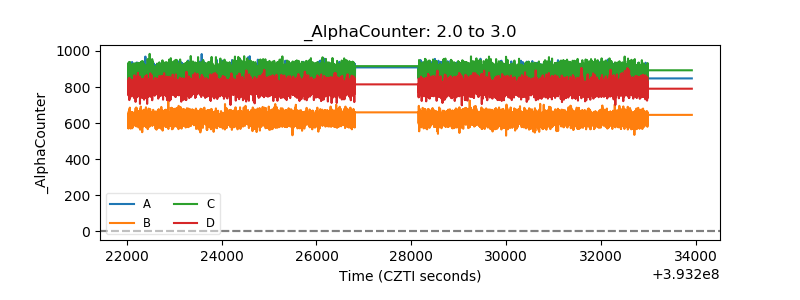 |
| _CPM_Rate | 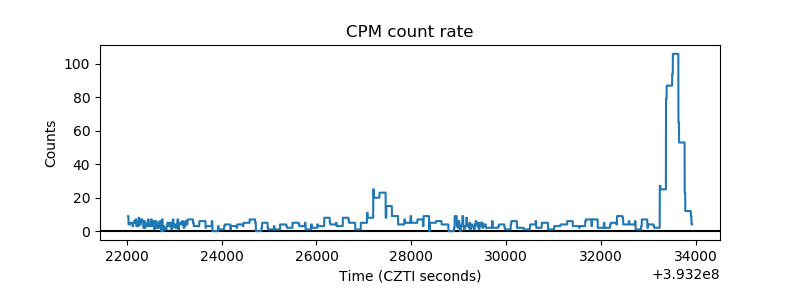 |
| CZT Counter | 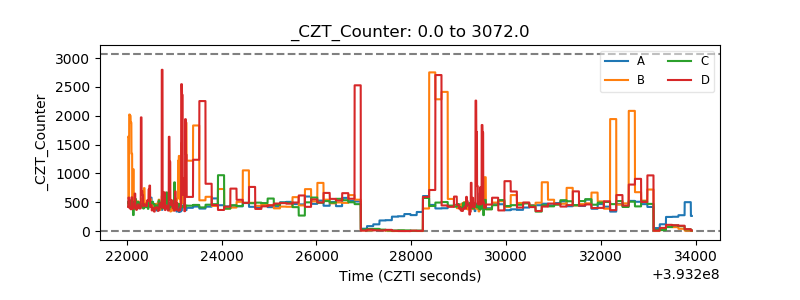 |
| +2.5 Volts monitor | 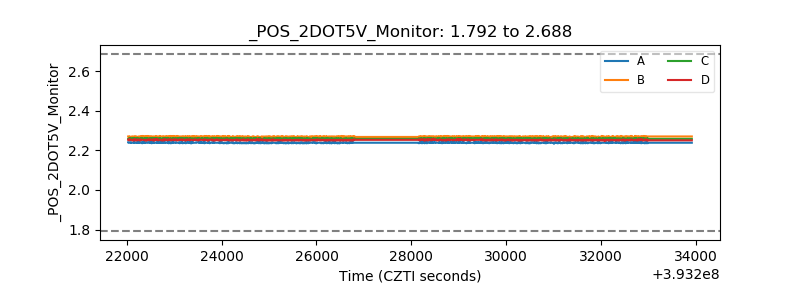 |
| +5 Volts monitor | 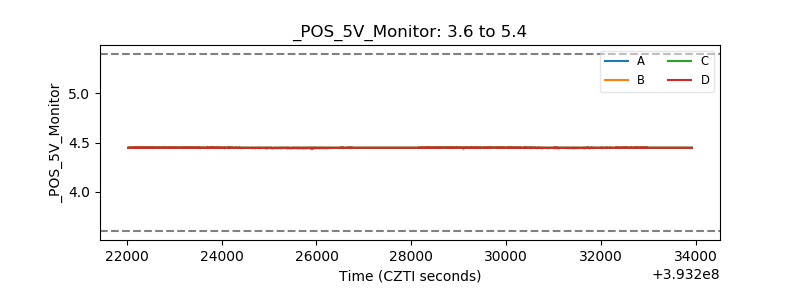 |
| _ROLL_ROT | 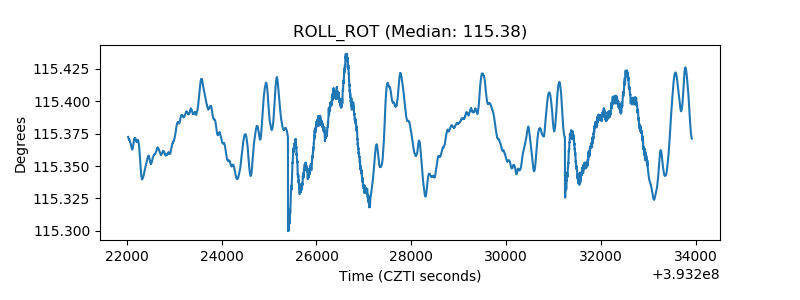 |
| _Roll_DEC | 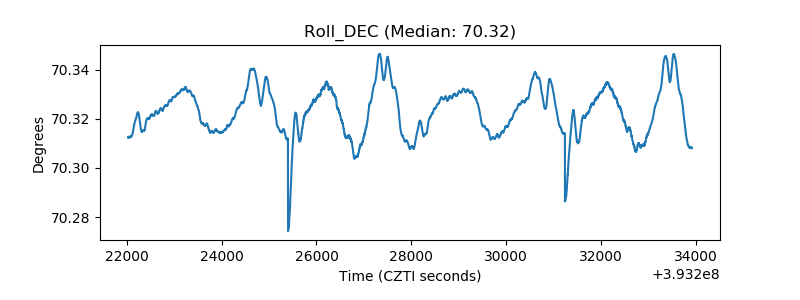 |
| _Roll_RA | 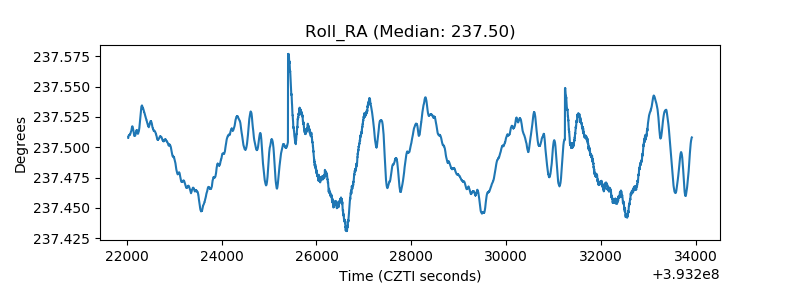 |
| Veto Counter | 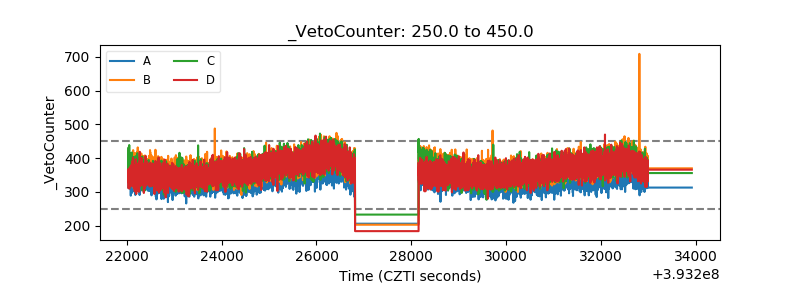 |