| Param | Original file | Final file |
|---|---|---|
| Filename | modeM0/AS1C07_001T08_9000005190_36337cztM0_level2.evt | modeM0/AS1C07_001T08_9000005190_36337cztM0_level2_quad_clean.evt |
| Size (bytes) | 181,031,040 | 41,592,960 |
| Size | 172.6 MB | 39.7 MB |
| Events in quadrant A | 1,139,349 | 280,435 |
| Events in quadrant B | 1,552,883 | 272,586 |
| Events in quadrant C | 1,207,040 | 278,599 |
| Events in quadrant D | 1,429,281 | 266,249 |
| Mode M9 | |||
|---|---|---|---|
| Quadrant | BADHDUFLAG | Total packets | Discarded packets |
| A | 0 | 16 | 0 |
| B | 0 | 16 | 0 |
| C | 0 | 16 | 0 |
| D | 0 | 16 | 0 |
| Mode M0 | |||
|---|---|---|---|
| Quadrant | BADHDUFLAG | Total packets | Discarded packets |
| A | 0 | 4740 | 2 |
| B | 0 | 6108 | 1 |
| C | 0 | 4877 | 1 |
| D | 0 | 5782 | 1 |
| Mode SS | |||
|---|---|---|---|
| Quadrant | BADHDUFLAG | Total packets | Discarded packets |
| A | 0 | 46 | 0 |
| B | 0 | 46 | 0 |
| C | 0 | 46 | 0 |
| D | 0 | 46 | 0 |
| Quadrant | Total seconds | Saturated seconds | Saturation percentage |
|---|---|---|---|
| A | 2235 | 9 | 0.402685% |
| B | 2235 | 143 | 6.398210% |
| C | 2235 | 40 | 1.789709% |
| D | 2235 | 52 | 2.326622% |
Noise dominated data is calculated using 1-second bins in cleaned event files. If a bin has >2000 counts, and if more than 50% of those come from <1% of pixels, then it is considered to be noise-dominated and hence unusable.
| Quadrant | # 1 sec bins | Bins with >0 counts | Bins with >2000 counts | High rate bins dominated by noise | Noise dominated (total time) | Noise dominated (detector-on time) | Marked lightcurve |
|---|---|---|---|---|---|---|---|
| A | 3817 | 2236 | 5 | 5 | 0.13% | 0.22% | 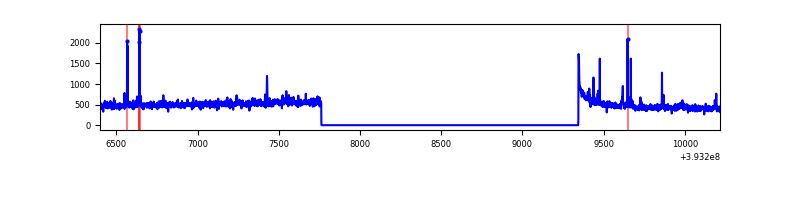 |
| B | 3817 | 2236 | 81 | 81 | 2.12% | 3.62% | 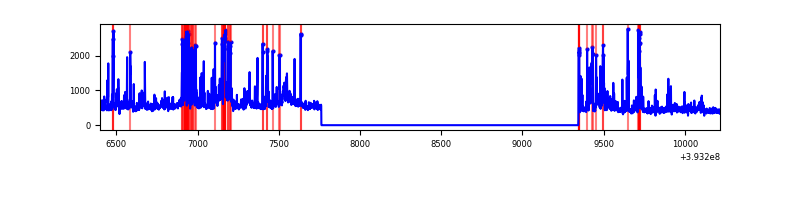 |
| C | 3817 | 2236 | 28 | 28 | 0.73% | 1.25% | 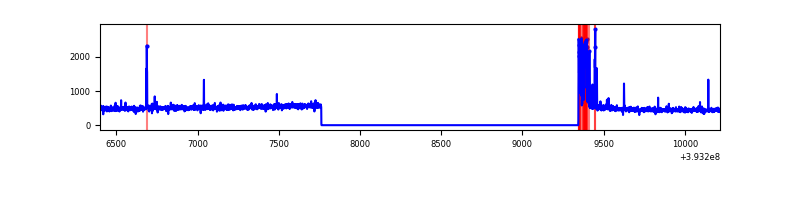 |
| D | 3816 | 2235 | 50 | 50 | 1.31% | 2.24% | 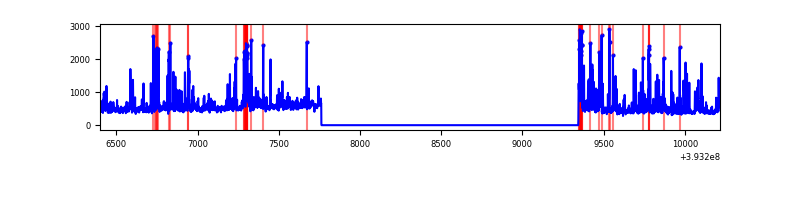 |
Top three noisy pixels from each quadrant. If the there are fewer than three noisy pixels in the level2.evt file, extra rows are filled as -1
| Pixel properties | Quadrant properties | ||||||
|---|---|---|---|---|---|---|---|
| Quadrant | DetID | PixID | Counts | Sigma | Mean | Median | Sigma |
| A | 10 | 83 | 89106 | 1672.35 | 258 | 253 | 53.1 |
| A | 9 | 143 | 34067 | 636.43 | 258 | 253 | 53.1 |
| A | 13 | 6 | 4390 | 77.86 | 258 | 253 | 53.1 |
| B | 5 | 236 | 274838 | 5582.95 | 250 | 243 | 49.2 |
| B | 5 | 172 | 113752 | 2307.82 | 250 | 243 | 49.2 |
| B | 4 | 171 | 39749 | 803.22 | 250 | 243 | 49.2 |
| C | 0 | 10 | 103899 | 1724.53 | 252 | 253 | 60.1 |
| C | 15 | 214 | 98184 | 1629.44 | 252 | 253 | 60.1 |
| C | 0 | 207 | 15802 | 258.72 | 252 | 253 | 60.1 |
| D | 12 | 6 | 158924 | 2532.38 | 252 | 244 | 62.7 |
| D | 13 | 171 | 118210 | 1882.62 | 252 | 244 | 62.7 |
| D | 2 | 250 | 59538 | 946.27 | 252 | 244 | 62.7 |
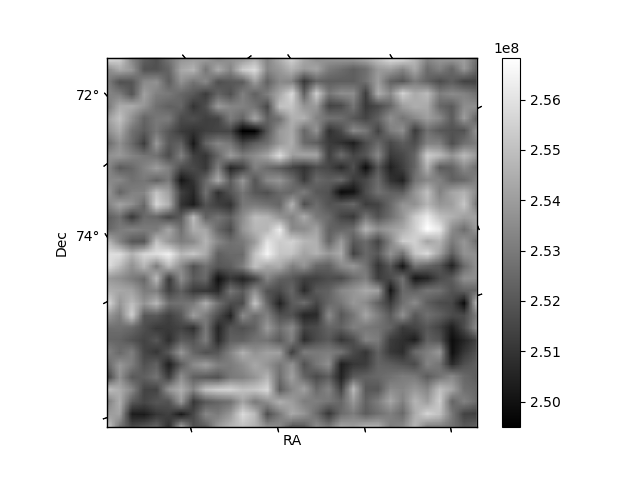
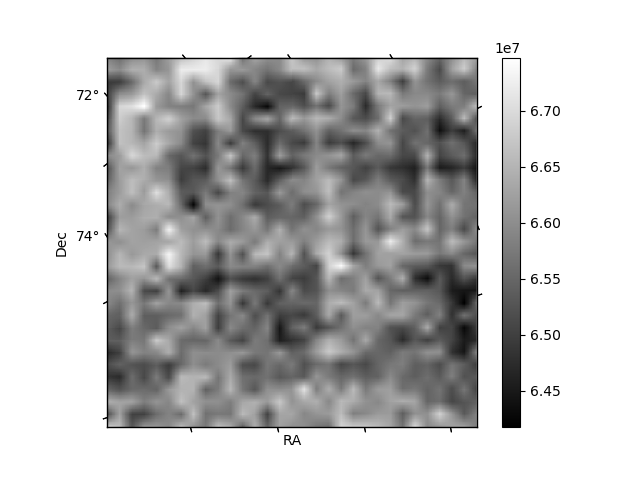
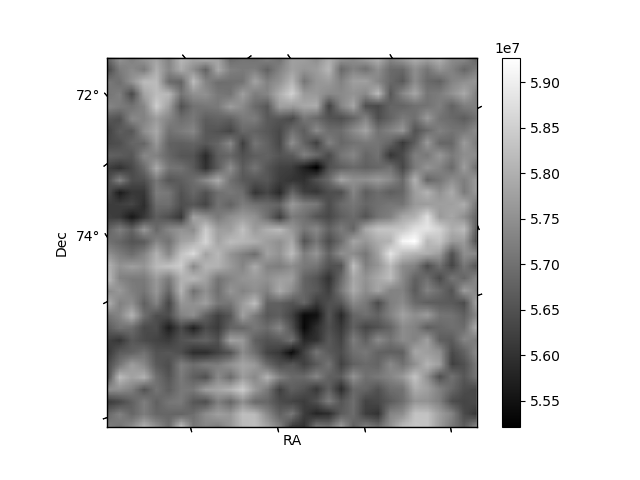
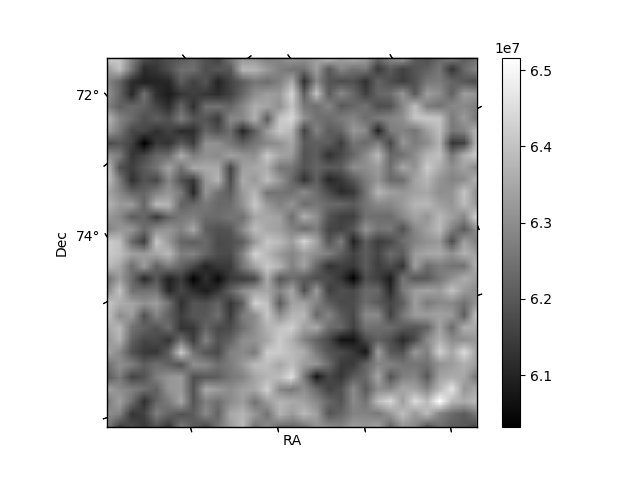
Histogram calculated using DETX and DETY for each event in the final _common_clean file
| Quadrant A | 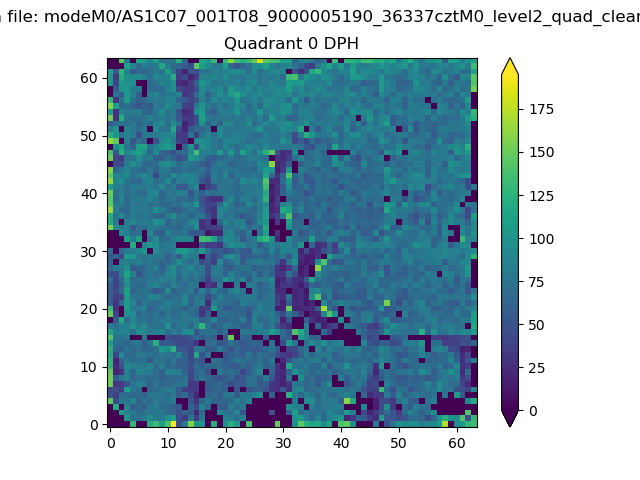 |
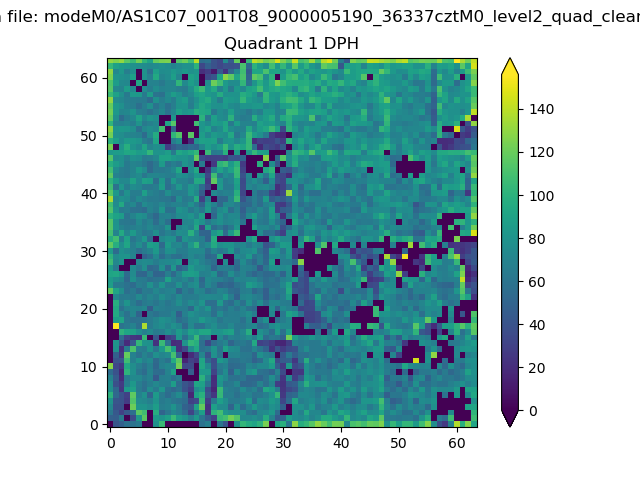 |
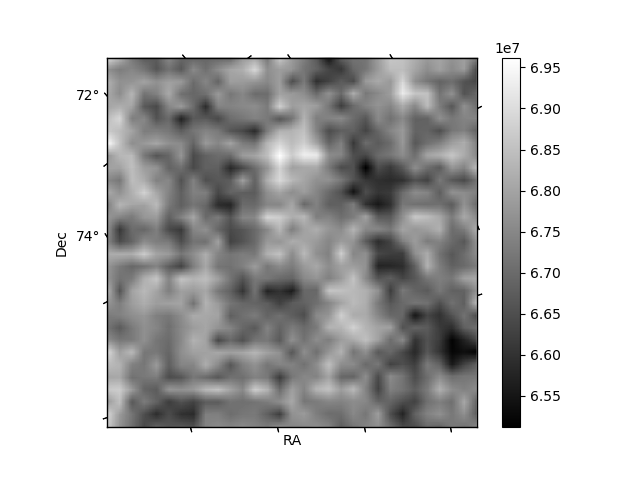
Quadrant B |
|---|---|---|---|
| Quadrant D | 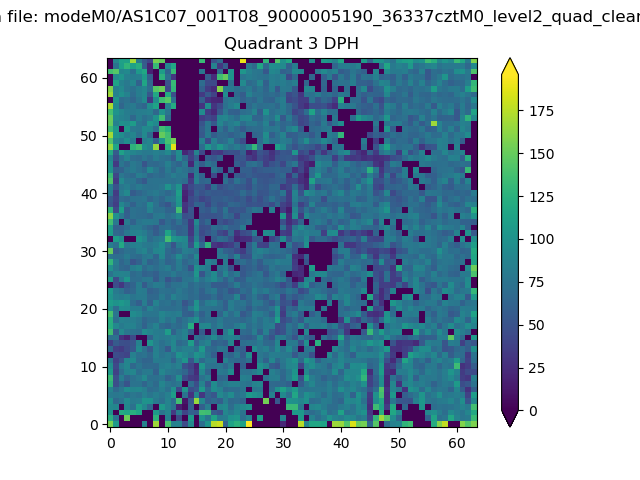 |
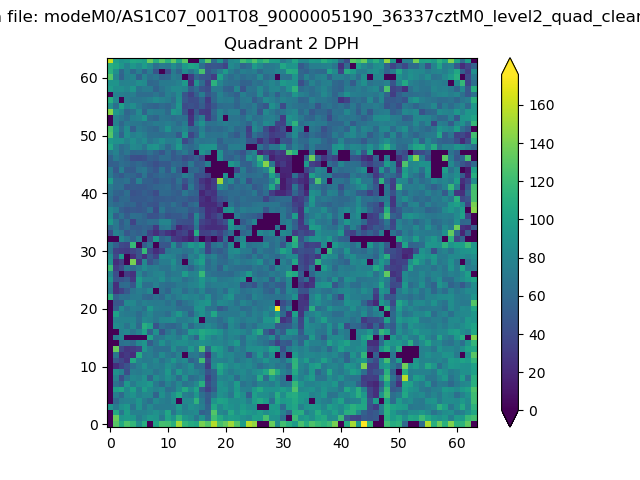 |
Quadrant C |
| Plot type | Count rate plots | Images |
|---|---|---|
| Comparison with Poisson distribution Blue bars denote a histogram of data divided into 1 sec bins. Red curve is a Poisson curve with rate = median count rate of data. |
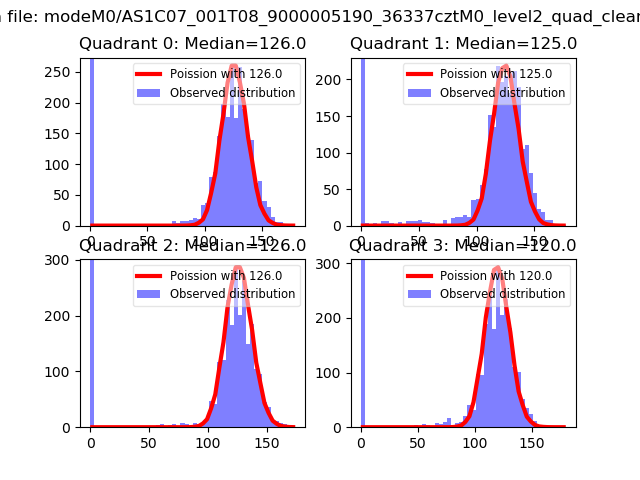 |
 |
| Quadrant-wise count rates Data is divided into 100 sec bins |
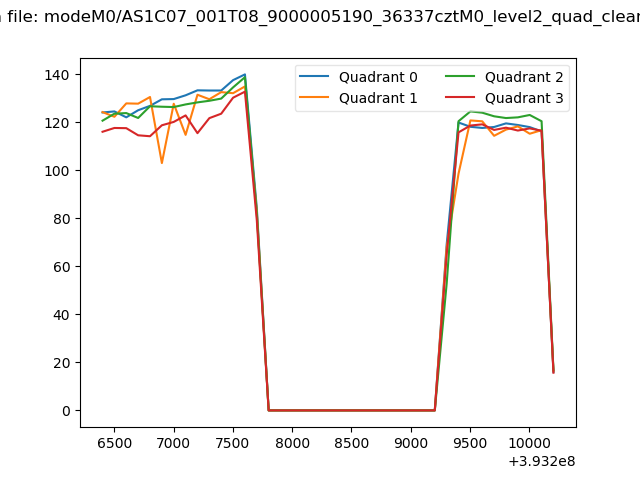 |
|
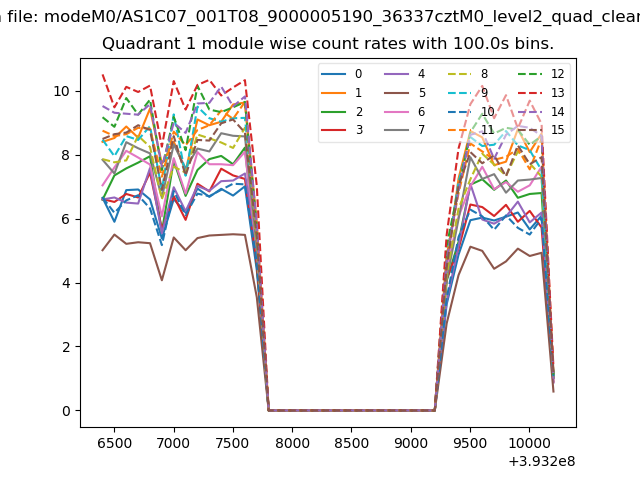
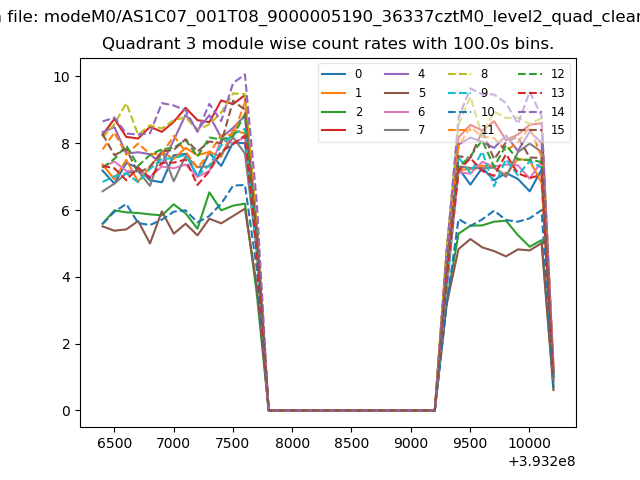
| Module-wise count rates for Quadrant A Data is divided into 100 sec bins |
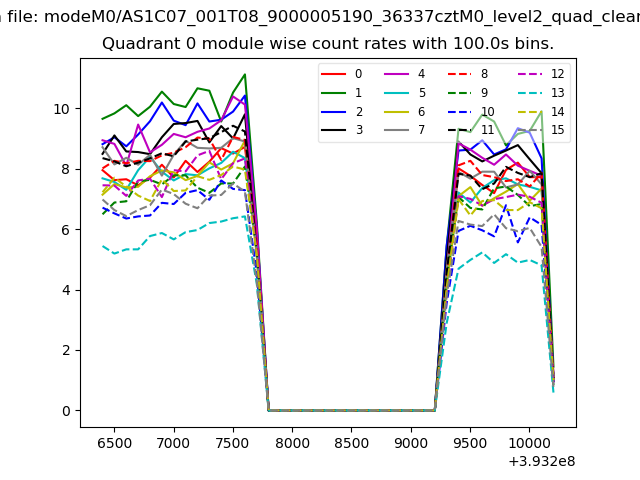 |
 |
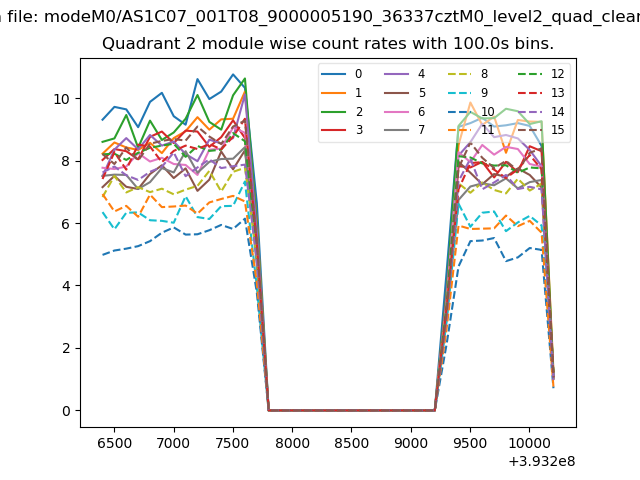
| Module-wise count rates for Quadrant B Data is divided into 100 sec bins |
 |
 |
| Module-wise count rates for Quadrant C Data is divided into 100 sec bins |
 |
 |
| Module-wise count rates for Quadrant D Data is divided into 100 sec bins |
 |
 |
| Parameter | Plot |
|---|---|
| CZT HV Monitor | 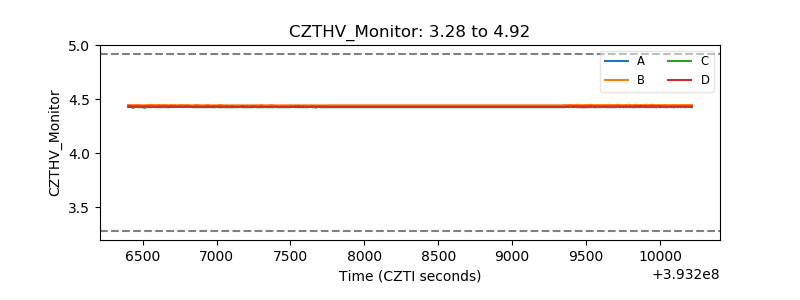 |
| D_VDD | 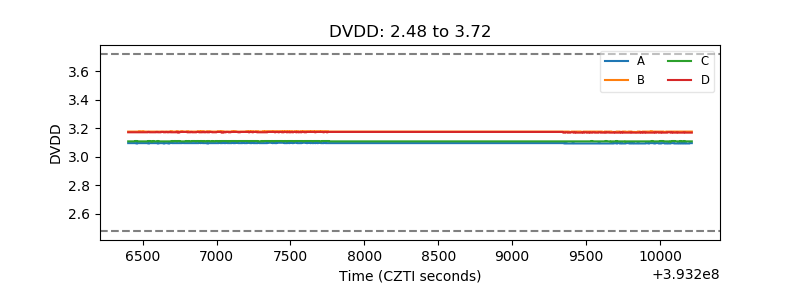 |
| Temperature 1 | 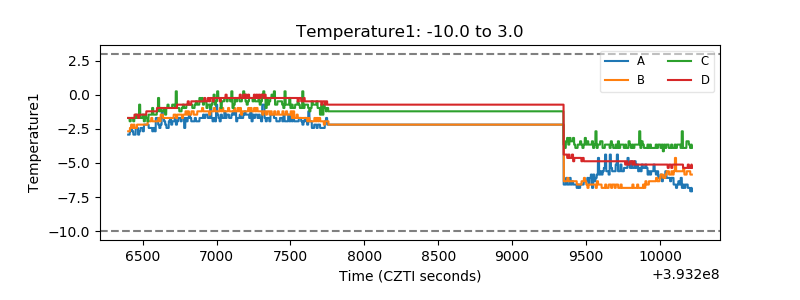 |
| Veto HV Monitor | 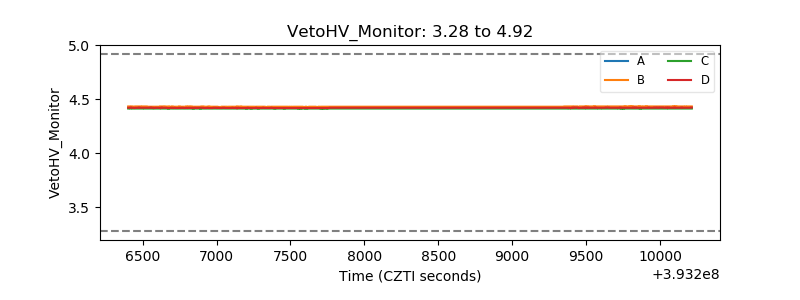 |
| Veto LLD | 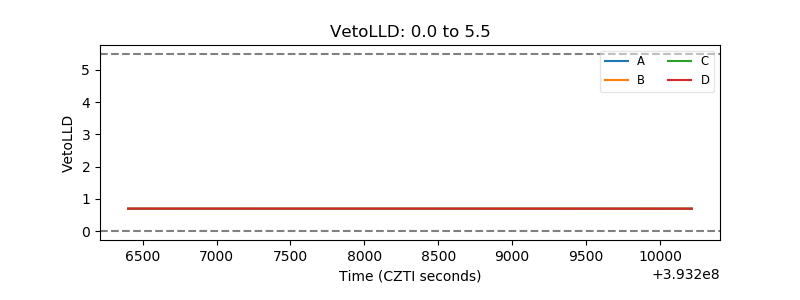 |
| Alpha Counter | 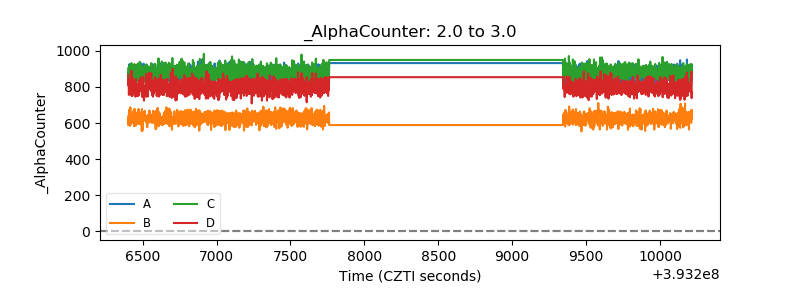 |
| _CPM_Rate | 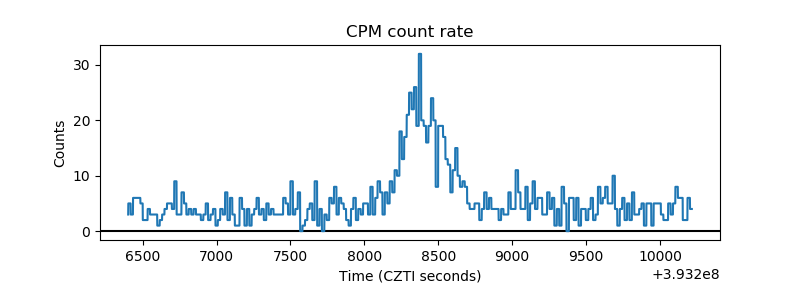 |
| CZT Counter | 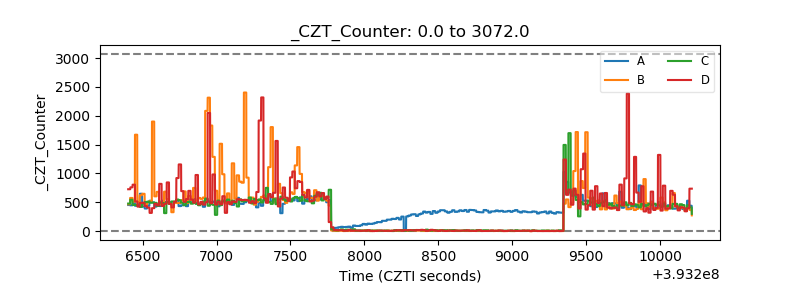 |
| +2.5 Volts monitor | 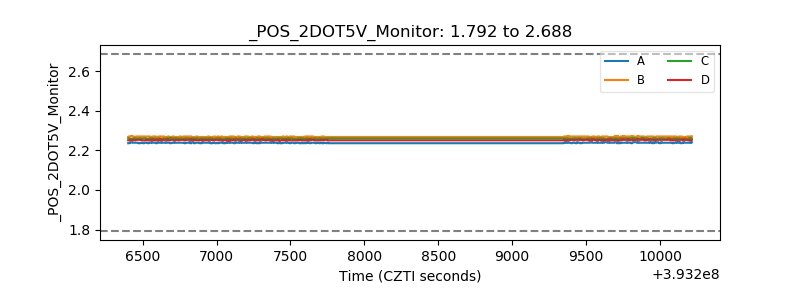 |
| +5 Volts monitor | 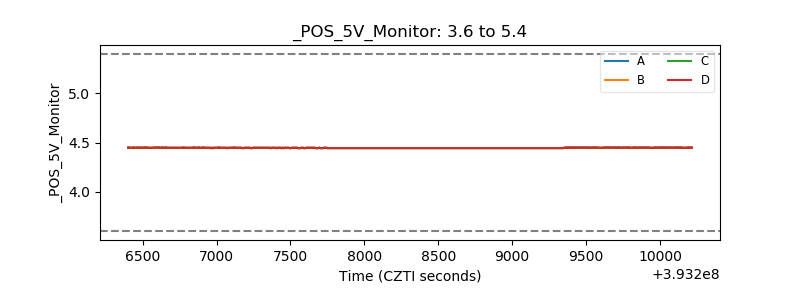 |
| _ROLL_ROT | 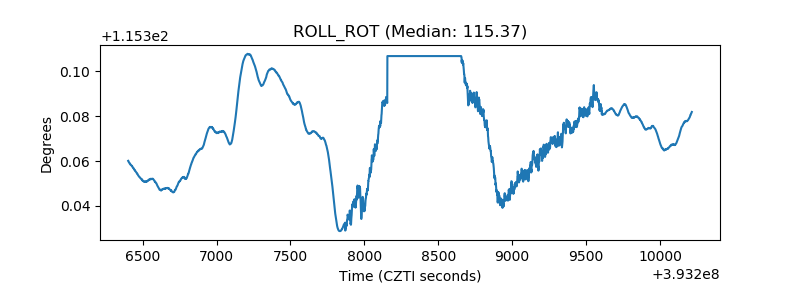 |
| _Roll_DEC | 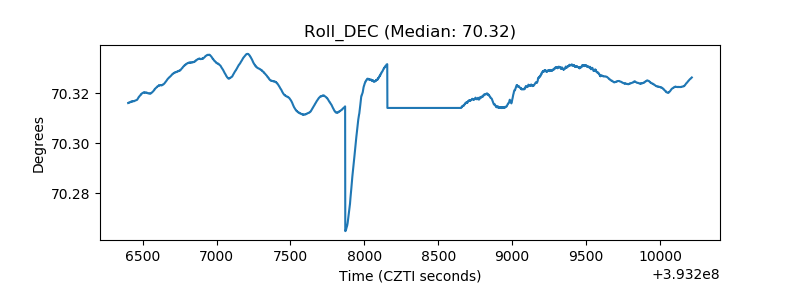 |
| _Roll_RA | 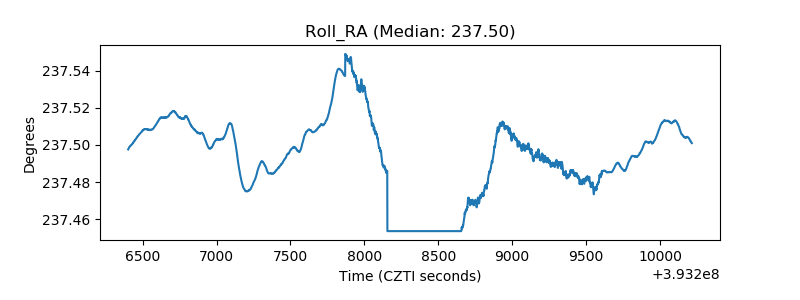 |
| Veto Counter | 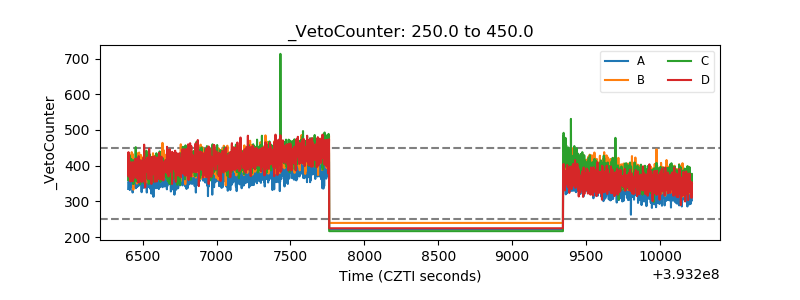 |